

Thinkhubstudio
|
Investment Results |
Full Year 2019 |
Full Year 2020 |
Full Year 2021 |
Full Year 2022 |
Since Inception1 |
|
LVS Defensive Portfolio (net of fees) |
7.0% |
13.2% |
9.1% |
3.8% |
37.1% |
|
Benchmark: Barclays High-Yield Bond Index |
13.4% |
5.0% |
4.0% |
(11.4%) |
9.7% |
|
LVS Growth Portfolio (net of fees) |
– |
61.8% |
16.1% |
(35.8%) |
20.6% |
|
Benchmark: S&P 500 Total Return Index |
– |
18.4% |
28.7% |
(18.1%) |
24.8% |
|
Note: investment performance is presented net of all fees and expenses. Investment results are as of December 31, 2022. (1) LVS Defensive was incepted on January 1, 2019. LVS Growth was incepted on January 1, 2020. |
Dear Investors,
For the full year, the Defensive Portfolio gained 3.8% (net of all fees and expenses). We beat our benchmark by 15.2% in 2022, making it our strongest year of relative performance. Since inception, Defensive is out-pacing the Barclays High-Yield Bond Index, the benchmark, by over 27%.
The Growth Portfolio declined 35.8% (net of all fees and expenses). Growth underperformed the benchmark by 17.7% in 2022. Since inception, Growth is trailing the S&P 500 by 4.2%.
The first part of this letter will discuss the Defensive Portfolio and what we learned in 2022. The second part will review the Growth Portfolio and new investments made during Q4 2022.
2022 Year in Review: Defensive Portfolio
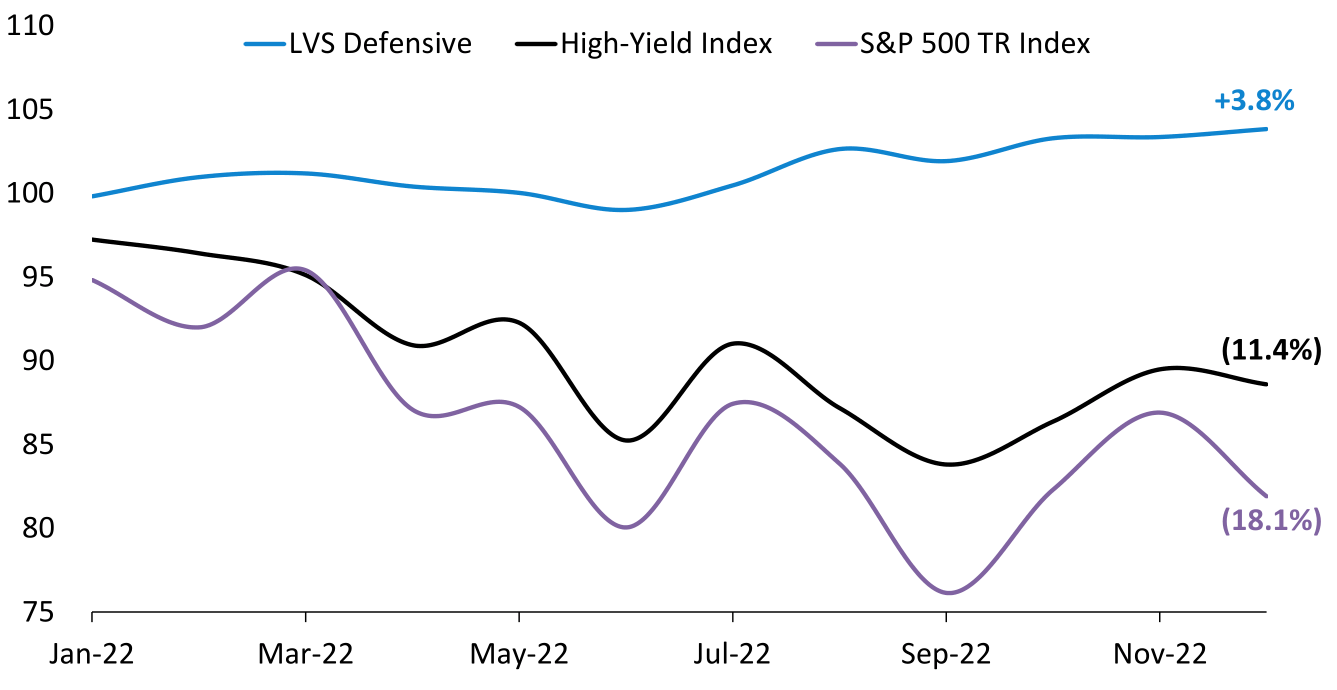
2022 could be seen as the best year since inception for the Defensive Portfolio. In a year where stocks and bonds were down double digits, we made money. More importantly, we protected our investor’s capital throughout the year, suffering a max drawdown of only 2.4% in June 2022. The S&P 500 suffered a 24.5% max drawdown in 2022, 10x worse.
The prior year was a good reminder that slow and steady can win the investing race. By not losing money, the Defensive Portfolio has outperformed many other investments and has done so with a much smoother ride. In fact, the Defensive Portfolio is now outperforming the S&P 500 Total Return Index over the last 3 years.
|
Investment Strategy |
3 Year Total Return (2020 – 2022) |
|
LVS Defensive (net of fees) |
28.2% |
|
S&P 500 Total Return Index |
24.8% |
|
Barclays High-Yield Index |
(3.3%) |
Despite our favorable comparisons, I am slightly disappointed by the returns we achieved in 2022 because I know we could have done better.
We monitor several measures of macroeconomic health, and the economic picture painted during the first half of 2022 made us cautious. In addition to the equity market price action, the high yield bond market signaled distress. Furthermore, the primary market for high yield credit shut down over the summer. This meant that borrowers could not tap high yield bonds to finance M&A activity, posing a risk to several of our arb investments.
In response to deteriorating market conditions, we took several actions over the summer to reduce our portfolio risk. We exited positions in deals that were planning to tap the high-yield market for financing, taking modest losses during this process. We took similar action in late February/Early March 2020 which I wrote about in our May 2020 investor letter. Our risk management actions saved us from losses during the sharp sell-off in spring 2020, and based on our risk management process, it made sense to reduce portfolio risk in Q2 2022 as well. However, we were positively surprised with how merger arb situations played out in 2022.
The first surprise came when banks stepped in and backstopped all the M&A transactions with financing obligations. Banks even funded large private equity buyouts where the targets had shaky financials. In doing so, banks took large losses. A few notable examples include Citrix (CTXS) producing a $700 millionloss for banks, Brightspeed closing after initially canceling a $3.9 billiondebt offering,Banks absorbing $11 billionof risky debtfrom the Nielsen buyout, and the massive $44 billion buyout of Twitterwhere banks likely lost over $500 million.
The second surprise was that few deals were re-cut and virtually none were abandoned completely by buyers. The most notable example again is the Twitter situation which went to court after Elon Musk tried to get out of his contractual obligation to close the deal. As we wrote about in our Q2 2022 letter, the results of the trial could set a precedent for future M&A deals where buyers get cold feet. In the end, Musk had a terrible showing in court and was forced to close the deal. This trial sets a very positive precedent for merger arb investors.
I stand by our decision to take risk management actions in May and June, but it came at the cost of some performance. We took a loss on Citrix and missed out on a compelling return opportunity when the spread widened out. However, once we observed that reputable banks would make good on their financing commitments, we re-evaluated several situations and re-purchased some of the event-driven stocks we took losses on earlier in the year.
We did a satisfactory job navigating 2022 but there is always room for improvement.
2022 Year in Review: Growth Portfolio
The Growth Portfolio did not have a good year. We underperformed the S&P 500 by 17.7% and suffered our first down year since inception.
There are many ways to frame our results in 2022 and the S&P 500 is probably not the best benchmark to compare against. As mentioned in our Q2 2022 letter, the Growth Portfolio has very little resemblance to the index. For starters, we typically own between 15 – 25 stocks compared to 500 stocks in the S&P. At the start of 2022, one-third of our portfolio was invested outside of the U.S. and we had significant exposure to small cap stocks and software businesses. International, small, and tech, were all factors that underperformed the S&P 500 in 2022.
A silver lining is that while we have slipped behind the S&P 500 in our trailing 3 year returns, we are still ahead of benchmarks that represent U.S. small cap stocks and global stocks.
|
Investment Strategy |
3 Year Total Return (2020 – 2022) |
|
S&P 500 Total Return Index |
24.8% |
|
LVS Growth (net of fees) |
20.6% |
|
MSCI World (Global Stock Index) |
17.5% |
|
Russell 2000 (Small Cap Index) |
9.3% |
However, you won’t find any excuses from me. We underperformed in 2022 due to the decisions I made (as portfolio manager). In my opinion, the S&P 500 is the gold standard measure to beat for a long-only equity strategy and I intend to beat it over the long run.
So where does the Growth Portfolio go from here? I have been hard at work righting the ship. There were several stocks that we sold during the year due to an underlying deterioration in business fundamentals – I wrote about this extensively in our March 2022 investor letter. We increased our ownership in several existing companies that became more attractive like Endor AG (OTC:ENDRF). We also found several new attractive new stocks to bet on such as Interactive Brokers (IBKR).
There are signs that the portfolio has started to turn a corner, at least relative to the index. Virtually all of our underperformance occurred in the first half of 2022. During the second half of 2022, our performance was nearly even with the S&P 500. Given that we own several small cap stocks and pro-cyclical businesses, the fact that we underperformed the market during a downturn isn’t very surprising. I would also expect us to overshoot to the upside when the market begins to recover.
It was a humbling year for me but being humbled in the financial markets is commonplace even for investing pros.
The most important thing is that we deeply reflect on what we could have done better and make any necessary adjustments. Investing is hard and anyone that tries to convince you otherwise is either misinformed or misleading you. For the past decade, the “easy” way to invest was to simply buy and hold big tech stocks. While investors would have outperformed for several years, 2022 was the year when owning big tech proved disastrous.
The world is in a constant state of change and intelligent investors must always update their views and models. The best portfolio to invest in for the next 10 years will likely look very different from the best portfolio from the last 10 years.
Portfolio Updates: Growth Portfolio
The table below represents the top 5 positions as of the time of writing.
|
Growth Portfolio Top Holdings |
% |
|
Interactive Brokers (IBKR) |
10.2% |
|
SS&C (SSNC) |
8.2% |
|
Charles Schwab (SCHW) |
7.6% |
|
BJ’s Wholesale (BJ) |
6.1% |
|
Endor AG (E2N, OTC:ENDRF) |
5.6% |
|
Total Top 5 Positions |
37.7% |
|
Total Top 10 Positions |
62.2% |
I made the following changes to the Growth Portfolio in Q4 2022:
New Position: BJ’s Wholesale Club (BJ)
We purchased shares of BJ’s Wholesale Club. BJ’s fits the description of a company that is thriving in the current economic environment and has the potential to compound value for many years to come. The business is a discount wholesale club like Costco (COST) but focused on a more middle-class income demographic (Costco tends to skew higher income). BJ’s charges an annual membership fee of $55 to $110 and delivers extreme savings of 30% on average compared to traditional grocery and general merchandise stores. This is a strong value proposition for a family that shops once or twice per month for household essentials.
Discount retailers tend to outperform during recessionary periods as well as inflationary periods when consumers are looking for bargains. During the 2008/2009 recession, discounters such as Dollar General posted strong sales comps. We studied several discount retail concepts this summer and determined that BJ’s presents the best long-term opportunity. The wholesale club model creates a sticky and differentiated customer experience because of the membership dynamics. Wholesale clubs build strong brand loyalty and have pricing power in their membership fees. Membership fee income is pure profit and provides a powerful business lever for long-term earnings growth.
Investors appreciate the quality of the wholesale club model and have awarded Costco a 32x price-to-earnings multiple. Despite BJ’s being a ‘Costco clone’, its stock only trades for 17.5x earnings – a near 50% discount(!). Finally, with just 226 store units compared to Costco’s 847 units, BJ’s has a significant opportunity to grow its store base and is currently accelerating new unit openings. Putting it all together, I believe BJ’s is an attractively priced stock with a business that is high quality, economically durable, and has a long runway to reinvest for growth.
New Position: BlackRock (BLK)
We purchased shares of BlackRock. BlackRock is one of the world’s largest investment managers, a business I know something about. BlackRock is an investment powerhouse as it has a leading position in virtually every category and has been gaining market share over time.
BlackRock is competitively advantaged because it has industry-leading technology (Aladdin platform) that enables investment organizations to outsource most of the back-office. Also, the company’s industry-leading scale allows it to price its investment products competitively while retaining more profitability. The combination of leading tech and lower prices makes it very difficult to compete against BlackRock. Furthermore, we believe that investors misunderstand the pricing headwinds in the ETF market by mistaking FX headwinds and mix shift for “fee compression”. We have a differentiated view that BlackRock will see more robust advisory fee rates than the market currently expects.
2022 was an awful year for asset managers. BlackRock saw its assets under management decline by ~20% and BlackRock’s stock has fallen by over 20% in response. However, this drop in assets will reverse as the financial markets recover and investors add to their retirement accounts and portfolios. I view this as a good opportunity to buy a quality business facing short-term headwinds at an attractive price.
Better yet, BlackRock is highly profitable and returns 80% of earnings to shareholders in the form of dividends and buybacks. The stock sports nearly a 3% dividend yield and the share count has been reduced by nearly 2% per year on average. I generally prefer to own businesses that prioritize capital reinvestment for long-term earnings growth, but BlackRock doesn’t require much investment to grow given the capital light nature of the investment industry. This has created a unique situation where investors can simultaneously benefit from a high dividend yield and attractive earnings growth.
We sold our remaining shares of Google in the quarter, taking a profit. Google was a day 1 holding for the Growth Portfolio and it has performed well.
18 years after its initial public offering, Google is showing signs of business maturity. During the 2008/2009 recession, Google’s business was able to power through with double digit growth. As of Q3 2022, Google’s core search business has decelerated to low single digit growth and the YouTube and display network businesses reported revenue decline. At the same time, the company’s spending is outpacing the rate of expected revenue growth. Advertising spend is cyclical and the digital advertising industry is fragmenting as many major consumer platforms are scrambling to turn on new streams of revenue (Netflix, Spotify, TikTok, etc.).
My best guess is that Google’s financial results could be quite disappointing, and my estimates are far below what Wall Street analysts are currently modeling. I do not make sell decisions purely based on near term results expectations as they are generally priced into the stock but my downbeat assumptions for Google come at a time when we are finding more value in other areas of the market that we would prefer to allocate to.
Until next time
Dozens of articles are written every day containing hyperbolic headlines either proclaiming the next crash is coming or that the time to go all-in on a certain stock is now. I will continue to ignore the noise and focus on simple investing principles that work. In the Defensive Portfolio, we will continue to protect capital while investing in event-driven securities that produce high-single digit to low-double digit yields. In the Growth Portfolio, we will continue investing in good companies with attractive long-term prospects. I am looking forward to a prosperous 2023.
Best regards,
Luis V. Sanchez CFA
LEGAL DISCLAIMERThe information and statistical data contained herein have been obtained from sources, which we believe to be reliable, but in no way are warranted by us to accuracy or completeness. We do not undertake to advise you as to any change in figures or our views. This is not a solicitation of any order to buy or sell. We, any officer, or any member of their families, may have a position in and may from time to time purchase or sell any of the above mentioned or related securities. Past results are no guarantee of future results. This report includes candid statements and observations regarding investment strategies, individual securities, and economic and market conditions; however, there is no guarantee that these statements, opinions or forecasts will prove to be correct. These comments may also include the expression of opinions that are speculative in nature and should not be relied upon as statements of fact. LVS Advisory LLC is committed to communicating with our investment partners as candidly as possible because we believe our investors benefit from understanding our investment philosophy, investment process, stock selection methodology and investor temperament. Our views and opinions include “forward-looking statements” which may or may not be accurate over the long term. You should not place undue reliance on forward-looking statements, which are current as of the date of this report. We disclaim any obligation to update or alter any forward-looking statements, whether as a result of new information, future events or otherwise. While we believe we have a reasonable basis for our appraisals and we have confidence in our opinions, actual results may differ materially from those we anticipate. The information provided in this material should not be considered a recommendation to buy, sell or hold any particular security. |
Editor’s Note: The summary bullets for this article were chosen by Seeking Alpha editors.
Editor’s Note: This article discusses one or more securities that do not trade on a major U.S. exchange. Please be aware of the risks associated with these stocks.
Be the first to comment