

New Zealand Dollar Talking Points
NZD/USD struggles to preserve the rebound from late last week as the Reserve Bank of New Zealand (RBNZ) launches a Large Scale Asset Purchase programme (LSAP), and the exchange rate may continue to exhibit a bearish behavior as the Relative Strength Index (RSI) sits in oversold territory.
NZD/USD RSI Sits in Oversold Zone as RBNZ Launches QE Program
NZD/USD is back under pressure as the RBNZ announces that it will “purchase up to $30 billion of New Zealand government bonds, across a range of maturities, in the secondary market over the next 12 months.”
The RBNZ went onto say that it could further support the New Zealand economy “either by increasing the size of the LSAP programme, or through the use of other instruments,” but it seems as though Governor Adrian Orr and Co. will refrain from a zero-interest rate policy (ZIRP) as the central bank insists that “there would likely be an ongoing series of Bank monetary and financial stability actions as the economic impacts of COVID-19 unfolded.”
In turn, the RBNZ may continue to deploy unconventional tools even though the government delivers a NZ$ 12.1B fiscal stimulus program as Finance Minister Grant Robertsonwarns that “a recession in New Zealand is now almost certain.”
With that said, the RBNZ’s dovish forward guidance may continue to drag on the New Zealand Dollar, and NZD/USD may exhibit a bearish behavior over the remainder of the month as the Relative Strength Index (RSI) sits in oversold territory.

Recommended by David Song
Forex for Beginners
Sign up and join DailyFX Currency Strategist David Song LIVE for an opportunity to discuss potential trade setups.
NZD/USD Rate Daily Chart
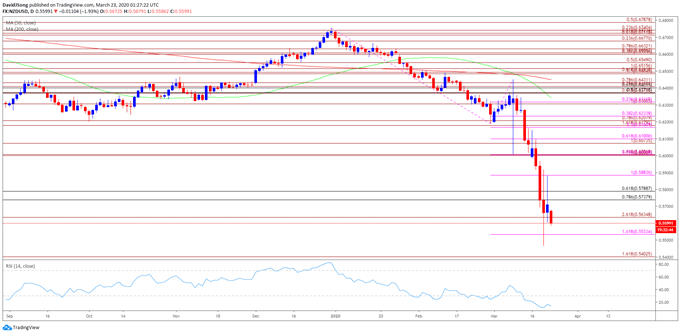
Source: Trading View
- Keep in mind, NZD/USD has failed to retain the range from the second half of 2019 as the decline from earlier this year produced a break of the October low (0.6204), with a ‘death cross’ taking shape in March as the 50-Day SMA (0.6342) crosses below the 200-Day SMA (0.6448).
- Recent developments in the Relative Strength Index (RSI) suggest the bearish momentum will persist as the oscillator holds below 30 and sits in oversold territory.
- Break/close below the Fibonacci overlap around 0.5740 (78.6% retracement) to 0.5790 (61.8% retracement) brings the 0.5640 (261.8% expansion) level in focus, with a close below the stated region bringing the 0.5530 (161.8% expansion) area on the radar.

Recommended by David Song
Traits of Successful Traders
— Written by David Song, Currency Strategist
Follow me on Twitter at @DavidJSong
Be the first to comment