

Duncan Nicholls and Simon Webb
Thesis
Nvidia (NASDAQ:NVDA) stock has been completely taken over by the sellers lately, both in the open market (see the first figure below) and also by insiders (see the second figure below). To wit, in the open market, it not only suffered a large share price plunge (from a peak of around $290 to the current level of $121) but also suffered heavy trading volume under declining prices. To wit, as you can see from the 1st chart below, most of the selling volume occurred in a price range around $160 to $180 (highlighted in the yellow box), effectively forming a ceiling for its stock prices in the near term.
Source: Author based on data from stockcharts.com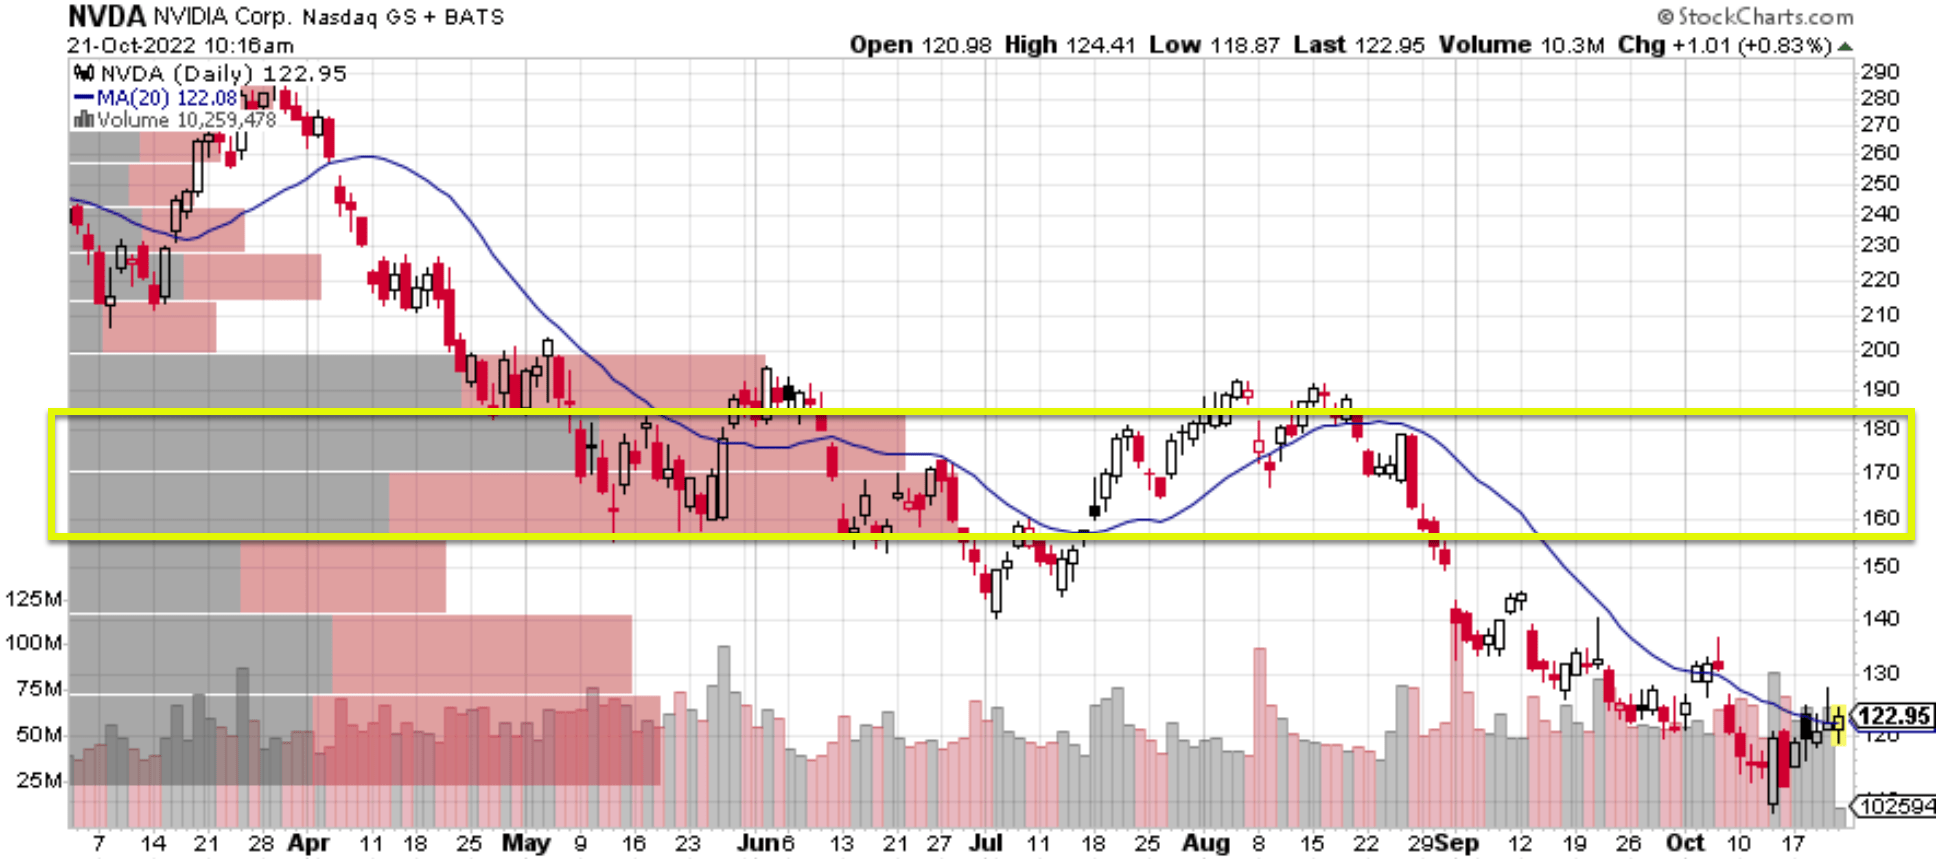
Among the insiders, their activities are also completely dominated by selling activities as you can see from the 2nd chart below. Over the past 1 year, there were a total of 88 insider transactions and not a single one of them is a buying activity. All 88 have been selling activities with a cumulative amount totaling $530.2M. In Oct alone, one of its directors made 3 sales totaling more than $20 million worth of NVDA shares.
Source: DataRoma.com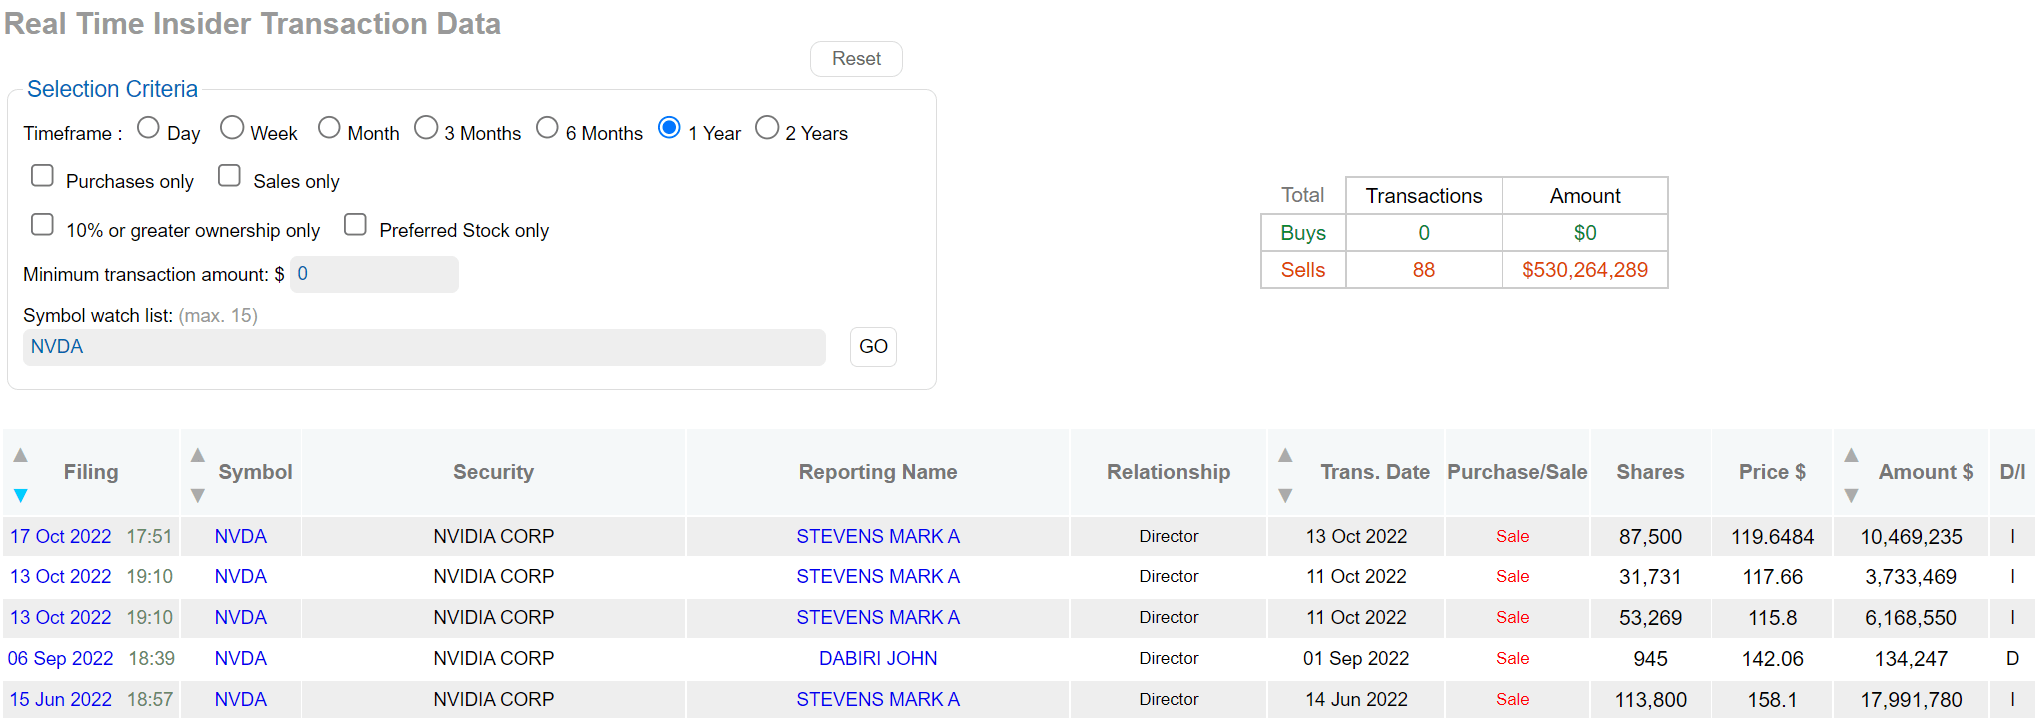
As explained in my earlier article,
When it comes to insider activities, usually I pay more attention to buying activities than selling activities. The reason is that selling activities can be triggered by a range of factors irrelevant to business fundamentals (such as divorce or buying a new house). In contrast, insider buying activities usually have only one explanation – the insiders think the stock is undervalued.
However, in NVDA’s case here, when the insider activities are so completely one-sided, I do pay attention. And it is precisely the thesis of this article to examine the insider selling activities. And you will see that my conclusion is that the insiders are betting rationally in this case. Their bets are consistent with a Kelly bet analysis as you will see next. The return profile in the near term is indeed not favorable.
Valuation still expensive
First of all, despite the sharp price correction mentioned above and all the headwinds on the horizon (to be detailed immediate in the next section), NVDA is currently still trading at a large premium, both compared to the overall market and its peers seen in the chart below. Its FW P/E is about 38.6x, more than 2x higher than AMD’s 157x and more than 3x higher than INTC’s 12.1x. Note that NVDA’s P/E bottomed near 25x in 2021. And for the remainder of this article, I will use a 25x P/E as a floor for its valuation in the near term given the headwinds to be detailed next.
Source: Seeking Alpha data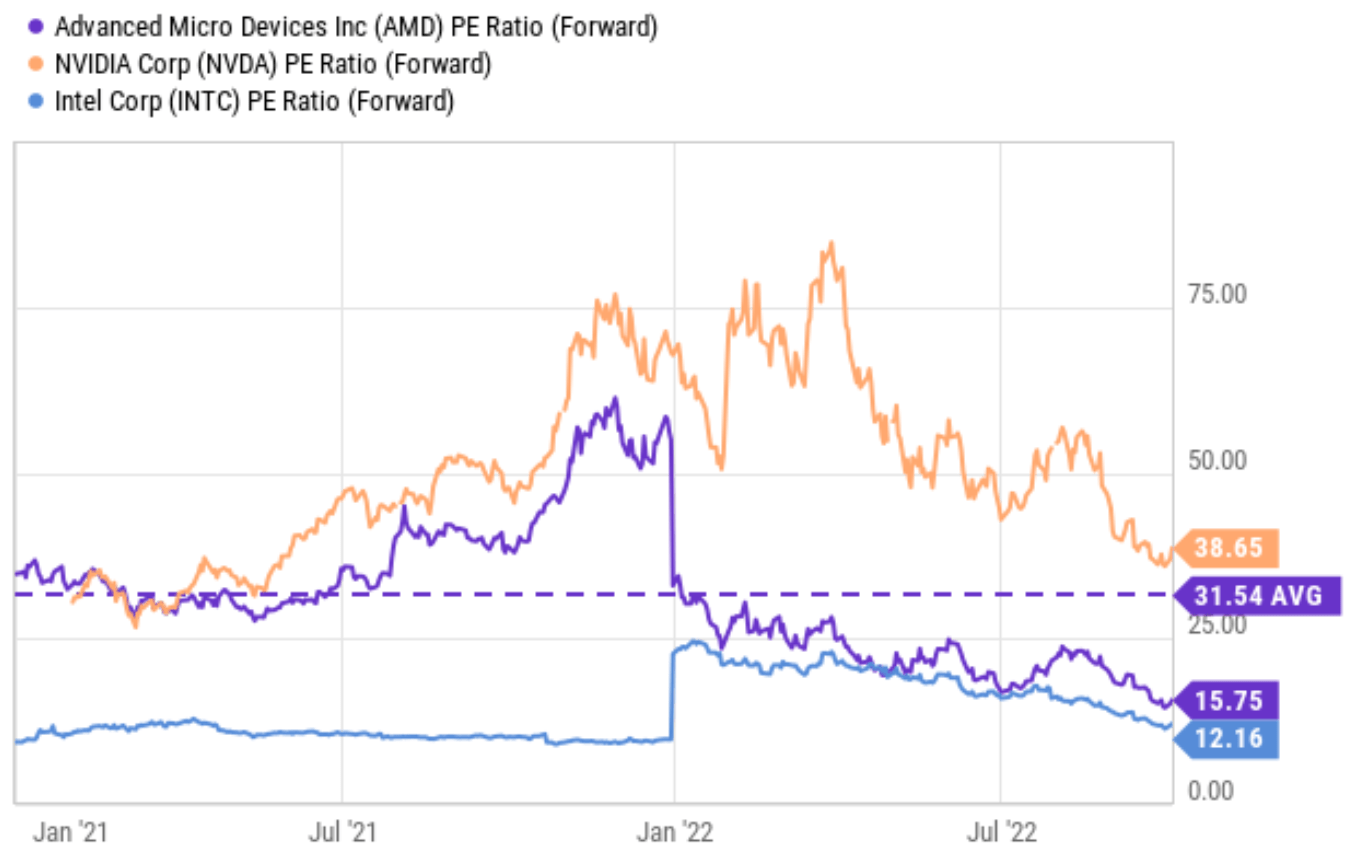
Near-term headwinds and key price targets
NVDA reported worse-than-expected July period results already due to a range of headwinds. EPS came in at $0.51 a share, a sharp 56% decrease from the previous quarter. And looking forward, I expect these headwinds to persist. More specifically, I foresee the following headwinds to keep muting its topline growth and also pressuring its margins:
- Continued contraction of several key segments, including its gaming (second-largest market) and professional visualization businesses. The fall in cryptocurrency prices will keep pressuring its gaming sector demand given that a large portion of the company’s revenues is correlated with crypto mining (as detailed in my earlier article).
- Softening data center demand in China and also export restrictions. Its data center demand fell significantly in China in the last quarter, matching China’s current macroeconomic problems. Management also blamed supply chain issues for worsening the issues, and the U.S. government’s recent export restriction will make matters even worse.
- Finally, large inventory. As argued in our earlier article, NVDA is currently having its toilet paper hoarding moment due to high inventory. It just took a $1.2 billion charge off for inventory and related reserves. And I anticipate the de-inventory to continue for a while longer.
All these issues were reflected in the consensus estimates. As seen, consensus estimates now predict its EPS in the $3.1 to $7.68 range for the next two years. Note the range of variance here (more than 100%), reflecting the large uncertainties ahead, and we will explore the simplification next.
Source: Seeking Alpha data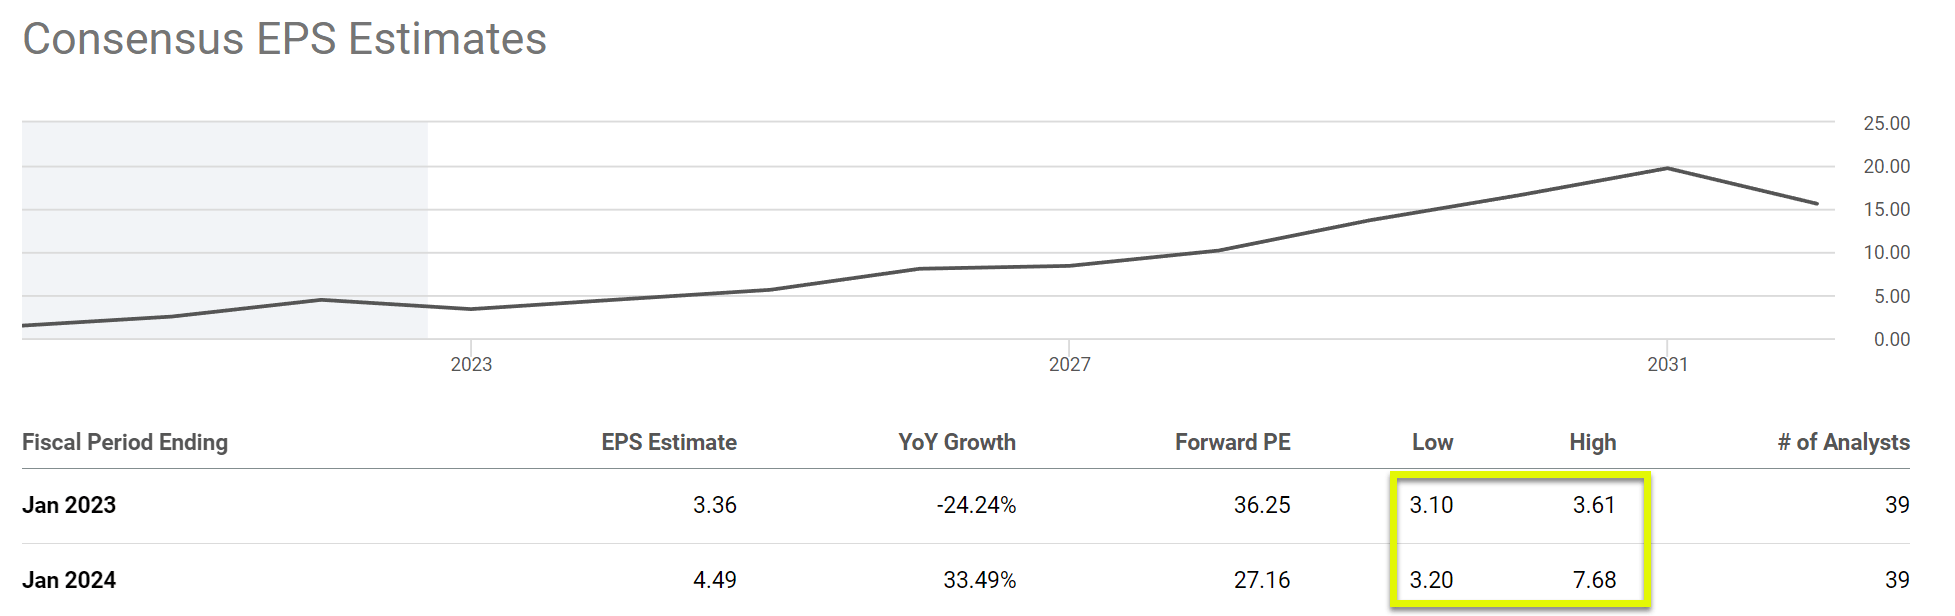
Kelly bet analysis
Considering the above valuation and business fundamentals, the next table shows the most likely scenarios in my mind in the near term (say the next 6 months or so):
- The base scenario assumes a target price of $122, essentially its 20-day moving average price. In the near term, the market is often dominated by traders with prices oscillating near the short-term running average.
- The bearish scenario assumes the 25x P/E mentioned above and a 2023 EPS of $3.61 as aforementioned, leading to a target price of $90, about 25% below the current price.
- The bullish scenario assumes a 25x P/E and the most optimistic EPS projection of $7.68 for the next 2 years, leading to a target price of $192, about 60% below the current price.
Source: Author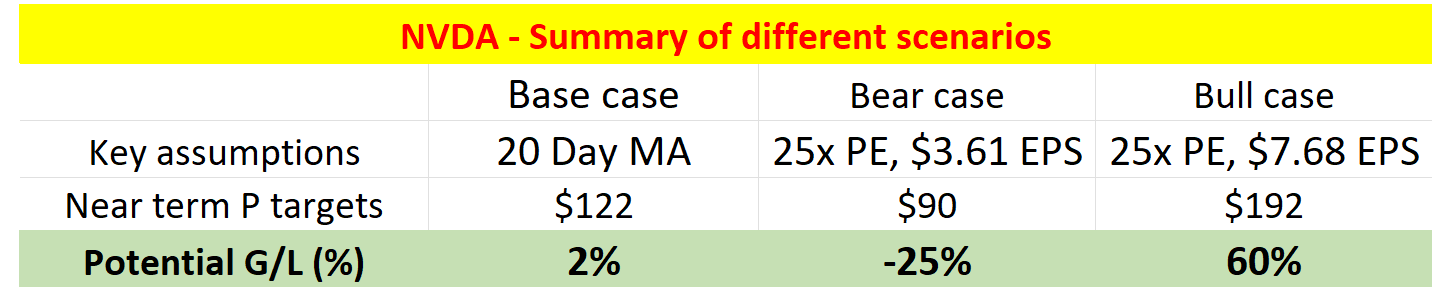
Usually, the discussion from here would turn into a subjective debate between the bulls, each with plenty of their own ammunition in the case of NVDA. This article will gauge the risk/reward profile in a more objective way using the Kelly bet size analysis as detailed in my earlier article on Altria. The key benefits of the Kelly analysis are twofold:
- The Kelly method helps to turn such subjective debate into more action-oriented decision-making. The Kelly bet analysis is a way to determine bet sizing as a percentage of bankroll that leads to optimal growth in the long run (i.e. if you place a large number of the same bet over and again).
- Another reason I use it is that it not only considers the expected return, but also the variance among the outcomes, which is equally important, or more important in high-uncertainty situations like this.
With the above background, a Kelly bet analysis is shown below for NVDA. For me, the most likely odds are: 40% for the base case (with a 2% upside), 40% for the bearish case (with a 25% downside), and 20% for the bullish case (with a 60% upside). Under these odds, the good news is that the expected return is positive. But the bad news is that it is only 0.31% – note here that 0.31% means the expected return is 0.31% each time I place such a bet with these odds. And the bet size is 27% of the bankroll – not a very convicted bet.
You can of course tweak these odds to suit your own judgment. And another set of odds that I always look at is the so-called break-even odds – i.e., the odds that make the expected return zero. As seen, the breakeven odds are not far away from the most likely odds I assigned: 40% odds for the base case, 42% for the bearish case, and 17% for the bullish case. Under these odds, the expected return is almost zero and the Kelly bet size is also almost zero too (about 5.8% of the bankroll only).
Source: Author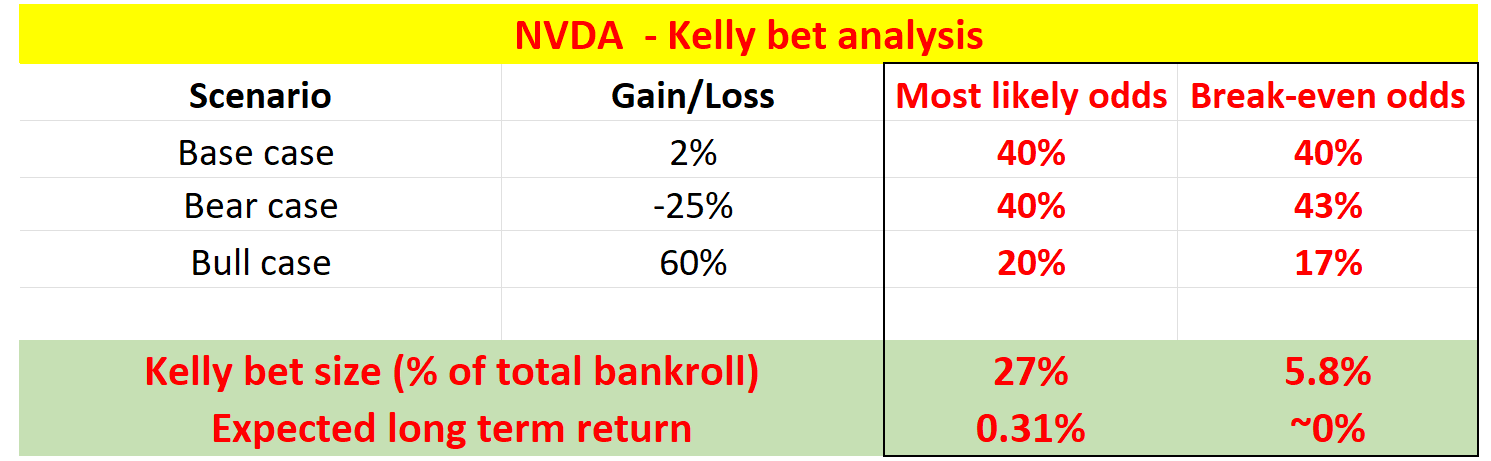
Risks and final thoughts
Since the Kelly analysis is by itself a tool for risk analysis, I won’t further repeat the various risks facing NVDA. instead, let me reiterate the limitations of the Kelly framework itself as detailed in my earlier writing:
The Kelly analysis itself cannot – nothing can – turn investment decisions into a completely scientific and objective process. If uncertainties/risks can be quantified, then they are not uncertainties/risks to start with. In the end, some degree of subjective judgment is always required based on each person’s risk tolerance. For me, the Kelly analysis maps out the bounds and limits of the risks, so I can judge if I am comfortable with those limits.
To conclude, NVDA’s insider activities are consistent with my Kelly assessment. The insiders are betting rationally – and actually quite smartly. Even at today’s prices, which are substantially lower than the prices the insiders sold their shares, the NVDA investment still does not look that attractive. The expected bet return is minimal (only 0.31%), the variance is huge (-25% downside vs 60% upside), and the bet size is not that convicted (27% bankroll).
The return profile in the near term is indeed not favorable despite the large price corrections.
Be the first to comment