

matejmo/iStock via Getty Images
Investment thesis
Despite repeatedly showing relative strength since the beginning of the year, Novartis AG (NYSE:NVS, OTCPK:NVSEF) has recently crashed into a downtrend by breaking all its relevant supports and heading towards levels not seen since 2021. Although the stock is again building up some relative strength, the risks overshadow the short-term opportunities, and I would not take any action until a bottom is confirmed or the stock tests its next support, therefore changing my rating in a short-term perspective. Investors should consider the industry and the broader healthcare market, as sector rotations and the general sentiment in the relevant group could affect the stock’s performance, which has been underperforming its major references during the past 5 years.
A quick look at the big picture
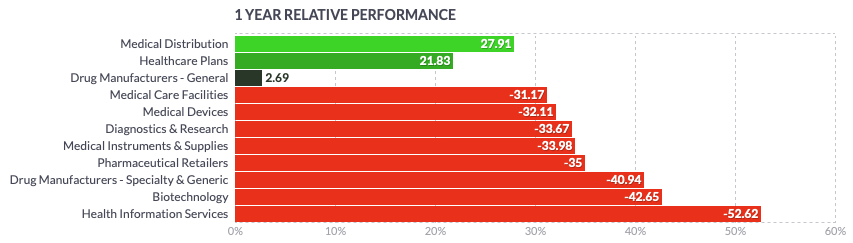
Although the healthcare sector in the U.S. has been more resilient as it has shown some relative strength in the past year, the sector has recently weakened and turned negative, led by pharmaceutical retailers, specialty and generic drug manufacturers, and companies providing health information services. Companies providing healthcare plans and medical care facilities, as well as those in the medical distribution industry, could perform better in the group.
finviz finviz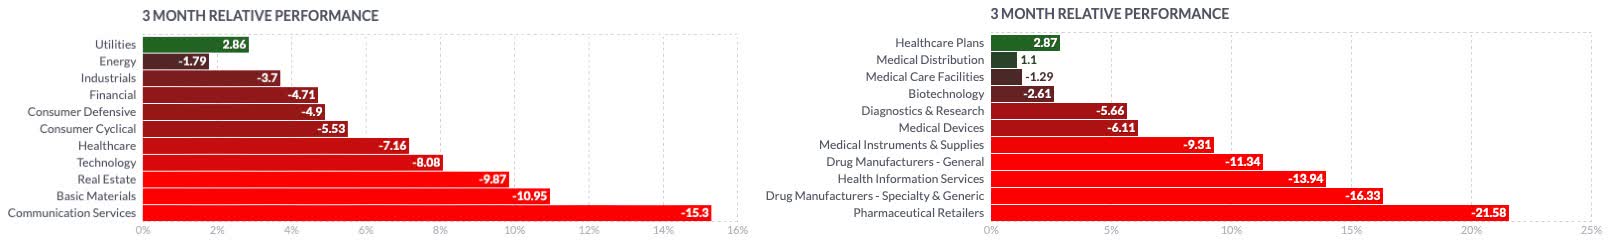
The VanEck Vectors Pharmaceutical ETF (PPH) is plunging deeper into its negative trend that began in August 2022, after initial signs of relative weakness in July. This industry reference has now reached the pre-pandemic levels and seems to be set for further weakness, as no sign of a reversal is building up, and every important short-term support has been broken.
Author, using TradingView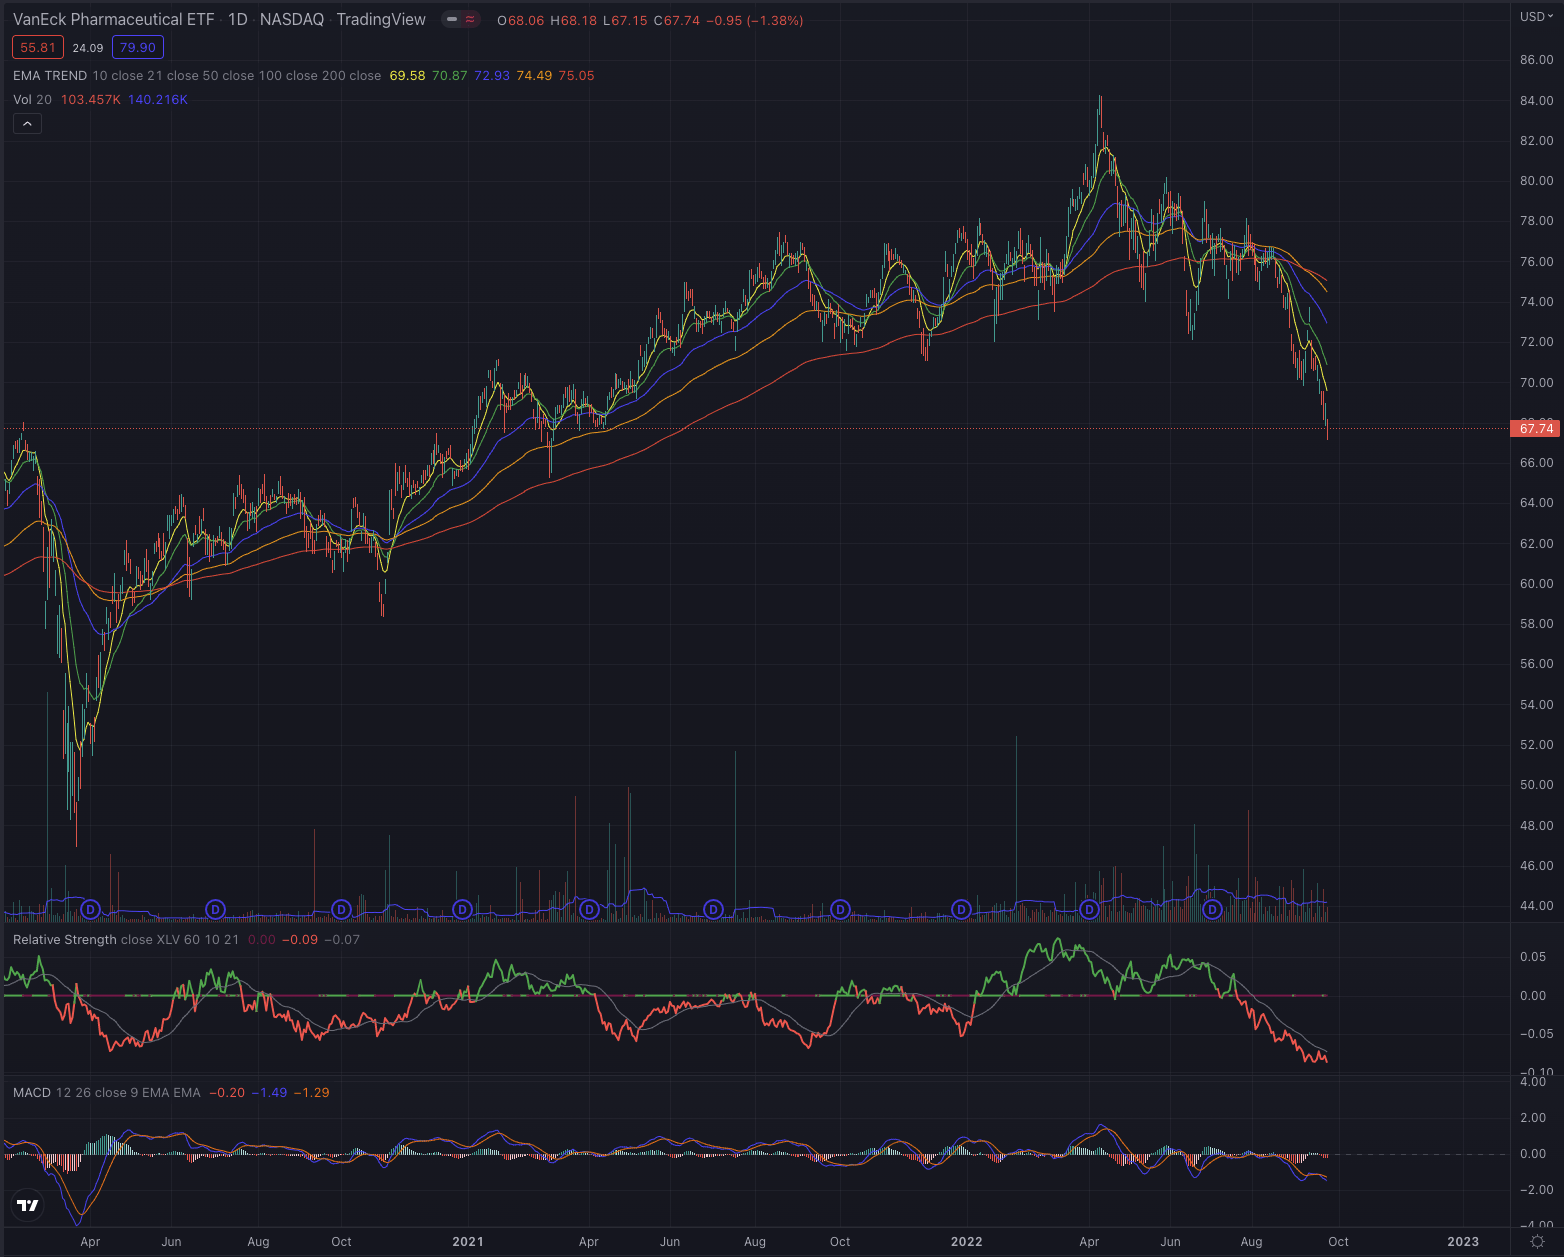
Looking back even further, Novartis significantly underperformed its main sector and industry reference, reporting a loss of -10.83% over the past 5 years, while its references all performed greatly better, with the Health Care Select Sector SPDR (NYSEARCA:XLV) reporting the highest performance at 52.11%.
Author, using SeekingAlpha.com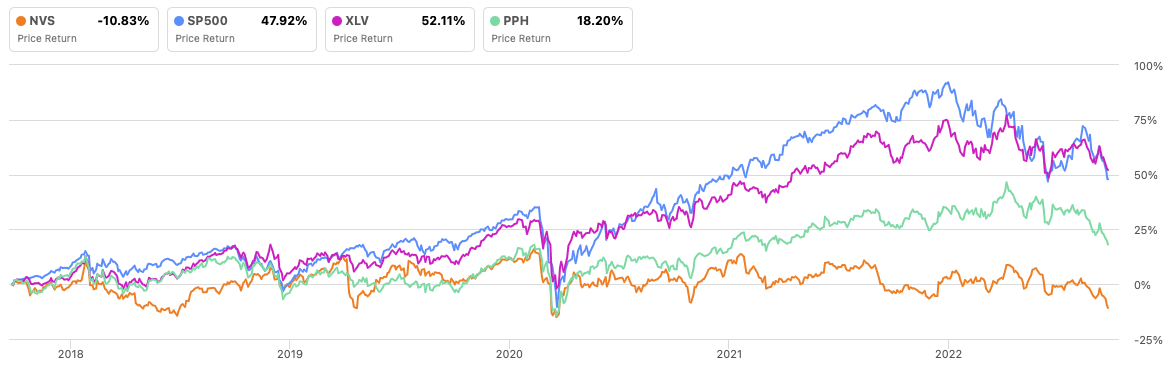
Where are we now?
The primary exchange for Novartis is the SIX Swiss Exchange under the symbol NOVN, and I always perform technical analysis at the main listing of a company’s stock. Since my last article, Novartis Is Awakening From Lethargy, published on July 6, 2022, the stock has attempted to break out of its downtrend and overcome its most important moving averages, until topping at the end of July. Then, the relative strength began to give signs of weakness and hinted at possible troubles ahead. Indeed, the new downtrend began shortly after, and the stock has since lost 12% of its value, crashing under its most important support levels and even breaking under the trend channel.
Author, using TradingView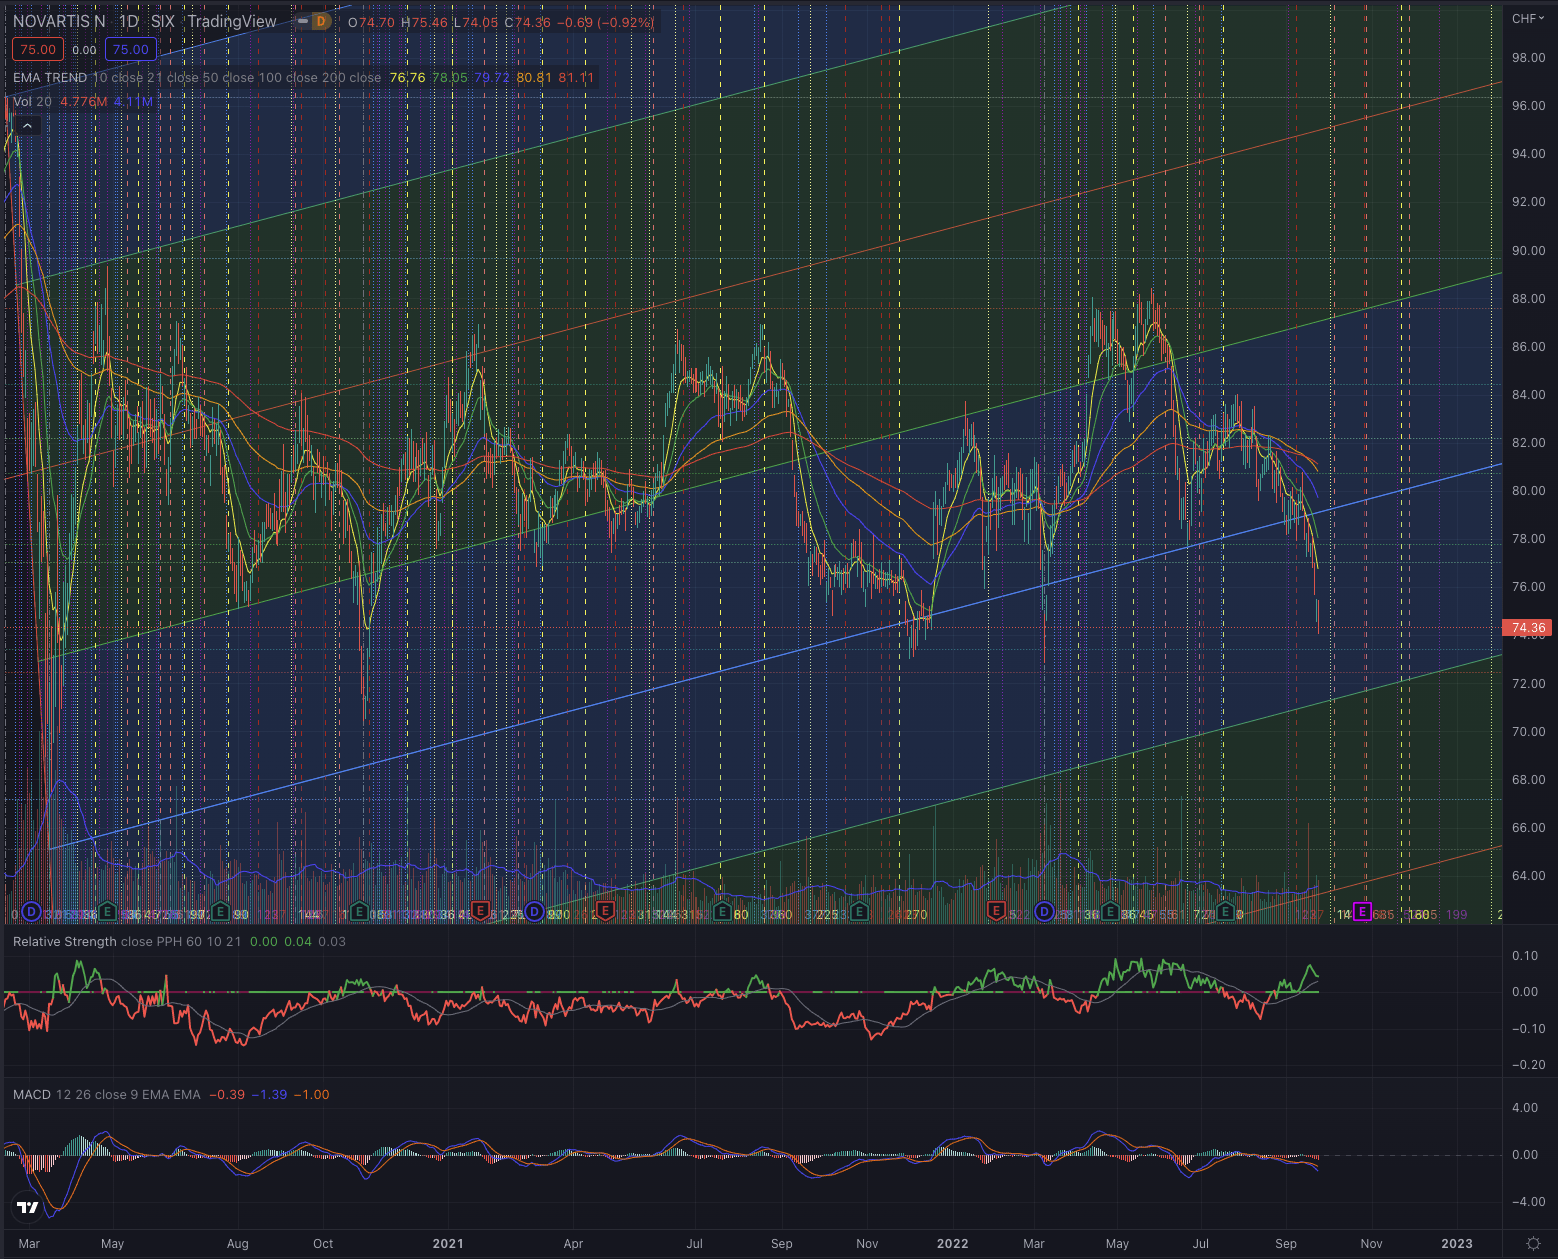
Although some relative strength seems to build up, the stock still shows significant negative momentum confirmed by its MACD and increased sell-side volume. While it is not uncommon for Novartis stock to suffer short-term pullbacks and recover shortly after, for now, there seems not to be any signs of a possible reversal. The stock still didn’t hit its next support level, and the whole industry seems to suffer under more selling pressure.
What is coming next
I expect the stock to continue to build up some relative strength while approaching its next support level, seen at CHF 73 (or around $74.60), as those price levels will show if the stock could attempt a reversal. Or, instead it could continue in its downtrend towards its next support levels, seen around CHF 70.40 (or around $73.30) and in the worst case in a short term perspective, at CHF 65 (or approximately $69.20). Despite its rather defensive nature, the Swiss Blue Chip seems to be technically in a very unfavorable situation, and I would certainly wait for a sound base forming, before considering the stock as a short-term buy position.
Author, using TradingView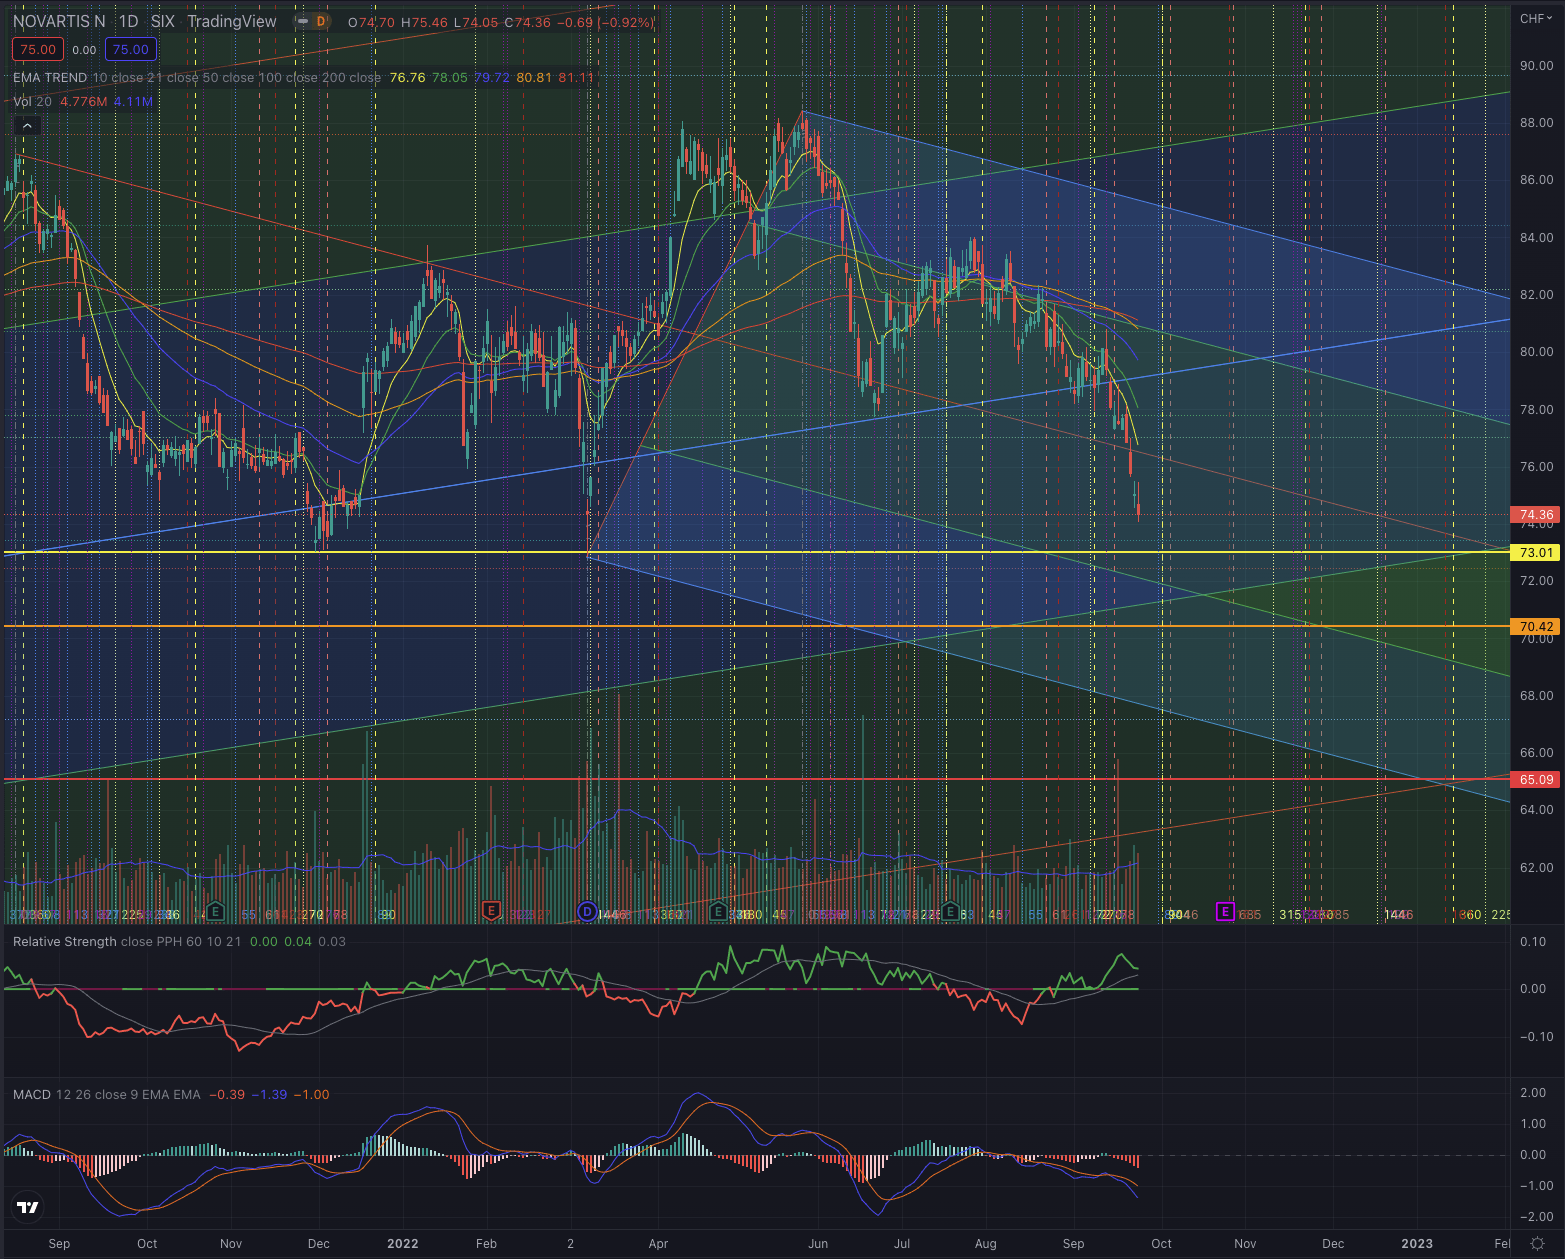
My calculations based on Fibonacci’s theory, suggest the most likely price target is around CHF 73.80 or $75.20 before possibly hitting the mentioned support level. If the support should hold, the stock could attempt a rebound until CHF 76-77.80 (or approximately $77-79) and even higher until its EMA50, which is still significantly higher, as the stock seems quite negatively extended and not much overhead resistance is seen in the short term.
Investors should observe the price action and how the stock behaves at the next support and resistance levels, and how an eventual attempt to break its next support is confirmed or rejected, by particularly observing the trading volume in both directions and the relative strength. As the consistent breakout over the EMA50 seems hard in the short term, I would put particular attention on this price level, as it could serve as a trailing resistance.
The bottom line
Technical analysis is not an absolute instrument, but a way to increase investors’ success probabilities and a tool allowing them to be oriented in whatever security. One would not drive towards an unknown destination without consulting a map or using a GPS. I believe the same should be true when making investment decisions. I consider techniques based on the Elliott Wave Theory, as well as likely outcomes based on Fibonacci’s principles, by confirming the likelihood of an outcome contingent on time-based probabilities. The purpose of my technical analysis is to confirm or reject an entry point in the stock, by observing its sector and industry, and most of all its price action. I then analyze the situation of that stock and calculate likely outcomes based on the mentioned theories.
Novartis’ stock is likely set for some higher volatility, as the stock attempts to establish a bottom, which could be reached as soon as at the next support. The stock’s recent negative trend could lead the stock to suffer more pain in the short term before consistently breaking out over its overhead resistance. The Swiss-pharma giant is still considerably undervalued when considering its fundamentals, offers a high dividend yield, which is valued by an A Grade, and is historically rather a defensive stock.
From a technical perspective, the stock is not in a buy position as it is in a downtrend and close to an important support level. I, therefore, change my rating based on purely technical aspects and from a near-term perspective. Investors should be prepared for ongoing higher volatility for the stock, by considering the risk of falling toward new lows, as the relevant industry and the macroeconomics driving the general sentiment are still quite exposed to unfavorable market conditions.
Be the first to comment