

PTW
We’re nearing the end of the Q2 Earnings Season for the Gold Miners Index (GDX), and the results have been mixed, with those producers with Western Australian operations being hit especially hard. This is due to a very tight labor market with rising COVID-19 cases and inflationary pressures on fuel, reagents, and other consumables (steel). Northern Star (OTCPK:NESRF) wasn’t immune from these inflationary pressures, seeing all-in sustaining costs [AISC] rise to A$1,650/oz, the second-highest unit cost figure in years. However, while it’s easy to be negative about the slight miss in FY2022 vs. guidance mid-points, investors should focus on the company’s future, which is a low-cost, Tier-1 jurisdiction producer with increasing capital returns.
Unless otherwise noted, all figures are in Australian Dollars ($A), and all exchange rates are based on $0.71 AUD/USD. Northern Star trades significant volume daily on the Australian Stock Exchange (NST.ASX) but trades very limited volume on the OTC Market. Therefore, the best way to trade the stock is on the Australian Stock Exchange. There is a significant risk to buying on the OTC due to wide bid/ask spreads, low liquidity, and no guarantee of future liquidity.
KCGM Operations (Company Website)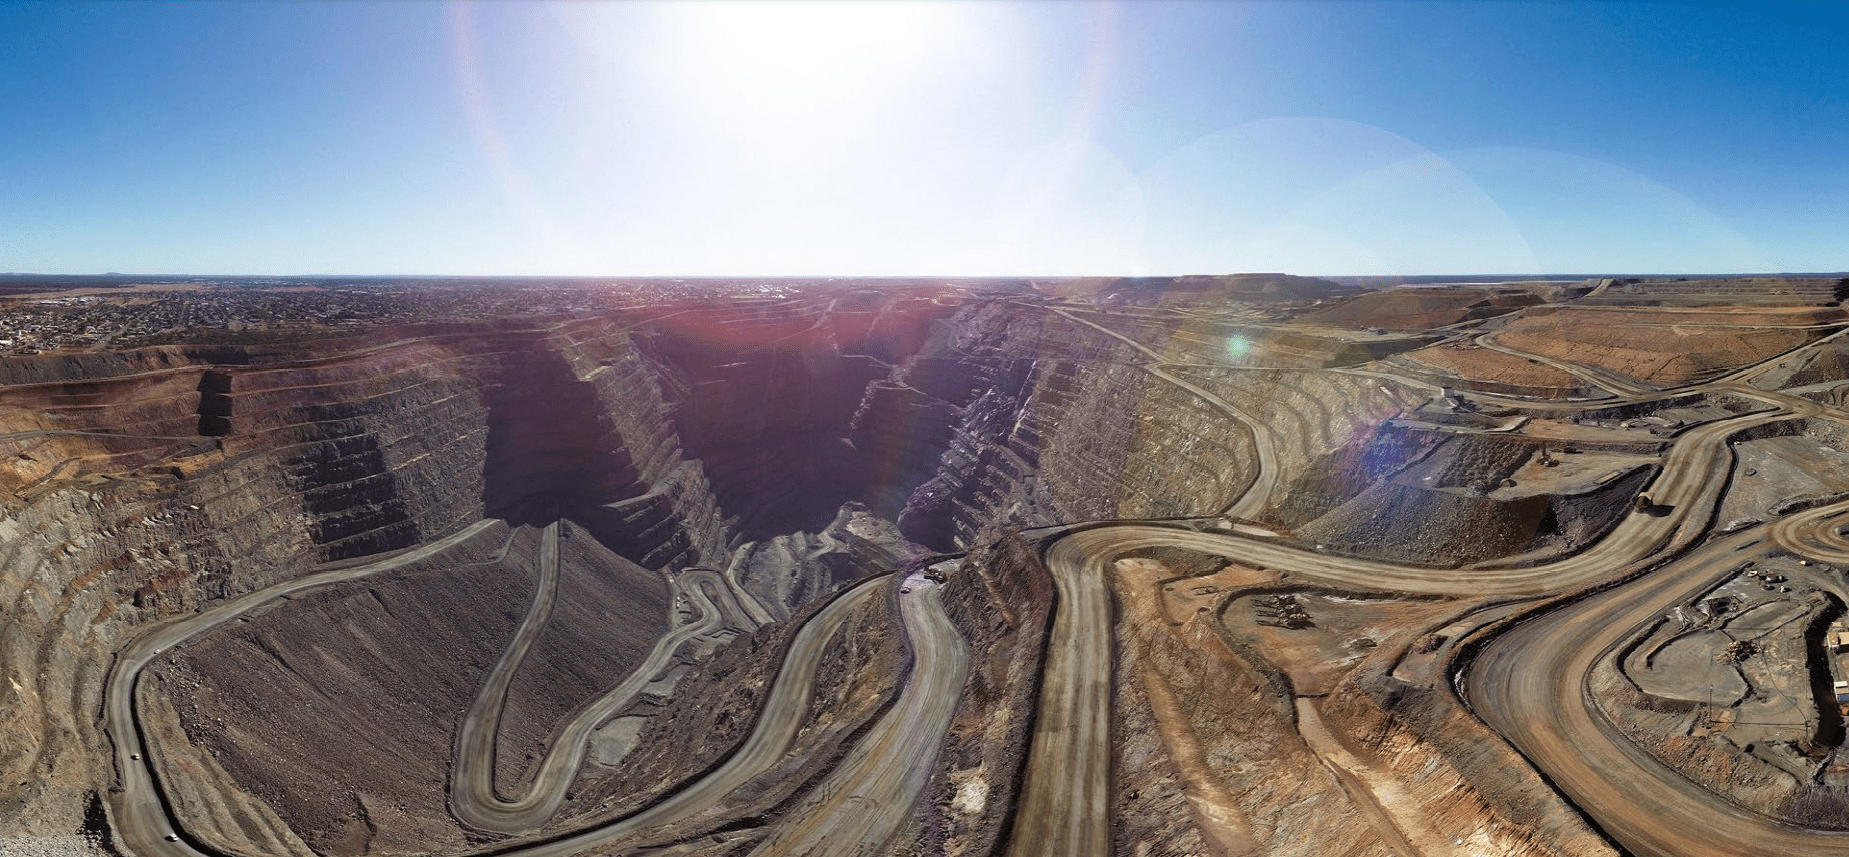
Q4 Production
Northern Star released its fiscal Q4 2022 (calendar year Q4) production results last month, reporting quarterly production of ~410,800 ounces and gold sales of ~402,000 ounces. This translated to an 11% decline from the year-ago period (~450,000 ounces), with lower production year-over-year at KCGM, Kalgoorlie, and Carosue Dam. It is worth noting that KCGM was up against very difficult year-over-year comps in the period, so the decline here isn’t all that surprising. That said, its Kalgoorlie Operations disappointed, with a larger than expected mill downtime event leading to a significant decline in throughput in the period, exacerbated by lower grades processed.
Northern Star – Quarterly Production by Mine (Company Filings, Author’s Chart)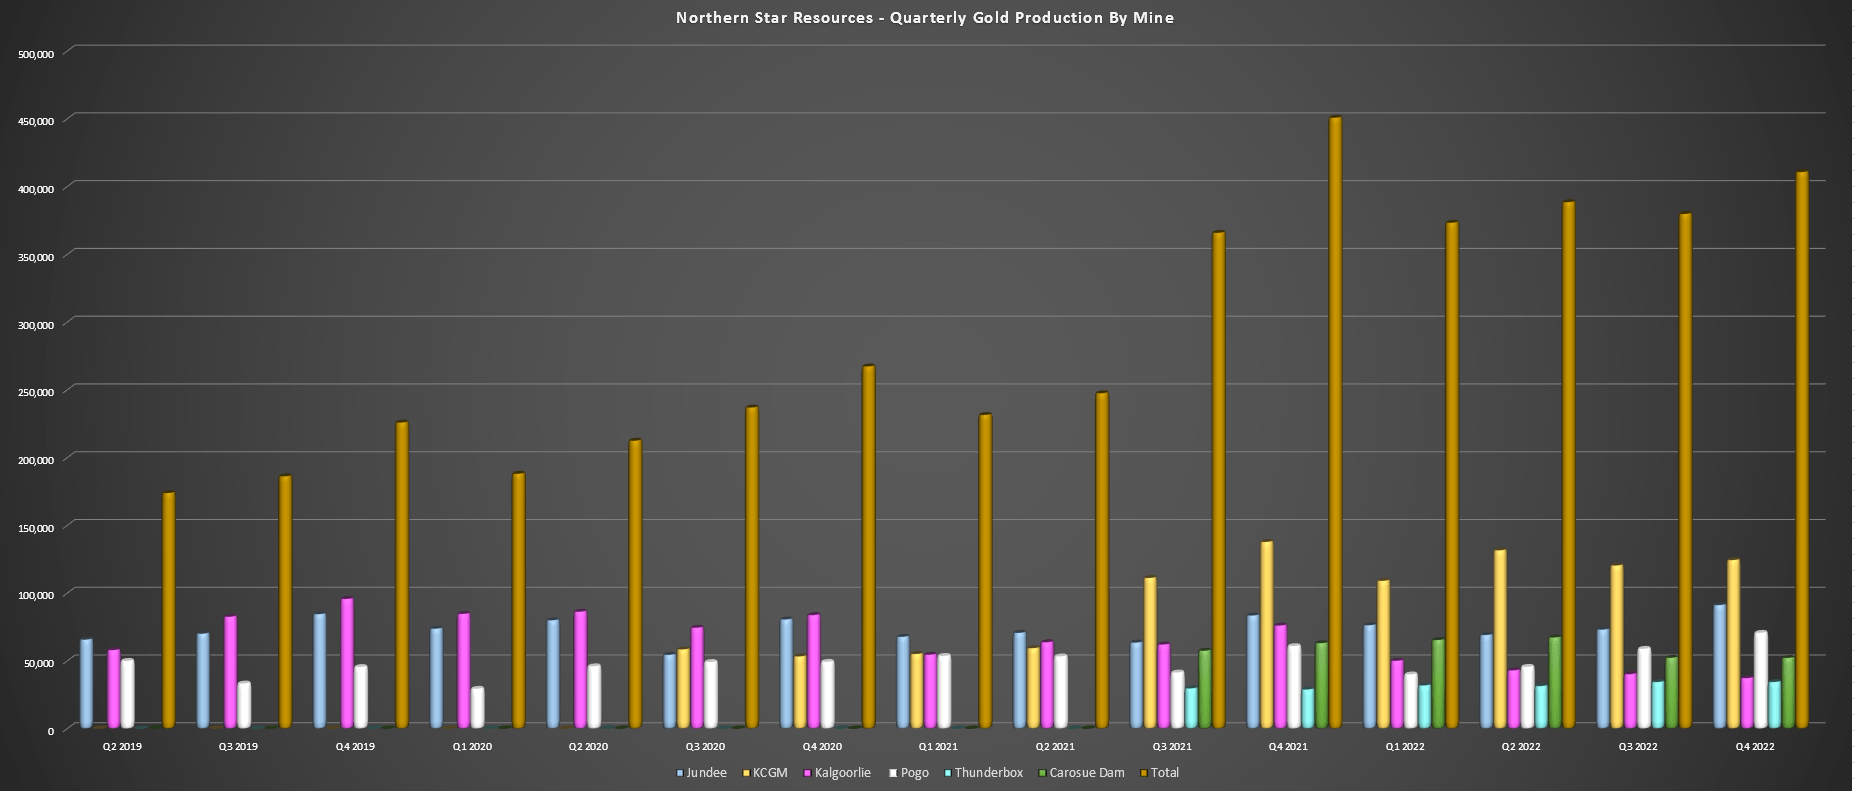
Fortunately, while its Kalgoorlie Operations had a tougher quarter (~213,300 ounces sold vs. ~272,900 ounces sold), its Yandal Operations had a better quarter, and Pogo finally looks to be on track, the runt of the portfolio for years. At Yandal, Thunderbox had a better quarter with ~34,500 ounces produced. Meanwhile, Jundee also had a robust quarter, producing 91,300 ounces, helped by higher grades from Lyons South and Moneyline offset lower tonnes milled due to a secondary crusher component failure. However, the quarter’s shining star was Pogo, a first.
Pogo Operations (Company Filings, Author’s Chart)
As the chart above shows, production at its Alaskan Pogo Mine soared to ~70,800 ounces, a new multi-year high, helped by a significant increase in ore tonnes mined (~320,300) and higher mill throughput with the mill expansion complete. This translated to a 17% increase in sold ounces (~67,200 vs. ~57,500 ounces in Q4 2021), and the asset generated net mine cash flow of A$10 million in the period. The company expects that improvements to underground infrastructure (pumping, two underground ore store stockpiles) will provide the ability to sustain the 1.3 million tonnes per annum nameplate capacity.
Given the massive improvement in operating performance, all-in sustaining costs plummeted to US$1,184/oz, down from $1,347/oz in the year-ago period. The company is still working towards its long-term goal of 300,000 ounces at this asset, underpinned by successful resource growth with a maiden resource of 1.1 million ounces at 10.3 grams per tonne gold delineated at Goodpaster. In addition, costs should continue to improve as it reduces manpower slightly to optimize the operation further. As it stands, FY2023 production is estimated at 275,000 ounces at US$1,350/oz at the mid-point, a very respectable profile for an asset that’s been a drag on Northern Star’s costs in the past.
Finally, while KCGM might have seen lower production due to being up against tough comparisons, it was still a very solid quarter and year, with ~66 million tonnes moved, on track for its goal of 80 to 100 million tonnes. Notably, the open-pit fleet replacement was completed in the quarter, with 39 793-F trucks and 2 PC-800-C excavators deployed. These drive productivity at this massive operation, which Northern Star hopes it can push to 650,000 ounces per annum in FY2026, up from the ~483,000 ounces produced in FY2022.
Costs & Margins
Looking at costs and margins, Northern Star’s costs were up sharply in the period, increasing from A$1,459/oz to A$1,650/oz [US$1,172/oz] despite the meaningful increase in costs at Pogo. This was related to higher labor, steel, and diesel costs, with costs up A$70/oz from diesel alone and steel prices up, impacting ground support costs and grinding media. The labor piece seems to be exacerbated by rising COVID-19 cases, which have since moderated, and the tight labor market driving up the cost of contracted services in resource-rich regions (Ontario, Western Australia).
Northern Star – Operating Costs & Gold Price (Company Filings, Author’s Chart)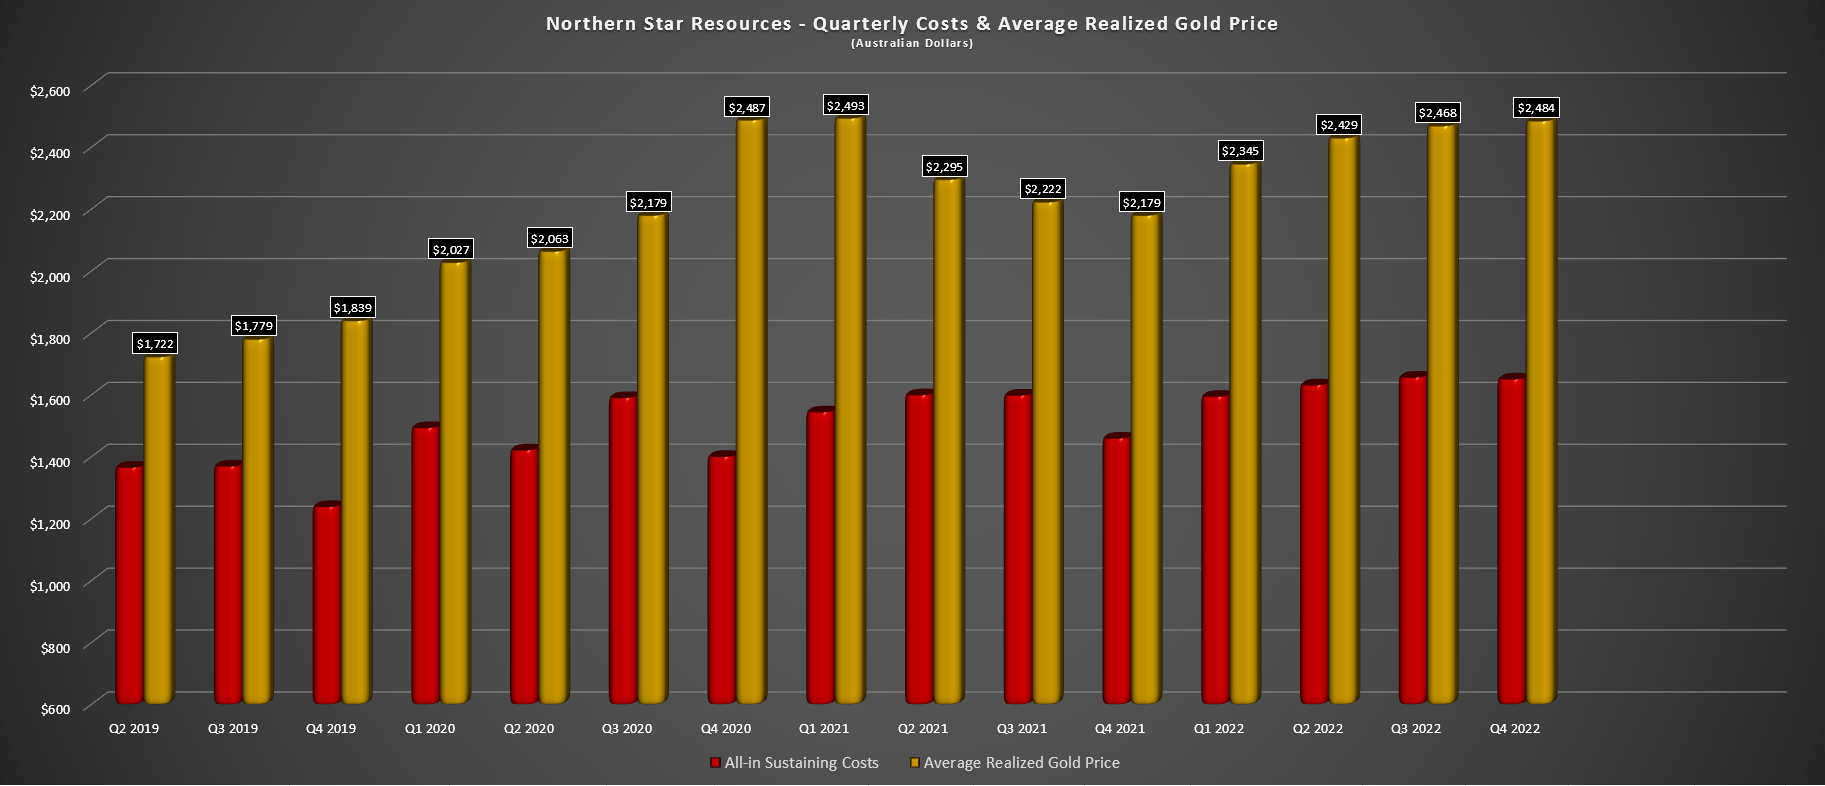
Fortunately, the higher gold price offset costs in the period, with fewer ounces delivered into hedges (~174,000 vs. ~217,000). This led to AISC margins of A$834/oz vs. A$720/oz in the year-ago period. Northern Star also added 210,000 ounces of hedges at an average price of A$2,893/oz [US$2,054/oz], giving it security against lower prices during its growth phase as it ramps up material movement at KCGM and completes its Thunderbox Expansion. So, while higher costs led to meaningful margin compression for most miners, Northern Star was able to see an improvement in margins despite the rising costs.
Crude Oil Bullish Sentiment (Daily Sentiment Index Data, Author’s Chart)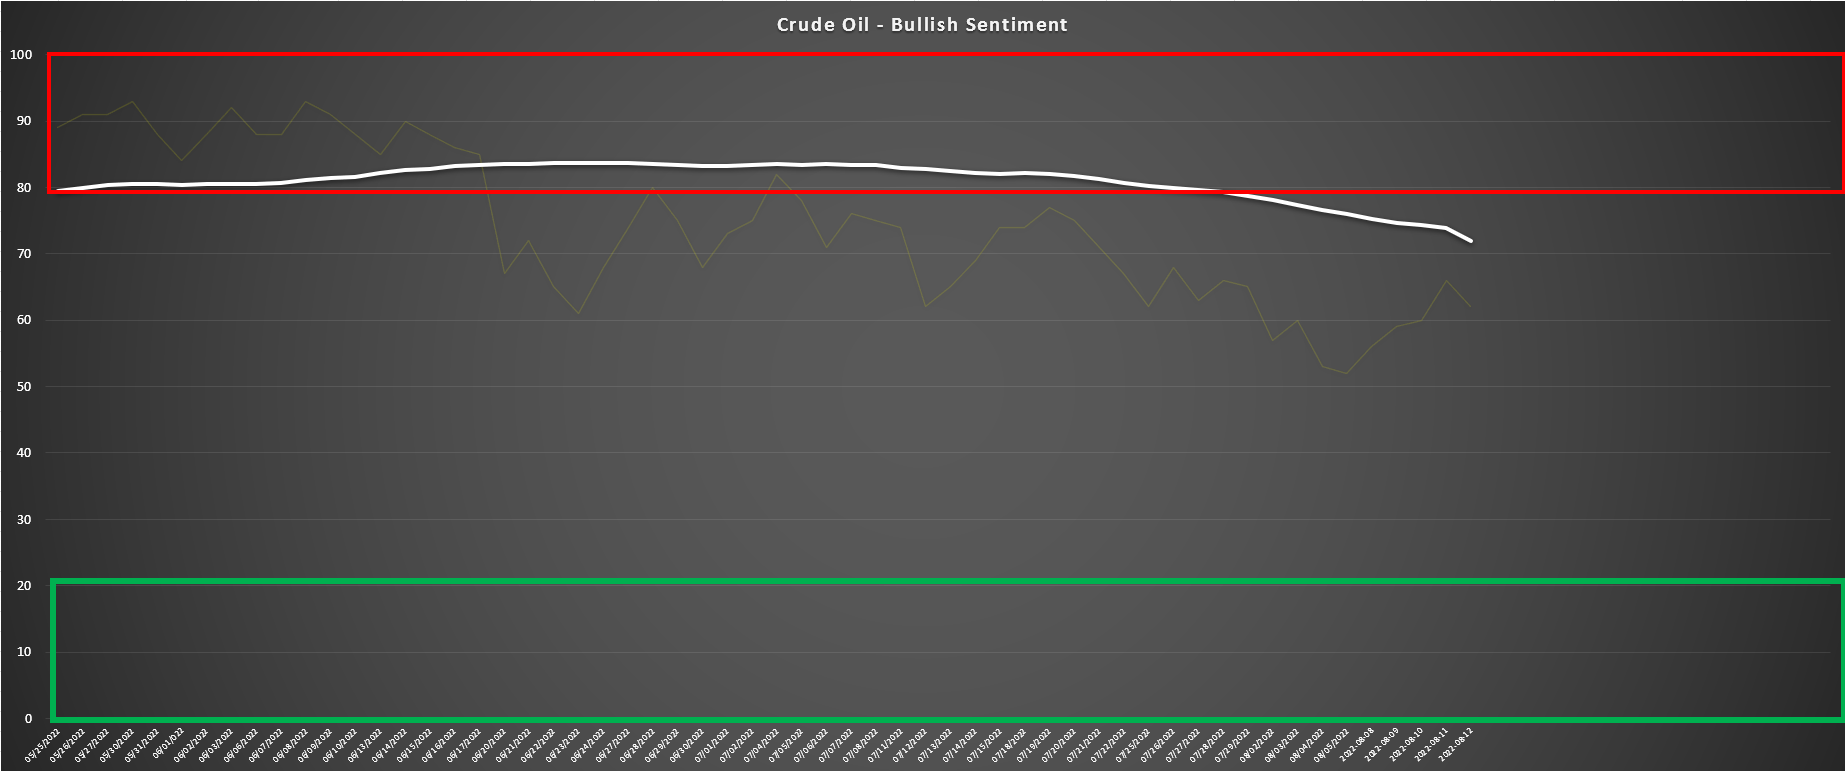
Assuming oil prices remain below $100.00/barrel, it’s possible we’ve seen peak inflation for miners, which would be great news for producers and provide a tailwind in an area where they’ve been hit especially hard (fuel prices). The view that oil likely peaked near $125.00/barrel is supported by sentiment for oil. The above chart shows that crude oil sentiment hit its highest levels in years in Q2, with long-term sentiment soaring to 85% bulls (meaning there were more than six bulls for every one bear among market participants). When we’ve seen this for commodities, it’s often led to a sharp pullback but also limited upside price progress, with the last similar signal being for gold in August 2020, with the gold price struggling to get back above the $2,050/oz level.
FY2023 Guidance & Long-Term Outlook
While production came in a little lighter than expected in FY2022 (below guidance mid-point), cost performance was solid given the challenging environment, which included a A$70/oz headwind from diesel prices. Looking ahead to FY2023, costs are expected to increase to A$1,660/oz [US$1,179/oz] at the mid-point, which will be slightly above its peer group, but below the industry average. However, gold sales are also guided to increase, despite placing the Jubilee mill on care & maintenance to optimize cash flow. As it stands, Northern Star should deliver gold sales of ~1.62 million ounces in its 2023 fiscal year, a 4% improvement from 2022 levels.
Northern Star – Long-Term Production (Company Presentation)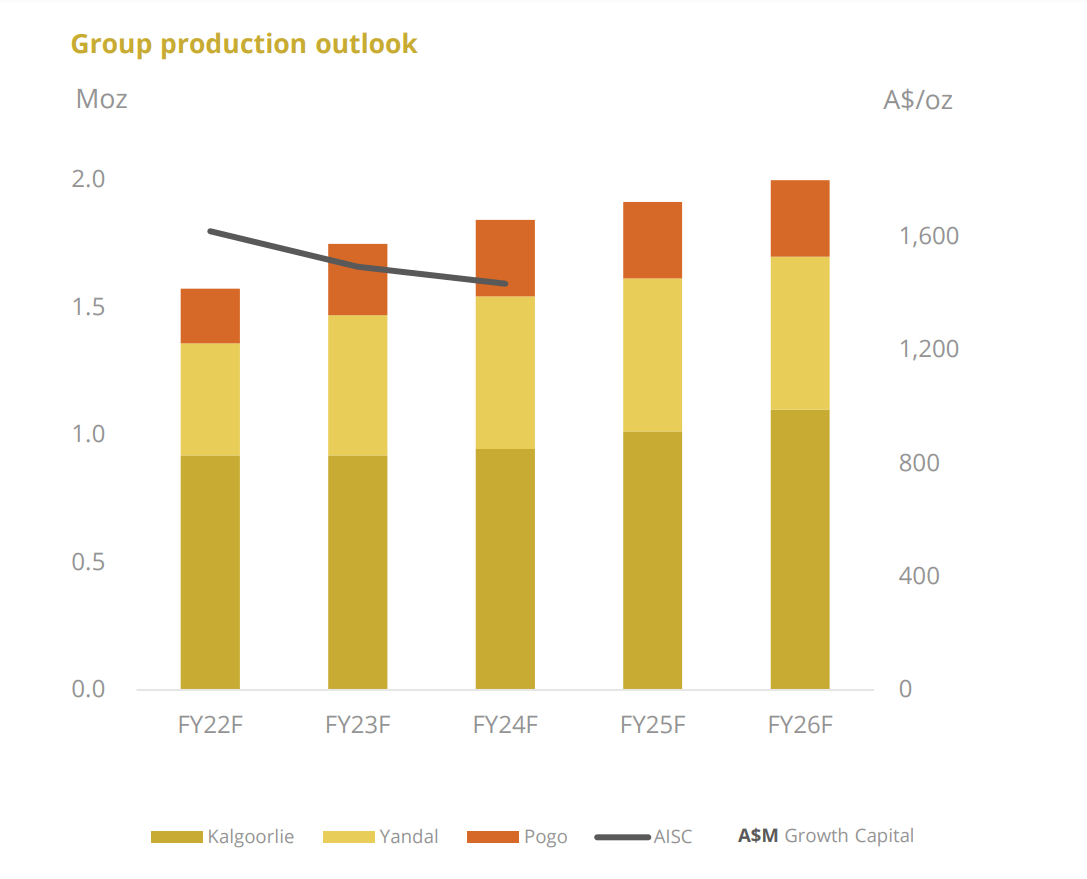
The above chart is dated for cost estimates, and 2024 guidance was withdrawn due to inflationary pressures, which might worry investors. However, given how unpredictable the current environment is, this decision makes sense. Fortunately, the company is still confident it can grow annual production to 2.0 million ounces by FY2026, translating to a ~6.5% compound annual growth rate, well above its peer group. Meanwhile, costs should improve as Pogo approaches 300,000 ounces per annum and KCGM ramps up to 650,000 ounces per annum by FY2026 with a higher underground contribution. Finally, Yandal’s costs should improve with increased throughput at the Thunderbox Mill and regional processing cost savings.
Hence, even if some inflationary pressures are sticky, and even if the FY2023 cost outlook leaves much to be desired, there looks to be a path to 2.0 million ounces at A$1,500/oz costs by FY2026. This is primarily due to the benefits of a significantly improved strip ratio at KCGM and much higher underground grades displacing lower grade stockpiles at the mill. (Mt. Charlotte, Fimiston North). At this cost profile and a similar exchange rate (0.70 AUD/USD), Northern Star’s costs would dip well below the industry average (~$1,050/oz vs. $1,310/oz estimates) and in line with or better than most of the lower-cost producers in its peer group (1.0+ million ounce miners).
Industry Average – Cash Costs, AISC, AISC Margins (Company Filings, Author’s Estimates, $1,800/oz Gold Price Assumption (FY2022-FY2025))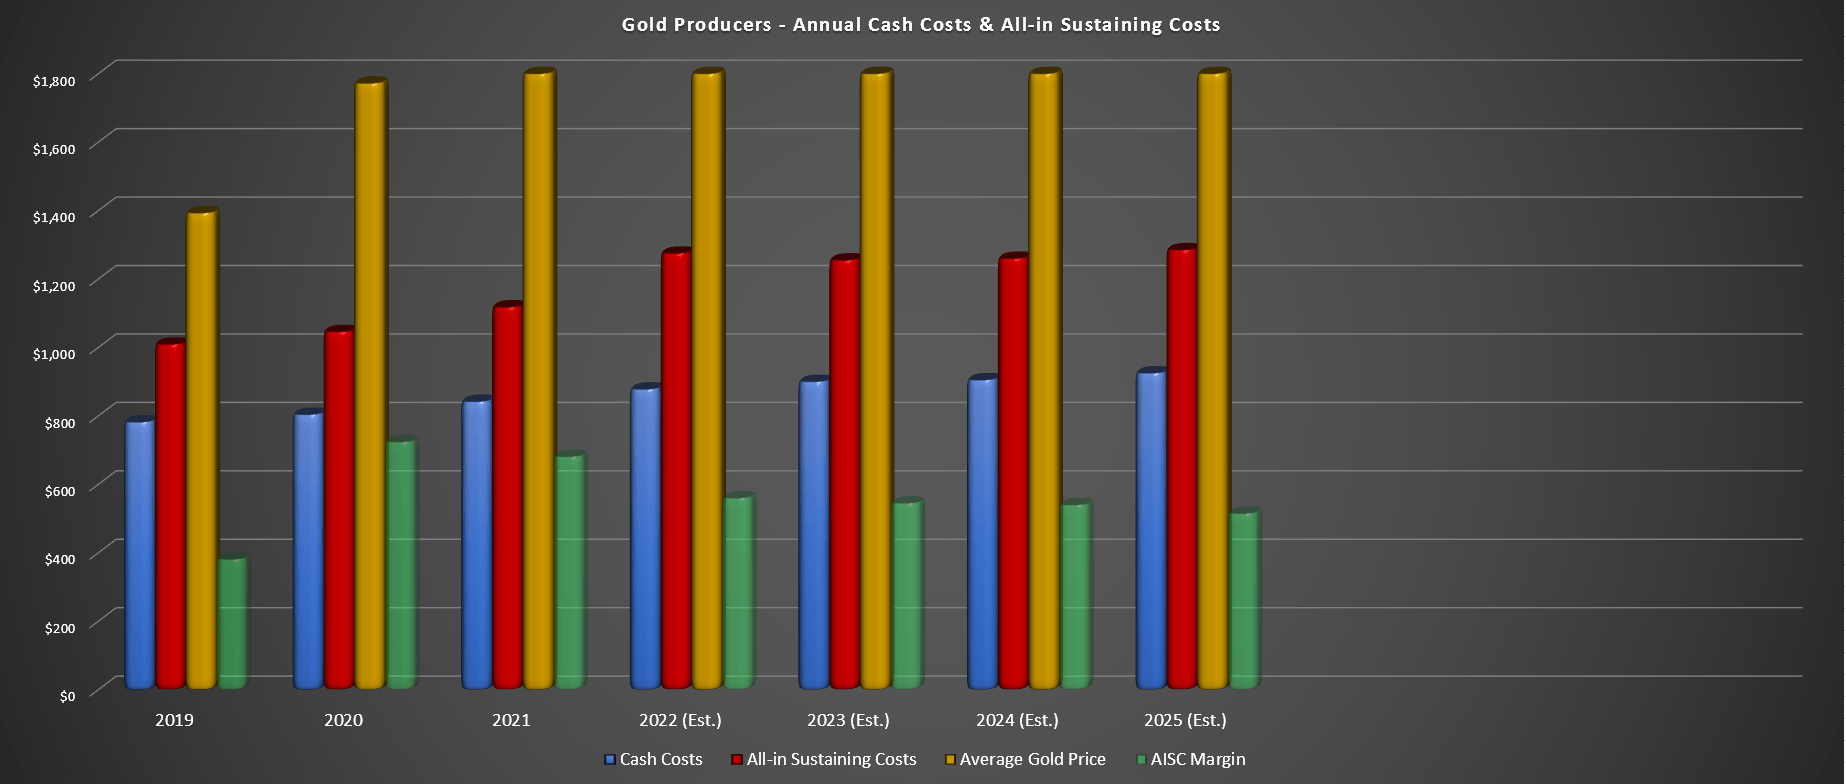
To summarize, while it’s easy to be negative about the increasing costs since FY2019, this isn’t a company-specific issue. Still, Northern Star’s growth plan and impressive reserve base should allow the company to claw back lost margins better vs. industry-average margins, which continue to decline. For this reason, I believe it’s best to judge Northern Star on its FY2025/FY2026 outlook, which looks achievable, instead of getting hung up on another high-cost year in FY2023. Let’s take a look at the valuation below:
Valuation & Technical Picture
Based on ~1,165 million shares outstanding and a share price of US$5.70, Northern Star trades at a market cap of US$6.64 billion and an enterprise value of US$6.27 billion. This is a dirt-cheap valuation for a solely Tier-1 jurisdiction producer (Alaska, Western Australia) that has an attractive organic growth profile and owns one of the most impressive mines globally (KCGM). If we compare this market cap to an estimated net asset value of ~$6.9 billion, Northern Star trades at a rare discount to net asset value, and I believe it could easily trade at 1.50x P/NAV given its differentiated business model (low jurisdictional risk, organic growth). Hence, I see the stock as significantly undervalued, with a fair value closer to US$8.90 per share.
NESRF Daily Chart (TC2000.com)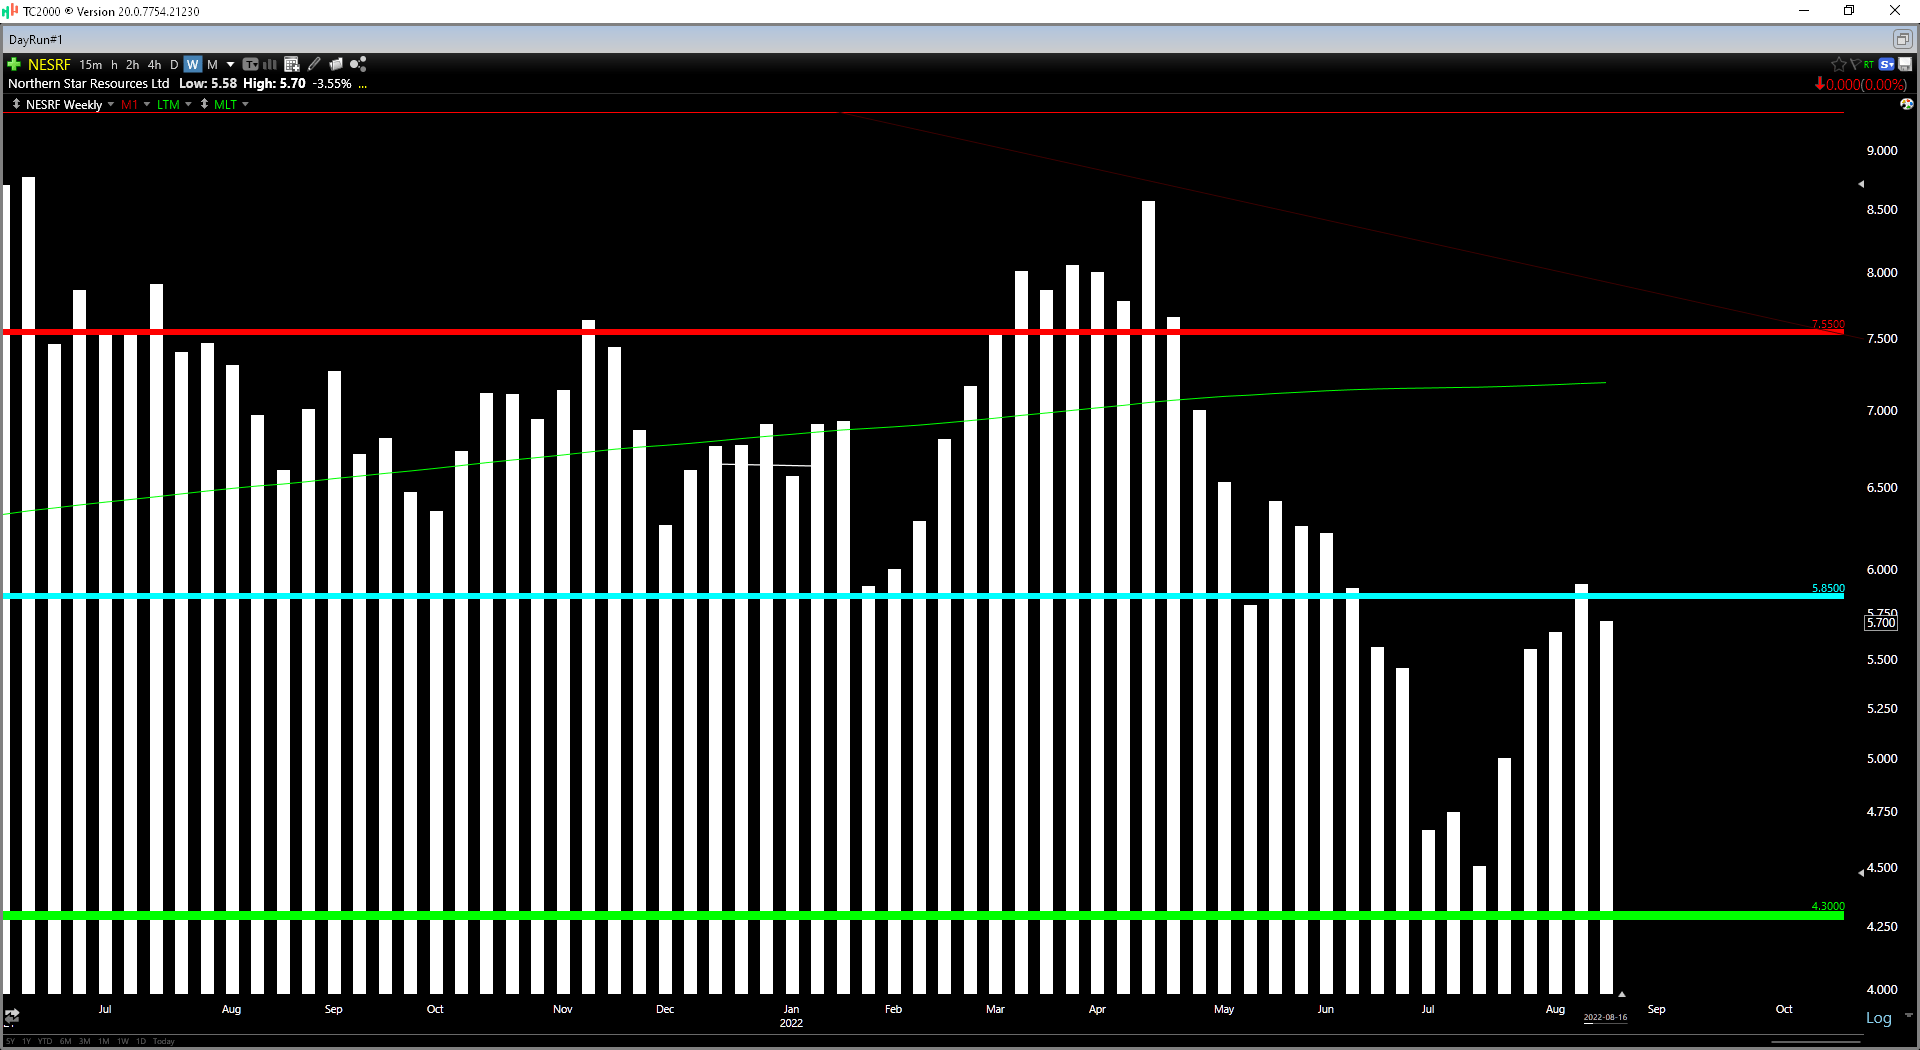
Unfortunately, despite its undervaluation, the stock remains under pressure and broke below a major support level at US$5.85 – US$6.00. This was related to the sharp leg down we saw in Australian gold producers after Evolution Mining’s (OTCPK:CAHPF) warned on costs and revised cost estimates higher for FY2023/FY2024 due to inflationary pressures and lower production at Red Lake. However, Northern Star has since put together a strong rally from this breakout and looks like it’s trying to reclaim this previous support level (US$5.85), which would be a bullish development.
Given the much sharper correction than I anticipated, which has adjusted the stock’s expected trading range, the updated low-risk buy zone comes in at A$7.50 [US$5.35] from A$8.45 [US$6.00] previously. That said, for patient investors willing to wait for this growth to be realized, I remain bullish on the stock even from current levels at A$8.05 [US$5.70], with Northern Star trading at a massive discount to fair value. Assuming the gold price can cooperate, and the company can deliver a strong year in FY2023 (July 2022 to July 2023), I would not be surprised to see the stock trade above A$10.70 [US$7.60] per share by Q4 2023.
Northern Star Operations (Company Presentation)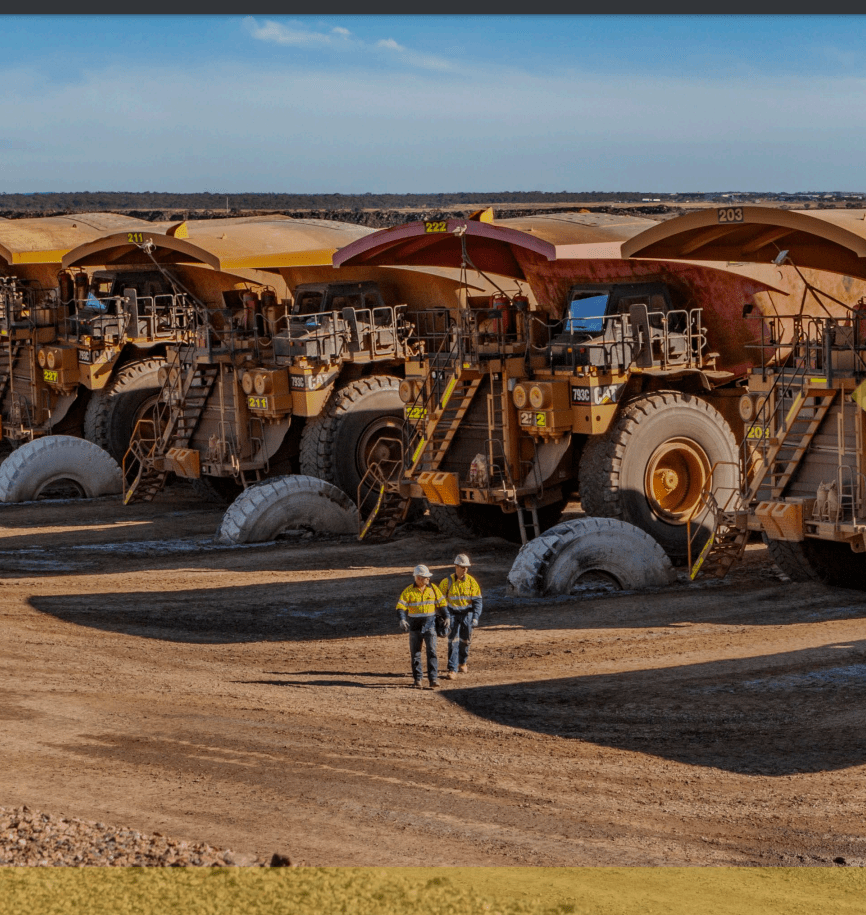
Northern Star is one of the highest-quality producers sector-wide and is one of the few sleep-well-at-night producers. This is because it’s established a foothold in the most attractive mining jurisdictions globally. Meanwhile, the company has one of the stronger balance sheets sector-wide, set to end CY-2023 with over A$650 million in cash. This allows the company to weather any storm in the gold price while continuing to return capital to shareholders. It could also allow the company to explore an acquisition in a period where juniors have been decimated, trading at their lowest valuations since March 2020.
Northern Star – Cumulative Dividends (Company Presentation)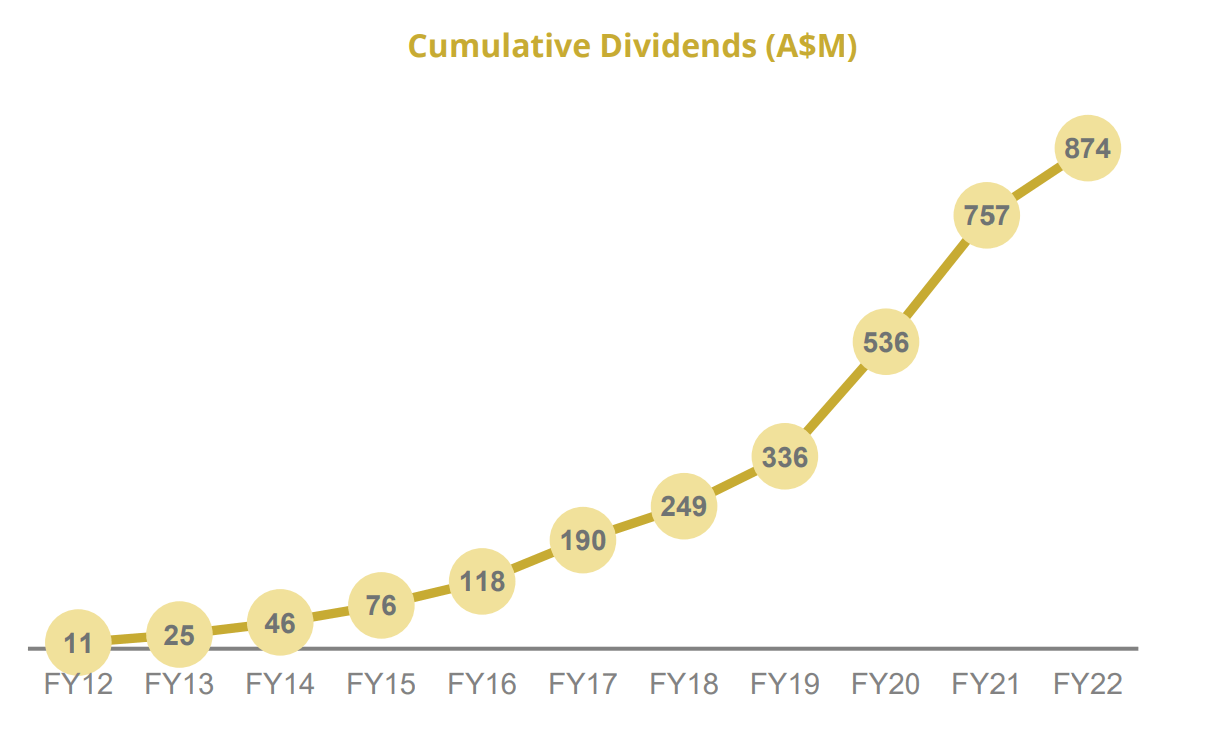
I believe this would strengthen the Northern Star investment thesis, potentially putting 2.2+ million ounces of production on the table by FY2028 once the current expansion (FY2026: 2.0 million ounces) is complete. That said, even without an acquisition, the real reason for owning Northern Star is that it offers meaningful growth at improving costs at a valuation reserved for an industry laggard or a producer in an unattractive jurisdiction. Hence, I see this weakness in the stock as a rare buying opportunity, and I would be shocked if the stock stayed at these levels for much longer.
Be the first to comment