

Lemon_tm/iStock via Getty Images
The coveted Dividend Kings list includes some of the most impressive companies that have stood the test of time.
Even though the list is short (especially when compared to the thousands of stocks that are available to purchase), there are still a number of companies on the list that don’t receive a lot of traction with investors. There might be a number of reasons why certain Dividend Kings are more popular than others and I have a few theories about what is driving popularity. The bullet point list below is not intended to be exhaustive but covers the reason that I consider to be the most prevalent.
- Low Dividend Yield – As share prices have fallen the dividend yield has increased with the average of all 45 Dividend Kings coming in at just over 2.8%. Of the 45 stocks on this list, 16 of them have a dividend yield under 2% and it is not uncommon that a dividend investor will search for a higher yield especially if they are reliant on the dividend income to supplement their retirement.
- Smaller Market Capitalization – The average market cap for the 16 companies under a 2% yield is roughly $21 billion. The 29 companies that have a 2% yield or greater carry an average market cap of $76 billion. this results in a market cap that is roughly 3.5x greater for Dividend Kings that carry higher yields.
- High Growth Dividend Kings – There are a handful of Dividend Kings that have found a second wind and begun to experience significant growth (both organically and through acquisitions). A great example from the Taxable Account article for John and Jane is Dover (DOV). DOV currently offers a dividend yield of 1.7% and its average three-year dividend growth rate is 1.28% even though the payout ratio is just under 26%. DOV is an example of a company where management has done an excellent job of expanding product lines while focusing on segments that carry high margins. At this point, DOV has decided to focus on allocating its capital towards acquisitions and increasing its share buyback capabilities by offering higher dividends to shareholders.
During the research in my last article, I was reminded of the phenomenal performance offered by Nordson (NASDAQ:NDSN) as it recently logged its 59th consecutive year of dividend increases with a whopping 27.5% increase.
The goal of this article is to draw comparisons between NDSN and other industrial Dividend Kings using a variety of metrics. I believe that these metrics will help explain why I see NDSN as one of the best Dividend King stocks available.
Comparison Companies
The following companies will be used to compare metrics and performance. The companies that are being used are part of the industrial sector but are not necessarily direct competitors of NDSN.
- Grainger (GWW)
- Dover
- Tennant (TNC)
- Parker-Hannifin (PH)
- Illinois Tool Works (ITW)
- Stanley Black & Decker (SWK)
- 3M (MMM)
The dividend yield associated with the companies listed above ranges between 1.3% to 5.2% so the goal is to give enough additional data points to show what kind of qualities are associated with lower dividend yields vs higher dividend yields.
Revenue
Revenue growth is a metric I am always concerned about when it comes to Dividend Kings because we want to make sure that the company isn’t stagnant.
It is important to remember that revenue by itself can be a misleading metric (this is true of most metrics and ratios when looked at on their own). From the image below we can begin exploring notable characteristics of the revenue growth but will avoid drawing conclusions based on assumptions (after all, I am sure you have heard the mantra about what making assumptions does, right?).
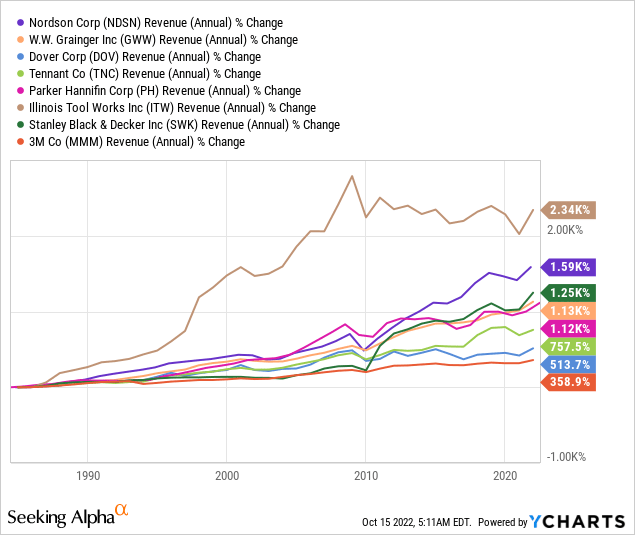
- ITW tops the list for long-term revenue growth (the chart above goes back as far as YCharts would allow) but revenue has remained rather flat or declined since 2010.
- NDSN has seen the second-fastest revenue growth of all the companies and leads third-place SWK by a wide margin.
- MMM is the highest-yielding Dividend King but has seen the least amount of revenue growth which suggests that the company is growing but very slowly. This is not uncommon behavior to see for a company as massive as MMM.
Net Income
Net income allows us to see how good a company is at converting its revenue into value for the shareholders and the company.
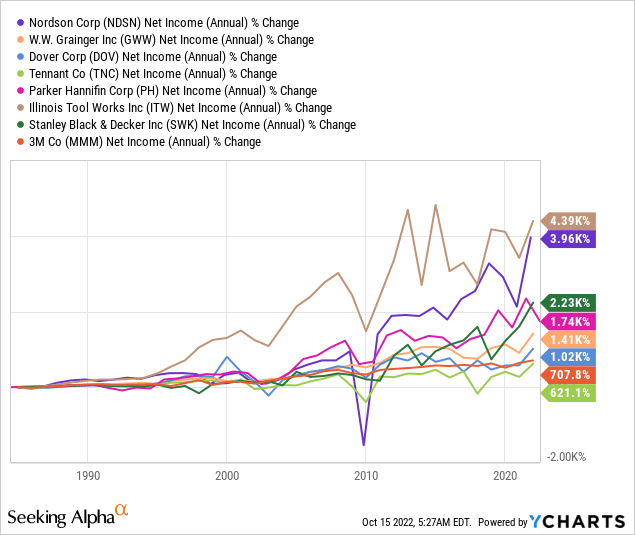
- ITW’s net income over the last decade has been relatively flat after its explosive growth in the 90s and 2000s.
- NDSN’s net income was negatively impacted during the financial crisis but has exploded after that now reaching comparable growth to where it is comparable with ITW.
- SWK comes in at third (I was surprised by this) because it is the 2nd highest-yielding company on the list at 4.2%.
Gross Profit Margin
Companies with a low gross profit margin are typically those who operate in an industry with low barriers to entry, low skill/expertise, and manufacture products that would be considered easy to replicate. Companies with a high gross profit margin are going to be those with a business model that is difficult to replicate, requires significant skill/expertise, and manufactures products that are difficult to replicate.
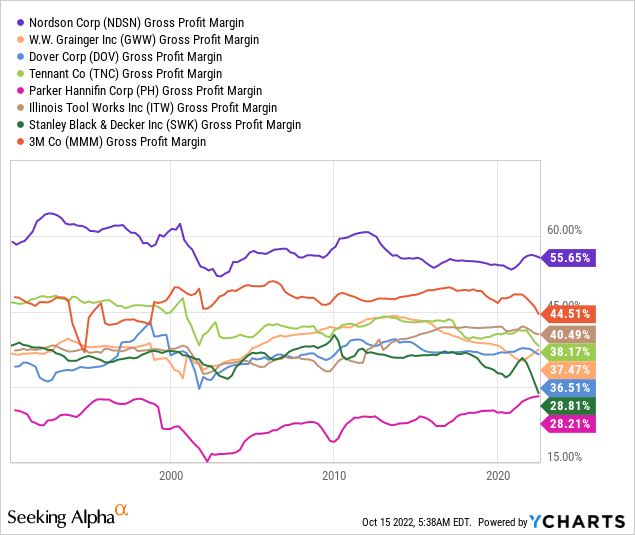
It is not uncommon to see a company divest/sell a division with a weak gross profit margin and then turn around and purchase another company or operation that helps them enhance existing operations in an effort to improve the gross profit margin.
- Of the companies reviewed, NDSN is operating at the top of its game with gross profit margin and has been doing so for decades.
- 3M has been able to operate at a high gross profit margin but its lack of net income growth and weak revenue growth indicates problems.
- SWK has shown recent improvement in net income and revenue but gross profit margin is trending negatively and is not a trend I would normally expect to see.
Dividend Growth
Looking at the total dividend growth will give us a better idea of how each company views its dividend payout strategy and the type of compounding growth that can be obtained from strong and regular dividend increases.
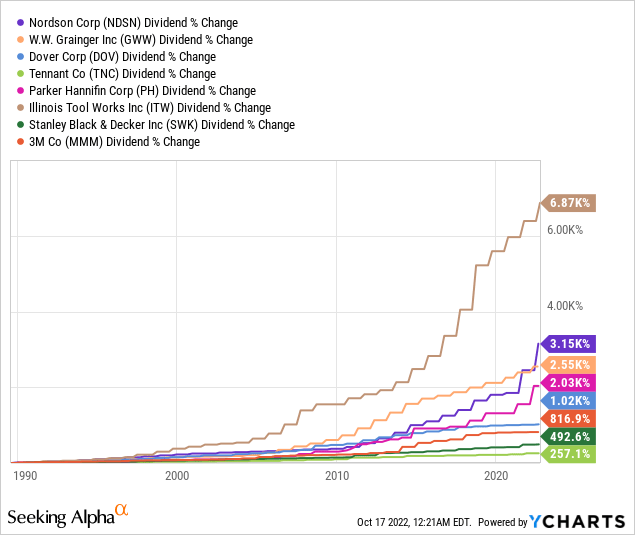
- ITW’s dividend growth since the 90s has been unparalleled and continues to grow at a modest pace today. The payout ratio is just under 60% so It is likely to moderate unless they can accelerate growth. Previous graphs show that total net income and revenue have stagnated over the last decade.
- NDSN has offered some large dividend increases that moved its dividend growth beyond GWW.
- PH’s dividend has grown considerably over the last several years which coincides with growing revenue, income, and gross profit margins. Similar to NDSN the payout ratio is around 25%.
- DOV and TNC have a less substantial dividend growth history than MMM, however, their payout ratios are less than half that of MMM’s current 60% payout ratio. DOV and TNC have positioned themselves as growth stocks that happen to pay a dividend and SWK is in the middle with a 4%+ yield and payout ratio of 36%.
Performance Of $10K Initial Investment
I don’t like to use this function too often because I don’t want to insinuate how easily someone could have invested $10K at a certain point in time and earned massive returns as a result. With that said, the value of the image below is that it gives us another verifiable way to better understand how a company is (or has been) performing.
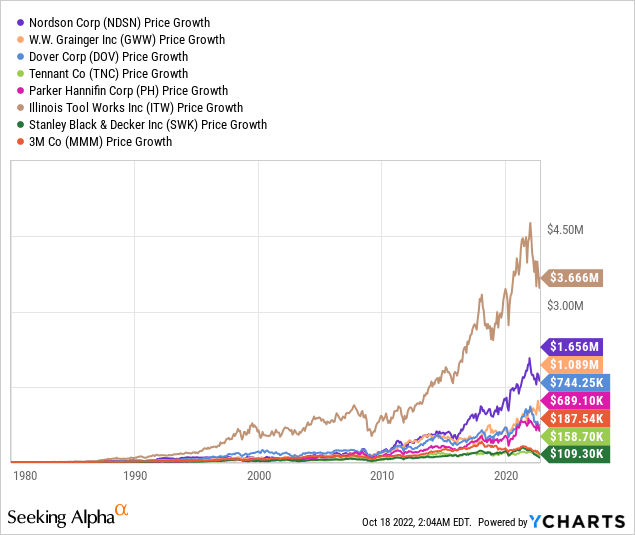
- ITW is once again at the top of the charge for price appreciation.
- NDSN stands out by having seen nearly $600,000 of additional appreciation over GWW.
- DOV and PH round out the next best investments.
- MMM, TNC, and SWK over the same timeframe were arguably the worst investments one could buy. This investment wasn’t necessarily bad either as SWK saw an 11-fold increase in share price over the last 42 years.
Recent Drop In Price
A drop in price may indicate a buying opportunity (depending on what caused the drop). The image below shows the kind of impact each stock has held in the current economic environment starting on January 1st, 2022. Stocks that have seen an unjustified drop in price are definitely worth additional consideration.
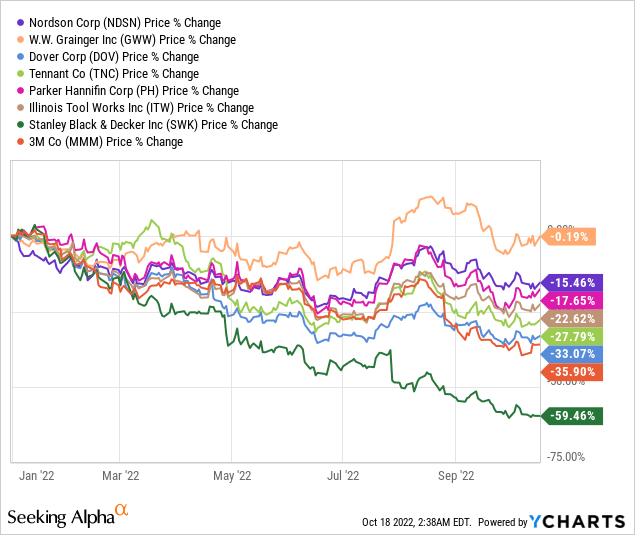
- GWW has demonstrated the most sustainability by ending October 18th with a share price that is nearly the same as when we started YTD.
- NDSN and PH have seen drops in price that are moderate.
- DOV and MMM have seen substantial drops in value with 1/3 of the price having been lost YTD.
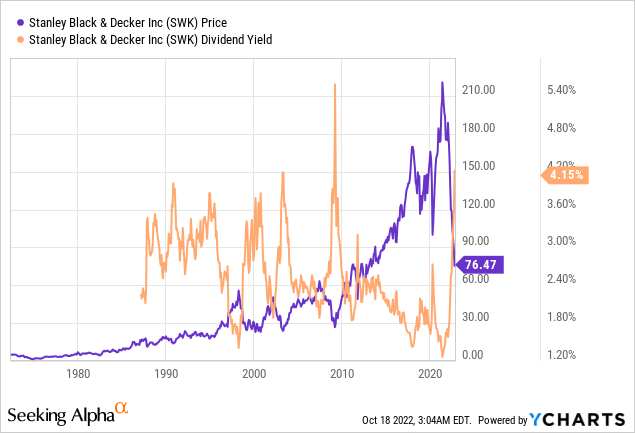
- SWK has experienced a loss of 60% YTD after a terrible earnings report and several companies downgrading the stock. The drop in price has caused SWK’s dividend yield to skyrocket (see image below).
Conclusion
There are definitely opportunities to buy significantly undervalued shares like SWK that are currently offering a yield that hasn’t been seen in over a decade. While there are individual reasons for buying the companies used in this article, I think the case is quite compelling for NDSN as it consistently produces the highest gross profit margins of all companies examined but also consistently comes in second place when compared with ITW.
From the metrics used, I believe that ITW’s growth rate will be difficult to replicate unless it is able to make a large acquisition (and expand to different product lines). There is a combination of factors that make me concerned about ITWs prospects moving forward. This includes:
- Stagnant revenue (over the last decade)
- Income has plateaued (over the last decade)
- Dividend payout ratio 60%
With these factors in mind, it is clear that NDSN looks to be more prepared for future growth and it has done a great job with its execution and a strong focus on driving shareholder returns.
It is important to remember that the figures provided are from my own research and it is critical for readers to put the time in to gather their own research and determine whether or not the stock meets their threshold for investing. I regularly track DOV, MMM, NDSN and PH, but the remaining stocks mentioned in this article have not been fully researched. SWK appears to be the most interesting candidate of the stocks that I do not regularly cover.
My Clients John and Jane are long DOV, MMM, NDSN and PH.
Be the first to comment