

Pgiam/iStock via Getty Images
Author’s note: This article was released to CEF/ETF Income Laboratory members on November 9th, 2022.
The ProShares S&P 500 Dividend Aristocrats ETF (BATS:NOBL) and the SPDR S&P Dividend ETF (NYSEARCA:SDY) are broadly similar funds. Both have similar investment strategies, focusing on Dividend Aristocrats – U.S. equities with outstanding dividend growth track-records, and have strong performance track-records. In my opinion, both funds are strong investment opportunities, and particularly appropriate for long-term dividend growth investors. On a more negative note, yields for both funds are quite low, with NOBL yielding 1.9% and SDY yielding 2.5%.
Although NOBL and SDY are broadly similar funds, there are a few key differences between them. NOBL focuses on the original, large-cap S&P 500 Dividend Aristocrats, while SDY is broader, investing in both mid-caps and small-caps. Smaller companies tend to trade with cheaper valuations, as does SDY. NOBL only invests in companies with at least 25 consecutive years of stable / growing dividends, while SDY is a bit laxer, using 20 consecutive years as a cutoff.
In my opinion, SDY’s broader portfolio and cheaper valuation make it a stronger investment relative to NOBL. Still, both funds are broadly similar investments, and buys.
Strategy and Holdings Comparison – SDY Slight Winner
NOBL – Large-Cap Dividend Aristocrats ETF
NOBL invests in the original S&P 500 Dividend Aristocrats: S&P 500 constituents with at least twenty-five consecutive years of dividend growth. It is an equal-weight index, but there are security and industry weight caps to ensure a modicum of diversification.
NOBL’s underlying index is quite narrow and strict, resulting in a somewhat concentrated fund, with a comparatively low number of holdings. NOBL invests in just 64 companies, while most broad-based equity index funds invest in hundreds of these, some in thousands. In my opinion, NOBL’s relatively low number of holdings is not a significant issue or negative, but is something to consider before initiating a massive or overweight position in the fund. NOBL lacks the diversification of an S&P 500 index fund or similar, so consider diversifying into other equity funds.
NOBL’s investments include most well-known, blue-chip, large-cap U.S. dividend equities, including Coca-Cola (KO), Johnson & Johnson (JNJ), and AbbVie (ABBV). These are all strong companies and investments, mainstays in most dividend portfolios and funds, and particularly appropriate for more risk-averse investors, in my opinion at least.
NOBL provides investors with exposure to all relevant industry segments. Relative to broader equity indexes, the fund is significantly underweight tech, a sector with low dividends and short dividend growth track-records. To compensate, the fund is overweight several old-economy industries, like finance and industrials, which have many companies with long, strong, track-records.
NOBL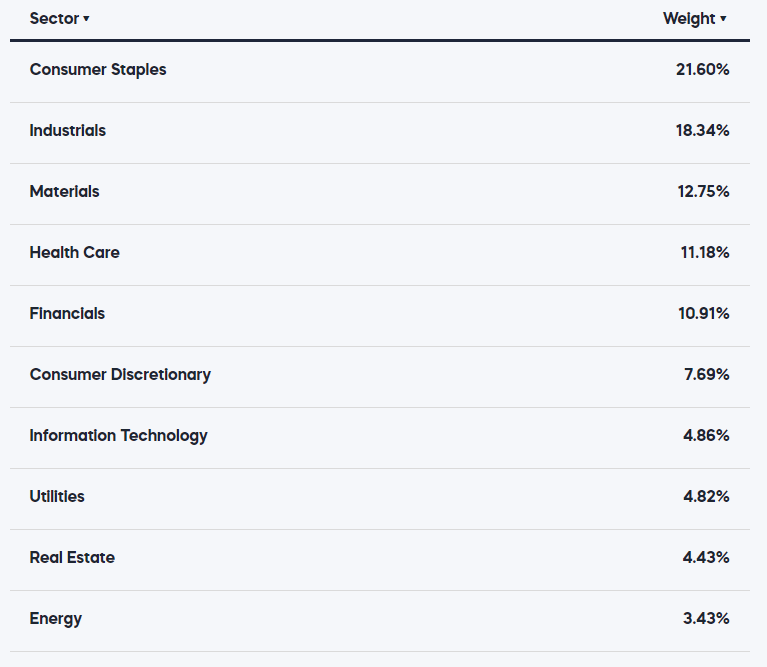
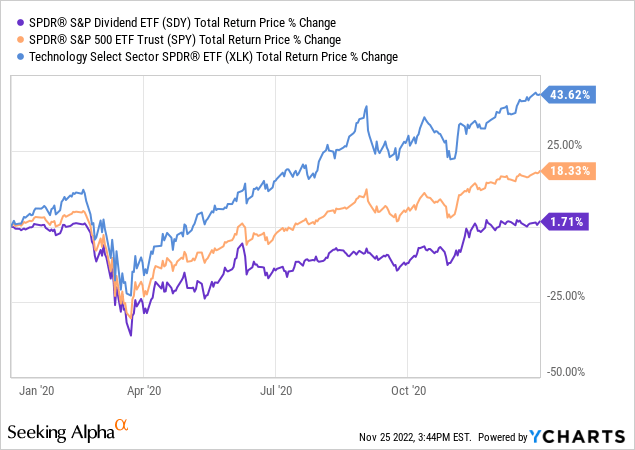
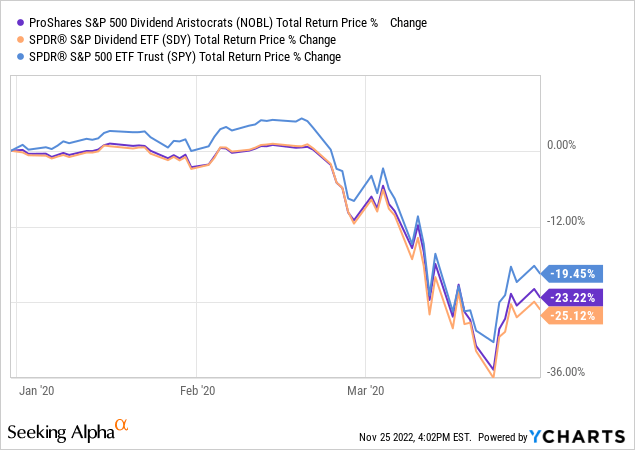
NOBL’s relative performance is somewhat dependent on the relative performance of these industries, especially tech. Expect the fund to underperform when tech outperforms, as was the case during 2020, the onset of the coronavirus pandemic.
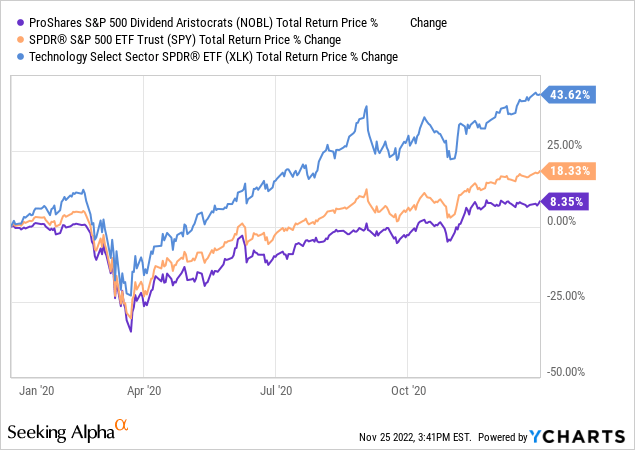
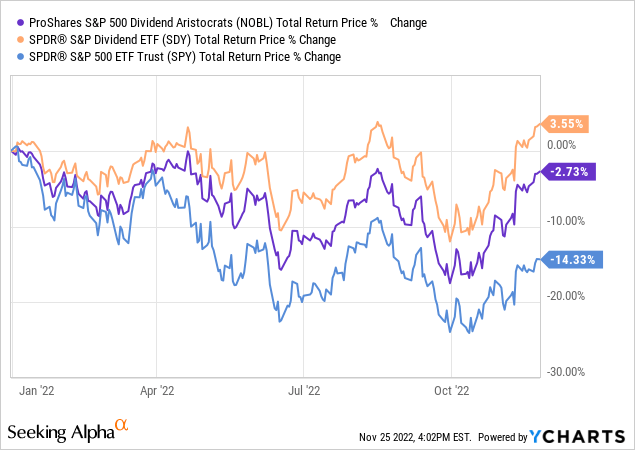
Expect the fund to outperform when tech underperforms, as has been the case YTD.
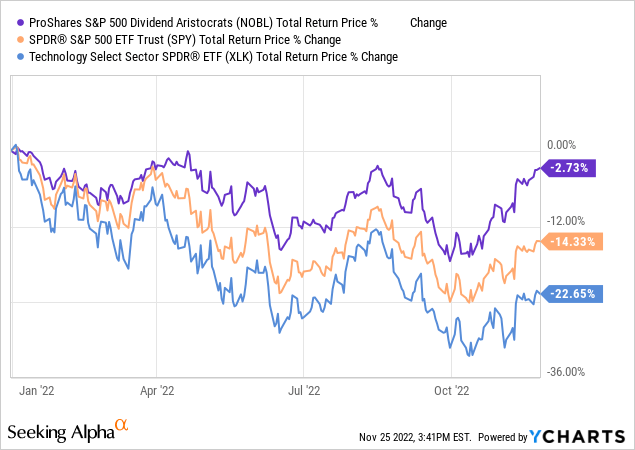
NOBL’s underweight tech position affects the fund’s performance, and is an important fact for investors to consider.
SDY – All-Cap Dividend Aristocrats ETF
SDY invests in a broader set of Dividend Aristocrats, investing in U.S. equities with at least 20 consecutive years of dividend growth, from all relevant industries and market-capitalizations. It is a yield-weighted index, with higher yields leading to higher weights, to a 4.0% cap.
SDY’s underlying index is broader than NOBL’s, due to investing in mid-caps and small-caps. As NOBL, SDY’s investments include most well-known, blue-chip, large-cap U.S. dividend equities, including Coca-Cola, Johnson & Johnson, and Abbvie. Unlike NOBL, SDY also invests in smaller, less well-known dividend equities, including United Bankshares (UBSI) and Fastenal (FAST). Due to this, SDY invests in more companies than NOBL, 119 versus 64.
SDY’s larger, more diversified portfolio is a benefit for the fund and its shareholders, and an advantage relative to NOBL. In my opinion, SDY’s more diversified portfolio is particularly important for investors choosing a core portfolio holding, which will be a large part of their portfolio. For smaller positions, concentration is less important, as sizing takes care of any issues with risk and the like.
As NOBL, SDY provides investors with exposure to all relevant industry segments, but is underweight tech, while being overweight old-economy industries.
SDY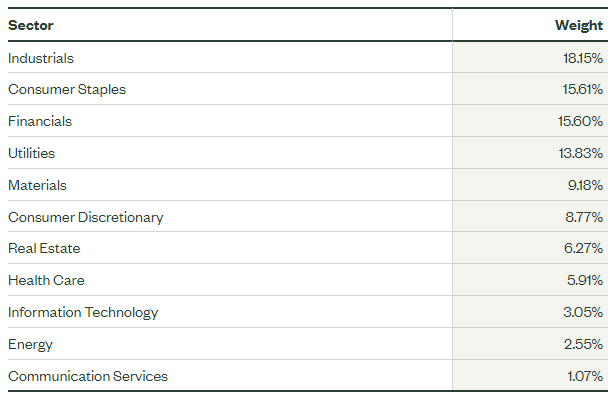
As NOBL, SDY’s relative performance is somewhat dependent on the relative performance of the tech industry. The fund tends to underperform when tech outperforms, as was the case during 2020.
The fund tends to outperform when tech underperforms, as has been the case YTD.
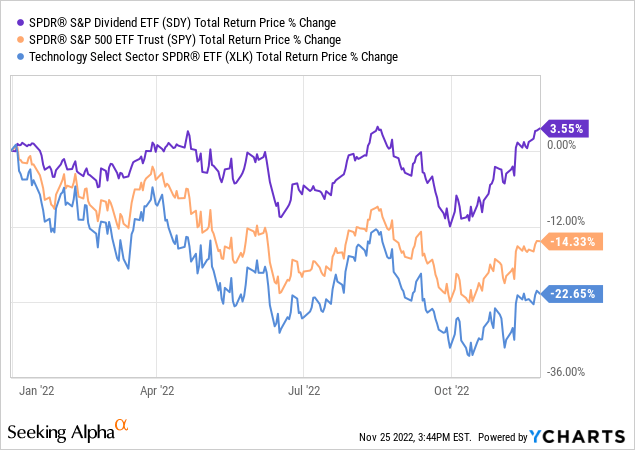
SDY’s industry weights have an important effect on the fund’s relative performance, an important fact for investors to consider.
Let’s do a quick summary.
NOBL and SDY are both Dividend Aristocrats ETFs, focusing on U.S. equities with strong, long dividend growth track-records. NOBL invests in the traditional large-cap S&P 500 Aristocrats, while SDY invests in a broader set of S&P Aristocrats of all market-caps. SDY’s broader, more diversified holdings are a key advantage relative to NOBL, in my opinion at least.
Dividend Comparison – SDY Slight Winner
Both funds have roughly comparable dividend yield and dividend growth track-records, although SDY seems slightly stronger on net.
SDY currently yields 2.5%, while NOBL yields 1.9%. Although both yields are low on an absolute basis, both are slightly higher than the U.S. equity average.
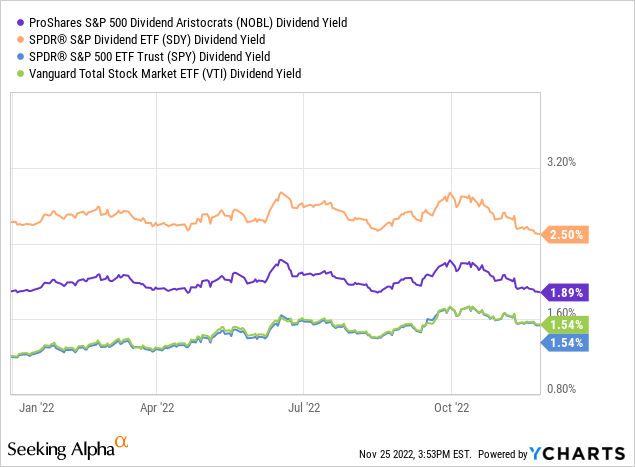
Higher dividend yields are almost always a benefit for investors, and that is the case for both SDY and NOBL. SDY’s yield is slightly higher, a small advantage relative to NOBL.
The underlying holdings of both funds have outstanding dividend growth track-records, sustaining or growing their dividends for at least 20 consecutive years. Dividend growth for both funds is reasonably strong too, generally in the high single-digits per year. Growth for NOBL seems a bit stronger, but it varies across time, and could simply be the result of volatility. Dividend growth figures for these two funds, and for the S&P 500, as reference, are as follows.
SeekingAlpha SeekingAlpha SeekingAlpha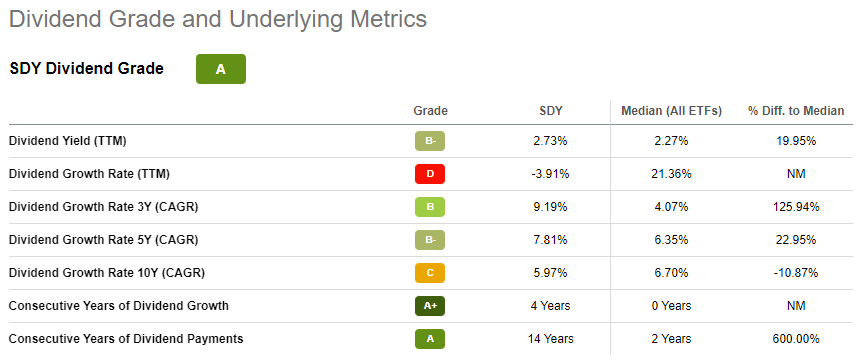
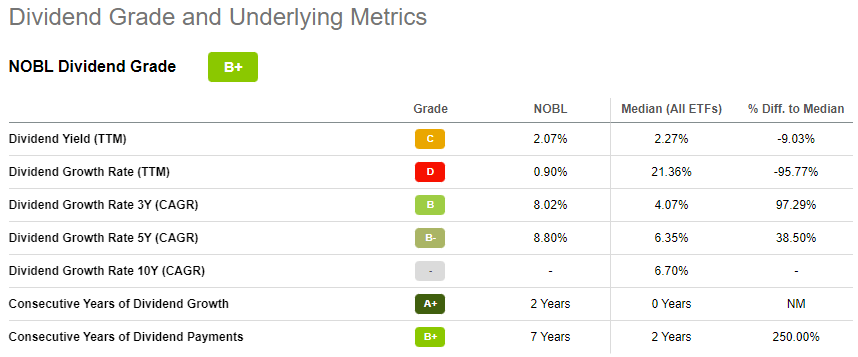
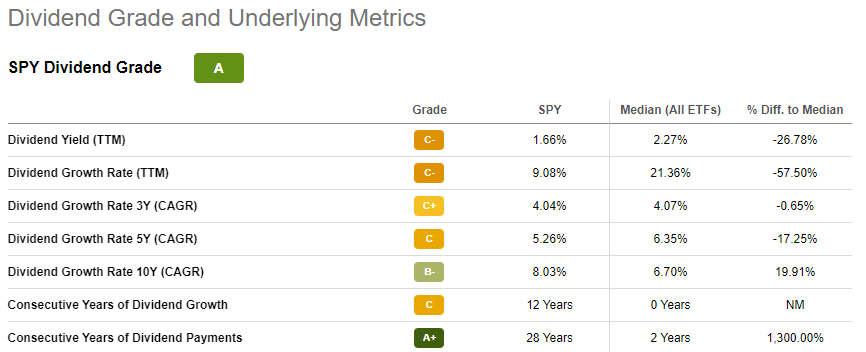
SDY’s dividends seem more volatile than most, and the fund has seen some special distributions in the past. These make estimating dividend growth figures a fraught affair, as growth is significantly impacted by these issues.
SeekingAlpha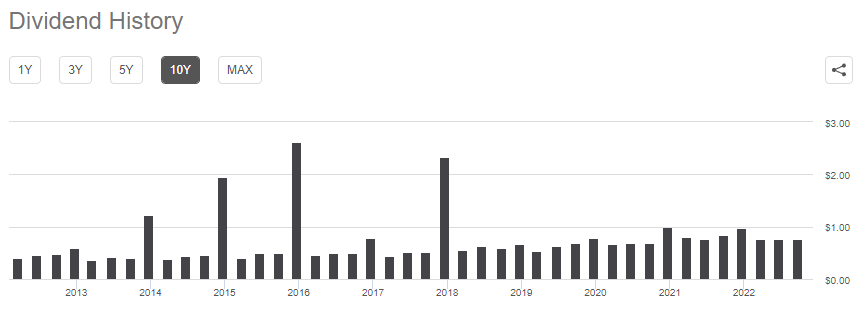
Due to the above, decided to include a quick table with yield on cost metrics for these funds. Said metric mostly ignores these issues, barring a recent special distribution, but there are none. Looking at yield on costs, it seems clear that both NOBL and SDY have seen reasonably good dividend growth for years, benefitting investors. SDY sustains a higher yield on cost relative to NOBL for most relevant time periods, although the gap tends to narrow through time.
SeekingAlpha – Chart By Author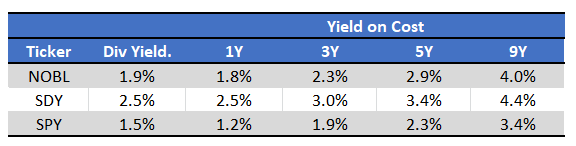
Moving forward, I expect both funds to see sustained, strong dividend growth, for the simple reason that both invest in Dividend Aristocrats, which have the strongest dividend growth track-records in the market. Companies that grow their dividends for decades on end are extremely unlikely to stop, barring an unprecedented economic calamity, one much greater than the financial crisis, coronavirus pandemic, or currently inflationary pressures.
Performance Comparison – Tie
Both NOBL and SDY have comparable, reasonably good, performance track-records.
Long-term performance is similar for both funds, with NOBL matching / marginally outperforming relative to the S&P 500, but SDY slightly underperforming the same. Performance for both funds have materially improved this past year, with both funds, but especially SDY, significantly outperforming relative to the S&P 500. Results are as follows.
ETF.com – Chart by Author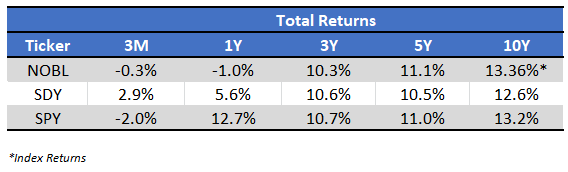
In my opinion, long-term performance for these two funds won’t significantly differ from that of the S&P 500 moving forward. Both funds are simply too diversified, and too focused on large-caps, for that. SDY’s mid-cap and small-caps investments do complicate matters, so the fund’s performance might differ strongly from that of broader equity indexes moving forward, but this does not seem terribly likely, and has rarely occurred in the past. Small differences in performance do occur, but large ones are exceedingly rare.
Notwithstanding the above, I think that both funds are likely to slightly outperform relative to the S&P 500 moving forward, due to their cheap valuations. Let’s have a look.
Valuation Comparison – SDY Slight Winner
Both funds sport relatively cheap valuations, due to their industry exposures. Both are underweight the tech industry, which tends to sport relatively rich valuations. Both are also overweight old-economy industries with cheaper, more competitive valuations, including financials and industrials. Due to this, both funds are relatively cheaply valued, at least in comparison to the S&P 500. SDY’s valuation is also slightly cheaper than NOBL’s, due to the former’s mid-cap and small-cap investments.
Fund Filings – Chart by Author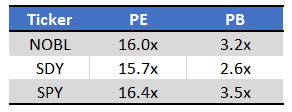
Investing in cheaply valued stocks and funds can lead to strong capital gains and market-beating returns, contingent on valuations normalizing. Valuations have normalized all year, during which both funds have outperformed, as expected. SDY’s performance has been quite a bit stronger recently, due to the fund’s (at the time) moderately lower valuation, and exposure to mid-caps and small-caps.
As both funds still sport relatively cheap valuations, further gains are possible, although these would almost certainly be quite modest: valuations have mostly normalized by now.
As an aside, valuation gaps between these two funds and the S&P 500 were much greater in the past, but the gains above have significantly narrowed down the gap.
Risk Comparison – Tie
Both funds focus on U.S. equities and are reasonably well-diversified, so both funds have broadly similar levels of risk, commensurate to those of most broad-based U.S. equity indexes.
SDY’s broader, more diversified portfolio reduces risk in comparison to NOBL. NOBL’s focus on larger, comparatively safer companies reduces risk in comparison to SDY. The net effect seems to be a wash, in my opinion at least.
Both funds seem about as risky as the S&P 500, at least after accounting for their underweight tech position. Both slightly underperformed during 1Q2020, the onset of the coronavirus pandemic, as tech outperformed during that downturn.
Both have slightly outperformed YTD, as tech has underperformed these past few months.

So, both funds outperformed during the most recent bear market, underperformed during the second most recent bear market. Risk seems about average, and not significantly different from that of broader U.S. equity indexes.
Quick Expenses Comparison – TIE
As a final point, both NOBL and SDY have identical expense ratios of 0.35%. Both ratios are slightly higher than average for U.S. equity index funds, but both are reasonable, and within normal parameters. Higher expenses are always a negative for a fund and their shareholders, and that is the case for NOBL and SDY both. Still, a 0.35% expense ratio is not significantly higher than average, so these are not significant issues or negatives, all things considered.
Conclusion – SDY Slight Winner
NOBL and SDY are broadly similar funds, investing in U.S. Dividend Aristocrats with strong dividend growth track-records. Both are strong investment opportunities, and particularly appropriate for long-term dividend growth investors.
In my opinion, SDY’s broader portfolio and cheaper valuation make it a stronger investment relative to NOBL. Still, both funds are broadly similar investments, and buys.
Be the first to comment