

ClaudioVentrella/iStock via Getty Images
Article Scope
We are currently in what many are calling a bear market rally. Many stocks have recovered a significant portion of their losses, in part due to improved fundamentals, but in some cases simply due to improved investor sentiment. In this context, retailers stand out, as the challenges they currently face have not magically disappeared, and yet companies like Target (TGT), Home Depot (HD) and Walmart (WMT) trade at price-to-earnings ratios in the high teens or even low twenties. Discount retailer Costco Wholesale (COST) even has an earnings multiple in the low 40s. Still, valuations are more or less well below 52-week averages, which raises the question of whether an investment in the retail sector should be considered, even if there is clearly no blood in the streets – which would be the ideal moment to invest according to Nathan Rothschild.
Aside from continued competition from online-only retailers, the last three years have been challenging for the retail sector due to mandated store closures in some cases in 2020, pent-up demand at the end of 2020, ongoing supply chain bottlenecks, and rising inflation. Therefore, I believe that comparing multiple retailers at this point in time can provide a lot of food for thought.
In this article, I analyze nine U.S. retail companies of varying sizes, all of which are currently trading between 5% and 57% below their respective 52-week highs. Therefore, this article should be of interest to both conservative and “deep value” investors. The companies analyzed here are:
- Lowe’s (LOW), a retailer with 2021 sales of almost $100 billion that specializes in home improvement, which recently reported slowing sales but nevertheless good earnings, partly due to an improved inventory position
- The Home Depot, an even larger home improvement retailer than Lowe’s with 2021 sales of over $150 billion (see my recent analysis); the company recently reported strong results and was able to maintain its full-year guidance despite well-known headwinds
- Target, a big box department store that has performed extremely well in recent years, generating sales of almost $105 billion in 2021 and very strong free cash flow; the stock’s share price suffered from much lower than expected earnings and a lowered guidance (see my recent update)
- Walmart, the well-known industry giant with 2021 sales of over $570 billion (I compared TGT and WMT in a separate article); the shares came under quite a bit of pressure after the profit warning, but have since recovered most of their losses
- Costco Wholesale, the membership retailer relentlessly focused on delivering great value for the money, with 2021 sales of almost $200 billion; the company continues to perform extremely well and recently reported comparable quarterly sales up 18%, or 17% year-over-year on a year-to-date basis
- Best Buy (BBY), a consumer electronics retailer with 2021 sales of $52 billion, much smaller than the industry giants above; given the company’s largely discretionary products, it does not come as a surprise that expectations were lowered in recent months and BBY even begun cutting jobs
- Dollar General (DG), another retailer specializing in high-value-for-money items, though much smaller than Costco with sales of $34 billion in 2021; the company just reported a sharp jump in profits and raised sales forecasts
- Kroger (KR), a chain of supermarkets and department stores with 2021 sales of nearly $140 billion and yet a market capitalization lower than DG’s; KR is doing quite well in this difficult environment, raising its full-year profit forecast slightly in June while concerns about margin compression persist
- Kohl’s (KSS), a comparatively small department store chain with $2021 sales of $18.5 billion, has been in the headlines in recent years due to takeover interest, but that has mostly faded to the detriment of shareholders – even though some argue that the expected consideration has been too low
In what follows, I will compare the profitability, growth, and financial stability of the nine companies using well-known, as well as more unconventional, metrics that provide insight into the companies’ overall capital structure (i.e., including lease obligations), operating and financial leverage, and cash flow stability. I will also explore whether each stock is suitable as a dividend growth stock, as I believe we could be in for an extended period of a sidelining stock market (see my related article), and I am a strong proponent of investing for cash returns.
Since the article is a bit longer, readers who are not interested in a lot of detail can either skip directly to the last section where I summarize and discuss the key findings in the context of valuations. However, I have also included a summary table in each section and open with a brief overview.
Quick Overview Of Nine Retail Companies
Table 1 provides a brief overview of the nine companies studied, comparing market capitalization (MC), capital structure, volatility, potential price discount, and economic moat according to Morningstar. It is somewhat surprising that the investor services firm did not even assign a narrow moat to Target, despite the company’s obvious and relentless focus on its customers (whom it refers to as “guests”) and its proven knack for stock selection. It also seems large enough to warrant a narrow economic moat. Conversely, it is very understandable that HD, LOW, WMT and COST were each rated with a wide moat – after all, they operate in an oligopoly in their respective fields.
Table 1: Quick overview of the nine companies under investigation (own work, based on each company’s latest 10-K, share price and volatility data from Yahoo Finance, and moat ratings from Morningstar – a half-filled star indicates a narrow moat)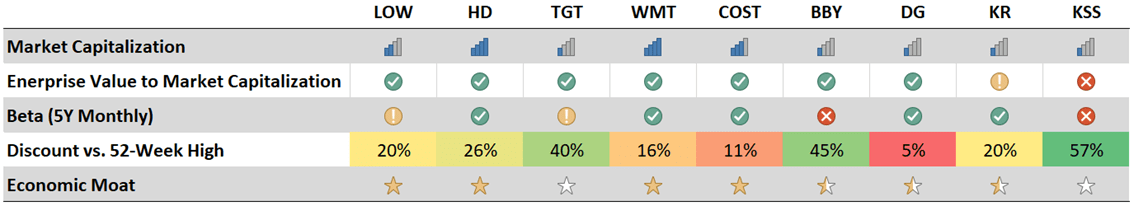
In addition to the MC, which divides the nine companies into a group of larger retailers (LOW, HD, WMT, COST) and a group of smaller retailers (TGT, BBY, DG, KR, KSS), the table also shows the capital structure of the individual companies.
The enterprise value (EV) of each company takes into account debt, cash and discounted future lease obligations in addition to market capitalization. Typically, EV does not include lease obligations, but in the context of retail businesses, I would argue they are particularly important. For example, Kohl’s discounted lease obligations at the end of fiscal 2021 were 385% of the company’s financial debt, while Kroger was operating at only 82% of relative discounted lease obligations. However, this does not mean that Kroger is conservatively financed – on the contrary, Kroger is relatively highly leveraged for a retail company, as will be explained later. In the table, companies with an EV/MC ratio above 1.5 are highlighted in yellow, or red if the ratio is above 2.0.
As an aside, in the past, such obligations were reported off-balance sheet and therefore often did not attract the attention of investors. However, IFRS 16 became mandatory for accounting periods beginning in January 2019 or later, requiring entities to recognize discounted leases on their balance sheets. This topic will be discussed in more detail later in this article.
Investors nearing retirement or who are not particularly risk-tolerant often prefer stocks with low volatility. Beta is a measure of a stock’s volatility compared to the overall market. In the table, stocks with a beta coefficient of less than 1 (i.e., with lower volatility than the overall market) are highlighted in green. A beta coefficient of 1.5 or higher is indicated by a red color. Larger companies tend to be less volatile (for example, Walmart’s beta is 0.54), but there are also stocks of smaller retailers such as Dollar General that are suitable for risk-averse (i.e., volatility-averse) investors. This is likely due to the company’s focus on low-cost private label brands, which makes its earnings relatively insensitive to economic cycles. In contrast, BBY and KSS, with their portfolios consisting largely of discretionary products, are understandably more cyclical and therefore exhibit higher volatility (1.52 and 1.64, respectively). Of course, the drama surrounding the potential takeover of Kohl’s also contributed to the stock’s volatility.
Profitability & Cash Flow Efficiency
Profitability and retailing are usually contradictory. After all, retailers act as middlemen and have a highly complex logistical task (e.g., transportation routes, demand forecasting, store locations) to perform. Their capital expenditures are typically high, and cash flow can be affected by working capital that sometimes cannot be adequately converted into cash earnings due to rapidly changing trends and resulting inventory markdowns. Yet, as will be shown, some retailers are surprisingly profitable and generate very solid cash returns.
Table 2 compares the nine companies from the point of view of profit margins, capital expenditures, operating leverage and cash return on invested capital (CROIC). This profitability metric is, in my opinion, one of the most important, if not the most important metric, as it relates the company’s true cash earnings to its asset base. By true cash earnings, I mean free cash flow normalized with respect to working capital movements and net of share-based compensation expense and impairment and restructuring charges, if applicable, and reported on a recurring basis. For this article, I calculated normalized free cash flow over the last six years to get a sense of working capital trends. However, I included the average free cash flow for 2019 through 2021 in my calculation to provide a reasonably current estimate and because the cash flows for 2020 and 2021 represent downward and upward outliers, respectively.
Table 2: Profitability assessment of the nine companies studied; SD stands for standard deviation (own work, based on each company’s fiscal 2018 to fiscal 2021 10-Ks)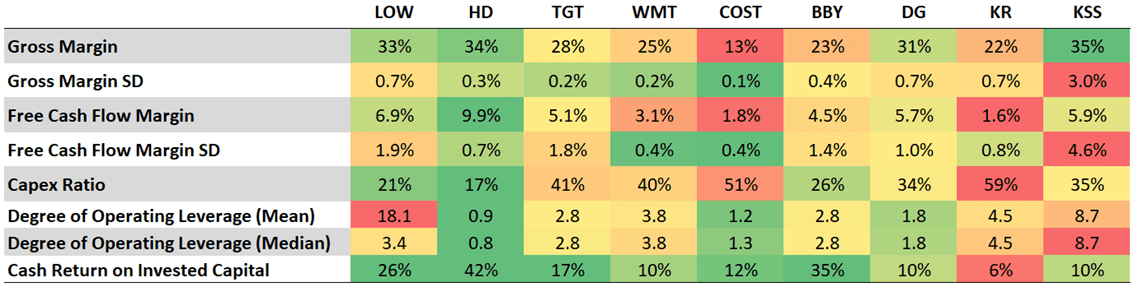
It is immediately noticeable that Costco Wholesale operates with a very low gross margin of only 13% (average 2018-2021). However, COST should not be hastily dismissed as the standard deviation of its gross margin is very low at only ±0.1%. Costco is a membership-only retailer, so it has a very loyal customer base. The company has a highly optimized supply chain and manages only about 3,700 stock-keeping units (SKU). It is therefore not surprising that the free cash flow margin is also hardly subject to fluctuations. Costco is largely – if not completely – insensitive to economic cycles, and investors are currently willing to pay a significant price for this “safe haven factor”.
As will be shown later, Kroger is comparatively cheap, but I would say it is cheap for a reason. Its free cash flow margin is similarly weak as that of COST’s, but its standard deviation is twice as high – coupled with its relatively high leverage, which can already be seen in its high EV/MC ratio, a less than ideal combination. Of the nine companies, and in recent years, Kroger generated the lowest returns for its shareholders from an operating perspective. Even though CROIC cannot be directly compared with the weighted average cost of capital, as it is an equity-related ratio, it nevertheless seems worth mentioning that Kroger has probably not been able to generate positive excess returns on its invested capital, i.e., above is cost of capital, in recent years.
Home improvement retailers LOW and HD are highly profitable, with the latter having a free cash flow margin of almost 10%, although their gross margins are only in the low 30% range. Their capital expenditures are much lower than those of the Target and Walmart, which is a double-edged sword depending on the perspective. Free cash flow margins are very high, but with such low capital expenditures, it seems reasonable to question their ability to increase cash flow through internal optimization. However, both LOW and HD have experienced strong sales growth (see next section) and have therefore increased their cash flow organically. This trend is likely to continue, with the uncertainty being the future of the housing market, which is showing early signs of slowing. The potential slowdown should not be overstated, however, as HD and LOW sales are largely dependent on home equity value and not so much on the number of new homes built. As housing starts decline, it is not unreasonable to expect equity valuations to increase. Homeowners are likely to maintain the value of their properties through renovations. Nevertheless, I recently pointed out that HD investors should be cautious when extrapolating past earnings per share growth into the future, as the company has grown its earnings significantly through debt-fueled share repurchases. Lowe’s is not much different in this regard, as the diluted weighted average number of shares outstanding has declined from 1.15 billion to 668 million over the past decade.
Looking at each company’s degree of operating leverage, LOW stands out at 18.7 (2018-2021 average). Operating leverage is a relatively unconventional but extremely important metric – especially in the context of the retail business. It characterizes a company’s ability to leverage fixed costs or expenses to generate returns. Therefore, it can be considered a double-edged sword. On the one hand, companies with high degree of operating leverage generate relatively higher earnings with a relatively small increase in sales. On the other hand, such companies typically show disproportionately declining earnings when sales decline. In the specific example of LOW, however, the high operating leverage should not be over-interpreted, as it is largely due to the company’s strong earnings growth in 2019 (57% year-over-year), while sales increased by only 1% year-over-year. In 2018, Lowe’s selling, general and administrative expenses were disproportionately high (three percentage points higher than typically observed). Therefore, it makes sense to evaluate Lowe’s based on its median operating leverage (3.4), which is a more meaningful estimate, but still comparatively high. Only Walmart, Kroger and Kohl’s had higher operating leverage ratios. Kohl’s’ degree of operating leverage of almost 9 is a clear sign of the sensitivity of the company’s earnings to economic cycles. In fiscal 2020, the company reported a net loss even after adding impairment charges, while sales were down “only” 20% year-over-year. The vulnerability of the company’s earnings is underscored by the significant volatility of its gross margin (standard deviation of ±3.0%).
Overall, HD is the strongest performer in terms of profitability, highlighted by its CROIC of over 40%. The company is highly cash generative, requires little capital expenditure, and also has the lowest degree of operating leverage. Conversely, however, this means that HD’s profit and cash flow growth are heavily dependent on the company’s ability to grow sales – certainly no easy task for a company that already shares around 30% of the US construction market with Lowe’s.
Growth
In the previous section, I suggested that HD may have difficulty continuing to grow at the pace to which investors have become accustomed in recent years. As Table 3 shows, sales growth at other retailers such as WMT and KR has been on par with inflation even before the recent consumer price inflation uptick. The ongoing competition from online-only retailers is well known, so it is no surprise that Kohl’s sales and profit growth remain weak – especially considering that the pandemic and government-mandated closures have given online-only retailers a tailwind. In this context, Best Buy’s performance can be described as very good – the electronics retailer has grown sales at a compound annual growth rate (CAGR) of 6% since 2018. In addition to sales growth, improvements at the corporate level were also responsible for the very strong free cash flow growth. As for Walmart, its fairly lackluster performance is not surprising considering that it generated nearly $572 billion in sales in 2021 – Walmart is simply a huge company already. For the current year, analysts expect sales of $594 billion (3.7% year-over-year growth), well below the current rate of inflation. It does not seem unreasonable to assume that both Target and Walmart will beat sales estimates, as both companies are currently working through their excess inventory, marking down items heavily, thereby putting pressure on gross margin.
Target has performed very well in recent years, and as I noted above, I cannot quite understand why the company has not been given a narrow economic moat rating by Morningstar. Of course, a wide moat rating would not be appropriate given the company’s comparatively small size (18% and 53% of WMT and COST sales in 2021, respectively).
Table 3: Growth-related parameters of the nine companies under investigation (own work, based on each company’s fiscal 2018 to fiscal 2021 10-Ks)
Financial Stability – Looking Beyond What Is Conventionally Referred To As Debt
Even though some of the retailers discussed in this article are surprisingly profitable, they only operate a middleman’s business and can therefore be relatively vulnerable to exogenous shocks. As a result, conservative investors should avoid highly leveraged retailers, preferring to stick with conservatively financed and large companies.
In this context, Bed Bath & Beyond (BBBY) comes to mind – a comparatively small chain of merchandise retail stores. I have been somewhat bullish on the company’s prospects in 2018, considering it a potential turn-around investment, but at the same time, I have pointed to problems in the company’s management team. I have owned the stock briefly in the past and revisited it in early July 2022, before the recent resurgence of the meme stock frenzy (which has already fizzled out). I concluded that the company could face insolvency and therefore considered the stock too risky. A month later, the company announced that it had consulted with the restructuring experts Kirkland & Ellis. The ongoing involvement of short-term traders and speculators is underscored by the fact that the stock rose nearly 30% after it was announced that the company had reached a credit agreement. Given the company’s rapid cash burn, this appears to be only a short-term solution, and the terms of the loan certainly reflect the increased risk to which BBBY’s creditors are exposed. The company’s 2044 bonds are currently trading at less than 19 cents on the dollar (August 24, 2022).
Returning to the companies discussed in detail in this article, Table 4 summarizes key ratios for assessing financial stability.
Table 4: Financial stability-related metrics of the nine companies under investigation (own work, based on each company’s fiscal 2018 to fiscal 2021 10-Ks; Altman’s Z-Score has been computed on the basis of the coefficients proposed by P. J. Waites in 2014)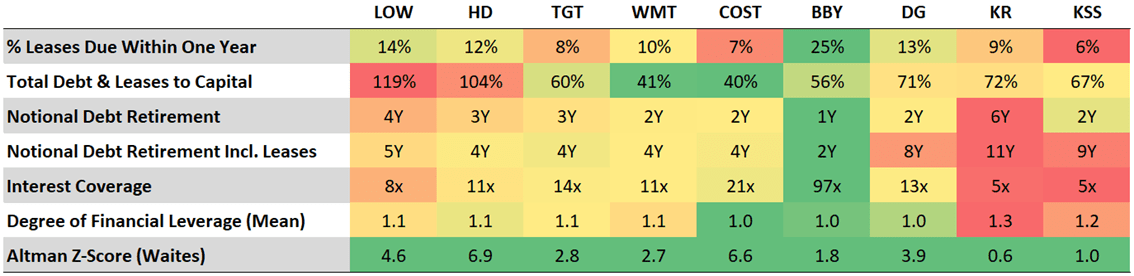
All nine companies have sufficiently high interest coverage ratios when considering average normalized free cash flows for 2019-2021. In this context, and in the context of financial stability in general, BBY serves as a shining example of a conservatively financed company. As noted above, the company’s operating leverage is relatively high, but this is not a concern given Best Buy’s low debt levels. In fact, the company has reported a net cash position at the end of fiscal 2021, which should prove useful as interest rates rise. The company has already generated considerable interest income in recent years.
The degree of financial leverage (the ratio of earnings before interest and taxes to earnings before taxes) is very acceptable on average for all companies except Kroger and Kohl’s. The earnings of these two companies are the most vulnerable to rising interest rates, assuming a similar maturity profile. Like the degree of operating leverage, of course, financial leverage is a double-edged sword: companies with higher financial leverage benefit from lower tax expenses.
As mentioned earlier, I dislike the combination of Kroger’s relatively weak profitability, growth, and high debt. The company may need to consider downsizing or restructuring its store network, but that process is likely to be relatively slow due to Kroger’s leasing schedule – only 9% of its lease obligations mature in 2022, and even less in 2023 and 2024. Kroger’s credit default swap (CDS) spreads signal increasing, yet low, risk. The spread on Kroger’s five-year CDS is now back to late 2019 levels (60 to 80 basis points), about 40 to 60 basis points above the May 2020 low. At the height of the Great Financial Crisis, the spread was between 100 and 140 basis points. Investors interested in the concept of CDS – and other measures of risk – should take a look at my article published in May 2022.
Notional debt retirement assumes that companies suspend both dividends and buybacks and use all average free cash flow from 2019 to 2021 to deleverage. The spread between this duration and the value in the row below indicates a potential over-reliance on lease obligations. In this context, Kroger is also quite weak, but I would not consider the stock overly risky because of the company’s focus on the food, pharmacy and fuel businesses, all of which are non-cyclical. Unionization is a hot topic at the moment, and in that context, it seems worth noting that most Kroger stores offer union contracts and the United Food & Commercial Workers International Union (UFCW) represents workers at two of three Kroger stores nationwide.
The ratio of total debt and leases to capital indicates that both LOW and HD are highly indebted. This is mainly due to the large share repurchases by both companies. In fiscal 2021, HD and LOW repurchased $14.8 billion and $13.0 billion of stock, respectively. As a consequence, the equity ratios of both companies were negative at the end of fiscal 2021. Still, I would dispute that the two home improvement giants are suffering from excessive debt. As I reported in my recent article on HD, the company’s free cash flow could fall by 50% and would bring the company’s debt-to-equity ratio to only six times its fiscal 2021 free cash flow. Both companies are moderately cyclical and dependent on the housing market, but I believe they have strong pricing power and can thrive in a highly inflationary environment – after all, HD has already successfully weathered six recessions. Their CDS spreads are trending north, which is understandable given current recession expectations and high rate of inflation. However, the spreads are still in line with the long-term average of the 2010s (40 and 30 basis points for LOW and HD, respectively), but understandably nowhere near the levels seen during the Great Financial Crisis. Obviously, CDS buyers and sellers see the current environment as similarly unproblematic as HD and LOW stockholders.
If I had to conclude this section with one sentence, I would say that none of the nine companies is at acute risk of being unable to meet its obligations in the near future. This is underscored by the fact that Altman’s Z-score, a routinely applied quick test of a company’s financial stability, is well below the -0.2 threshold in each case. Of course, Kohl’s – which has been fighting windmills – is in comparatively bad shape, but the fact that the company resumed paying a dividend in 2021 leaves a positive impression. Kroger is also in a far from an ideal situation, but its focus on non-cyclical goods is a reassurance.
All Companies Pay Dividends – Which Is The Best Dividend Growth Investment?
Now that the operational aspects of the nine companies have been discussed and the wheat has been separated from the chaff, a brief look at the dividend history and future prospects of each company is warranted. My regular readers know that I place an emphasis on dividend stocks in my portfolio and aim for a balanced mix of well-established, mature companies with relatively high yields but low growth, and those that may not have the reassuring nature of dividend kings but are increasing their dividends at a faster pace.
Table 5 summarizes the most important aspects in this context. Starting yield is a highly subjective parameter – while one investor may be content with a yield below 2% and, by contrast, demand an annual growth rate in the high tens or even low 20 percent range, another may not buy a stock until it is trading at a yield of at least 3%.
Table 5: Dividend-related metrics of the nine companies under investigation; a green arrow indicates that dividend growth has been accelerating over the last ten years, while a red arrow indicates a significant slow-down; a payout ratio below 50% is marked in green, while a payout ratio above 75% is marked in red (own work, based on each company’s fiscal 2018 to fiscal 2021 10-Ks, current dividend data and closing share prices as of August 23, 2022)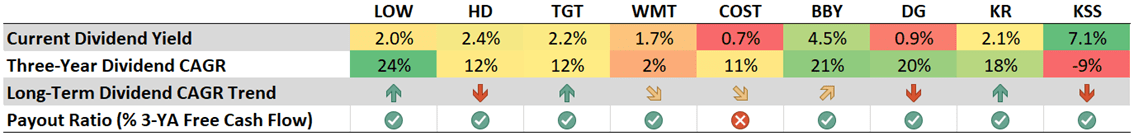
Yield-hungry investors are likely to consider investing in BBY or KSS. However, KSS had to suspend its dividend in 2020 – mainly due to its pronounced degree of operating leverage, as mentioned earlier. The stock currently yields more than 7%, which could point to another dividend cut. However, given that the payout ratio is very low in terms of free cash flow (15% of average 2019-2021 free cash flow), I would not consider the stock a yield trap. That said, dividend investors are often only interested in companies that have an impeccable track record, so KSS is not a viable option due to the suspension of the dividend and subsequent rebasement during the pandemic. News of the potential sale of the company is also likely to attract only short-term investors.
As a long-term-oriented dividend growth investor, I would also not consider Kroger a viable choice given its weak balance sheet coupled with slow growth and lackluster profitability. It is oftentimes only a matter of time before operating performance is reflected in a company’s dividend record. Of course, I am not suggesting that a dividend cut is in order at Kroger – the company currently pays out less than 30% of its average 2019-2021 free cash flow, and the dividend growth rate has actually increased in recent years. However, given the relatively high degrees of operating and financial leverage, a slowdown in dividend growth does not seem like an unreasonable expectation, and investors should certainly consider the maturity profile of the company’s debt in their due diligence.
Unlike Kohl’s and Kroger, Best Buy appears to be a much more solid dividend stock with its 20-year growth streak, impeccable balance sheet, payout ratio in the 30% range, and annual dividend growth rate above 20% and even trending north. However, such a conservative payout ratio should also be expected from a company with a pronounced degree of operating leverage. Of course, potential investors should keep an eye on the company’s focus on consumer electronics against the backdrop of a looming recession.
Considering how well Costco is managed and that the company’s balance sheet is very solid, the dividend payout ratio of currently more than 170% of average free cash flow for 2019-2021 is surprising. However, investors should not be confused as the company has occasionally paid a special dividend in the past. In fiscal 2021, Costco paid a special dividend of $10 per share, suggesting that management is much more shareholder-friendly than the quarterly dividend of $3.6 per share indicates. Excluding the special dividend, the payout ratio is below 50% – higher than several competitors, but still very acceptable, and I would not expect a significant slowdown in the growth trend given the continued strong operating performance. Over the past decade, dividend growth has slowed insignificantly by one percentage point, but given an average dividend CAGR of 11%, COST shares still far outpace inflation. However, as investors flee to safety and recession- and inflation-resistant retailers, COST shares are significantly overvalued, a fact underscored by the current dividend yield of just 0.7%. Dollar General shares have “suffered” a similar fate, and I consider them overvalued as well. Its dividend CAGR of 20% is compelling, but the company would still need almost ten more years to match Best Buy’s current yield.
Walmart is currently unattractive from a dividend growth investor’s perspective, with a growth rate in the low single digits and a yield below 2%. Considering that Walmart can be characterized as a slow-moving giant that struggles to generate significant growth, dividend growth investors may want to look elsewhere, even though Walmart’s earnings are certainly very robust and hardly sensitive to economic cycles.
In my opinion, home improvement companies LOW and HD currently offer the best of both worlds, i.e., an acceptably high dividend yield coupled with a strong dividend growth rate and a solid market position with monopolistic tendencies. HD offers a higher current yield, but its payout ratio is already in the 50% range, while LOW only pays out about 30% of its average 2019-2021 free cash flow. Therefore, it is not surprising that the dividend growth rate of the former company has declined significantly over the past decade.
Valuation and Verdict
If you are still with me – congratulations, you have just made it through approximately 5,000 words of more or less hard-to-digest financial analysis. I appreciate you taking the time to read the entire article. However, if you jumped straight to this section, I certainly will not condemn you.
As the title of this article suggests, stock market investors are currently looking beyond the current challenges and are increasingly optimistic. However, as Table 1 shows, all nine stocks are trading more or less well below their 52-week highs. But does that make them unquestionably a buy? In the following table, I have summarized the discount or degree of overvaluation when comparing current multiples to five-year averages. In this context, it is important to note that we have experienced an extremely strong bull market in recent years and therefore the degree of discount – if any – should not be overstated.
Table 6: Valuation metrics of the nine companies under investigation (own work, based on each company’s fiscal 2018 to fiscal 2021 10-Ks, current and historical dividend data, and valuation metrics as published on the respective stock’s valuation tab on Seeking Alpha on August 25, 2022)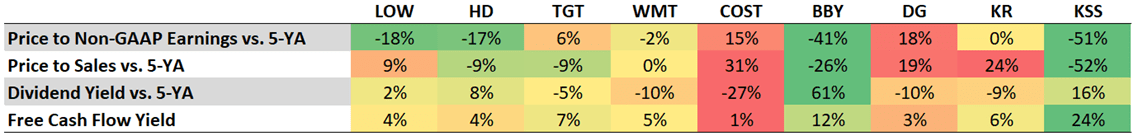
It is clear that investors are playing it safe in mid-2022 and focusing on discount retailers that are currently thriving, i.e., Costco Wholesale and Dollar General. However, buying shares of a company regardless of price and just because it is currently doing very well and has a solid balance sheet is not what I would call “playing it safe”. Instead, such stocks are best bought at times when the masses are snatching high-flying growth stocks out of each other’s hands and disregarding companies with strong, current cash flow.
Therefore, I would consider only the stocks of retail companies whose earnings are vulnerable to economic downturns (LOW, HD, BBY) to be reasonably decently valued at this time. HD and LOW are certainly not cheap, but at least not grossly overvalued. All three have solid balance sheets, even though the two home improvement giants have been aggressively buying back shares. HD’s management just announced a new $15 billion buyback program, which I am sure will be funded in significant part by debt. While I am not a big fan of these practices, they do show management’s optimism about the company’s future. As a conservative investor, I will take a closer look at Best Buy, as the company has the tools to weather even a significant recession (net cash position, high return on invested capital, low capital expenditures, acceptable degree of operating leverage).
Kohl’s can be considered a deep value pick. The company has its challenges, such as strong competition (both online and offline), but it is not threatened by insolvency in the short term and is quite well-managed. The fact that the sale did not go through is a sign of the increasingly difficult financing situation for private equity firms and the like, and another indication that we may indeed be facing a downturn. Investors considering a position in Kohl’s should also take a close look at the company’s real estate portfolio.
Walmart’s valuation is not very attractive given its weak growth prospects, and I would definitely prefer an investment in Target at the right price (i.e., $140 or less). However, investors should keep in mind that Target and Walmart manage about 75,000 and 140,000 SKUs, respectively, and therefore have much more complex logistics to operate than, say, Costco. Both companies have already reported lower gross margins and are expected to continue to do so as inventory is being marked down as a result of the recent outsized increase in working capital. However, I personally think Target’s management philosophy is very good, and the long-term consistency of the company’s results is very reassuring. After all, the company is a dividend king with a 52-year growth streak and A-rated long-term debt, and it is still much smaller than Walmart.
In the event that we are headed for a recession, and against the backdrop of rising interest rates, Kroger’s high leverage and relatively weak profitability make it a suboptimal investment. The valuation does not currently reflect these issues – or, more likely in my view, investors are overlooking them because of the company’s focus on non-cyclical food retailing, fuel sales and pharmacies.
For my own portfolio, I recently bought a starting position in HD, although I am not willing to add at the current level. I thought about opening a position in Target, but as I pointed out in my comparative analysis with Walmart, I opted for a wait-and-see position because I suspect we could see another downward move. Sometimes it is just best to sit there and do nothing – to paraphrase Warren Buffett.
Thank you very much for taking the time to read my article. In case of any questions or comments, I am very happy to read from you in the comments section below.
Be the first to comment