

Joe Raedle/Getty Images News
By The Valuentum Team
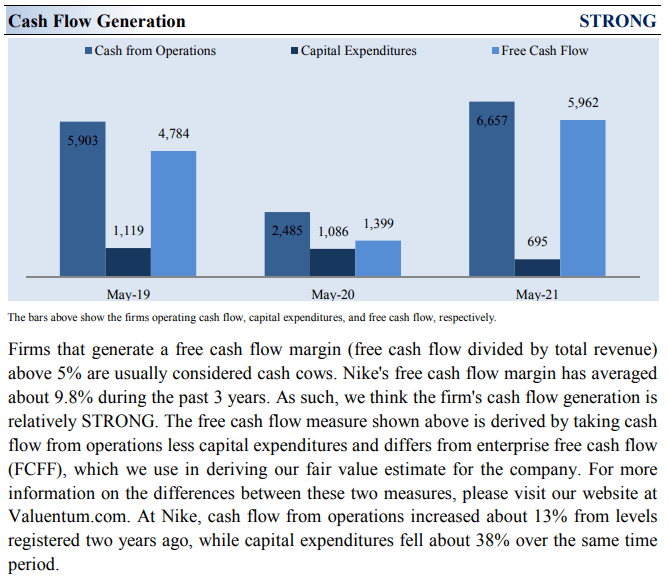
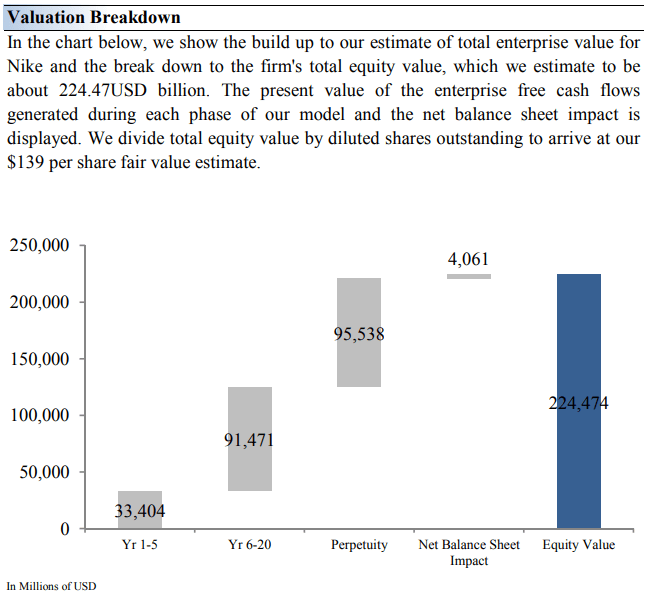
Very few other companies, if any other, have built such deep, personal connections with the consumer as Nike, Inc. (NYSE:NKE) has, let alone the tremendous brand strength, and its endorsement deal with LeBron James gives it yet another top-notch globally marketable superstar. Nike’s annual free cash flows averaged ~$4.0 billion from fiscal 2019-2021, versus its ~$1.6 billion in dividend obligations in fiscal 2021, and it had a solid net cash position on the books at the end of fiscal 2022. The sustained strength seen at its digital and direct-to-consumer operations supports Nike’s outlook, which remains bright.
From its namesake to Jordan Brand to Hurley to Converse, Nike is the #1 sports brand period, and we doubt any other company will come close to challenging that anytime soon. Many such as Under Armour (UA) (UAA) or adidas (OTCQX:ADDYY) (OTCQX:ADDDF) will try, however. Consumer preferences are still fickle, and the global economy, particularly U.S.-China tensions, and inflationary pressures may challenge its results, but Nike’s focus on exceeding the athlete’s expectations is second to none. Though it’s hard to find much fault with Nike’s business model and its dividend payout, we caution that its share repurchases compete for capital against its dividend program, and its share buyback program is huge.
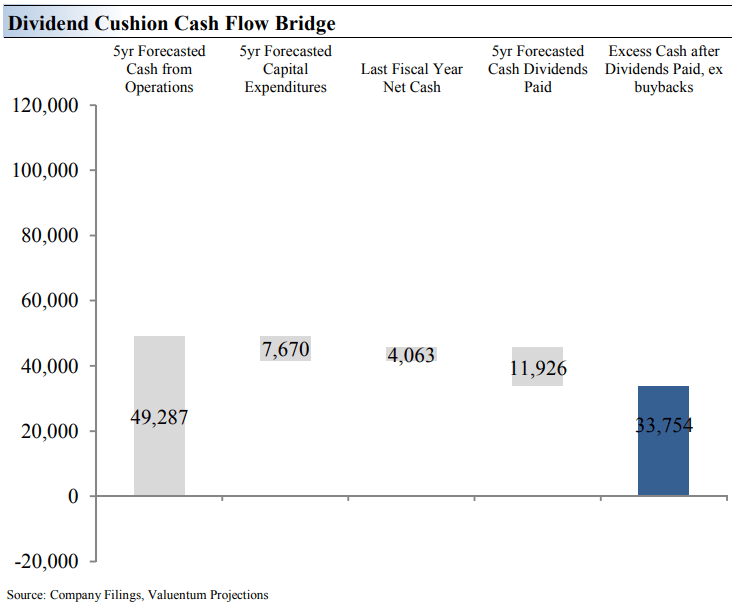
The Dividend Cushion Cash Flow Bridge illustrates the components of the Dividend Cushion ratio and highlights in detail the many drivers behind it. Nike’s Dividend Cushion Cash Flow Bridge reveals that the sum of the company’s 5-year cumulative free cash flow generation, as measured by cash flow from operations less all capital spending, plus its net cash/debt position on the balance sheet, as of the last fiscal year, is greater than the sum of the next 5 years of expected cash dividends paid. Because the Dividend Cushion ratio is forward-looking and captures the trajectory of the company’s free cash flow generation and dividend growth, it reveals whether there will be a cash surplus or a cash shortfall at the end of the 5-year period, taking into consideration the leverage on the balance sheet, a key source of risk. On a fundamental basis, we believe companies that have a strong net cash position on the balance sheet and are generating a significant amount of free cash flow are better able to pay and grow their dividend over time. Firms that are buried under a mountain of debt and do not sufficiently cover their dividend with free cash flow are more at risk of a dividend cut or a suspension of growth, all else equal, in our opinion. Generally speaking, the greater the ‘blue bar’ to the right is in the positive, the more durable a company’s dividend, and the greater the ‘blue bar’ to the right is in the negative, the less durable a company’s dividend.
Still, we value shares of Nike at $139 on the basis of our discounted cash flow process, comfortably above the $105 mark where shares are currently trading. The sports brand giant boasts a solid dividend yield of ~1.1% at the time of this writing, and it has one of the strongest Dividend Cushion ratios in our coverage (see image above for the Dividend Cushion Cash Flow Bridge). The Dividend Cushion ratio is one of the most powerful financial tools an income or dividend growth investor can use in conjunction with qualitative dividend analysis. The ratio is one-of-a-kind in that it is both free-cash-flow based and forward looking, unlike the traditional payout ratio that focuses on accounting earnings per share, which is not cash-flow based. Nike’s Dividend Cushion ratio stands at 3.8 (the higher the ratio above 1, the better).
Valuentum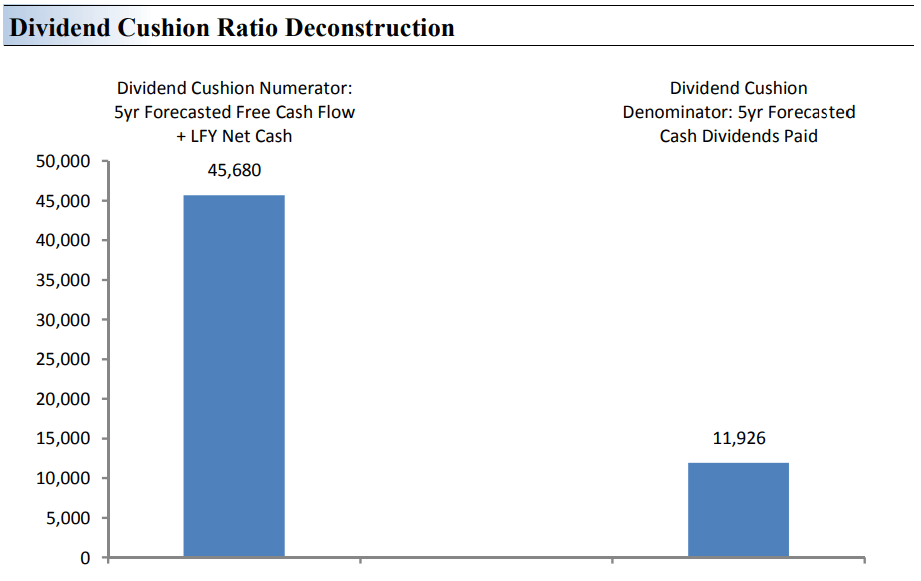
The Dividend Cushion Ratio Deconstruction reveals the numerator and denominator of the Dividend Cushion ratio. At the core, the larger the numerator, or the healthier a company’s balance sheet and future free cash flow generation, relative to the denominator, or a company’s cash dividend obligations, the more durable the dividend. In the context of the Dividend Cushion ratio, Nike’s numerator is larger than its denominator suggesting strong dividend coverage in the future. The Dividend Cushion Ratio Deconstruction image puts sources of free cash in the context of financial obligations next to expected cash dividend payments over the next 5 years on a side-by-side comparison. Because the Dividend Cushion ratio and many of its components are forward-looking, our dividend evaluation may change upon subsequent updates as future forecasts are altered to reflect new information.
Nike’s Key Investment Considerations
Nike focuses its ‘Nike Brand’ product offerings in the following categories: Running, Basketball, Football (Soccer), Men’s Training, Women’s Training, Nike Sportswear (sports-inspired lifestyle products), Action Sports, Gold, and the Jordan Brand. The breadth and depth of its product portfolio have translated into consistently strong results.
Nike is targeting material revenue growth. The company’s internal long-term financial model indicates high single-digit to low double-digit revenue growth, mid-teens earnings per share growth and expanding returns on capital (please view our expectations of Nike’s return on invested capital in the image that follows).
In June 2017, Nike announced the launch of its Nike Consumer Direct Offense initiative, which aims to grow its digital and direct-to-consumer sales. This strategy has played a key role in supporting Nike’s sales and bottom-line performance in recent years. Digital and D2C sales support Nike’s margins. There is ample room for further upside on this front.
Nike’s immense pricing power is enabling the firm to offset inflationary headwinds seen of late, to a degree. Shifting towards a D2C distribution model and away from a wholesale model supports its margin outlook. Nike is focused on bulking up its digital operations to support its longer term growth trajectory.
We don’t expect any damages to the Nike or Jordan brands in the foreseeable future, but adidas has done well in taking share in U.S. athletic footwear. The gains have not come fully at the expense of Nike, but the strengthening rival is worth watching.
Nike’s Economic Profit Analysis
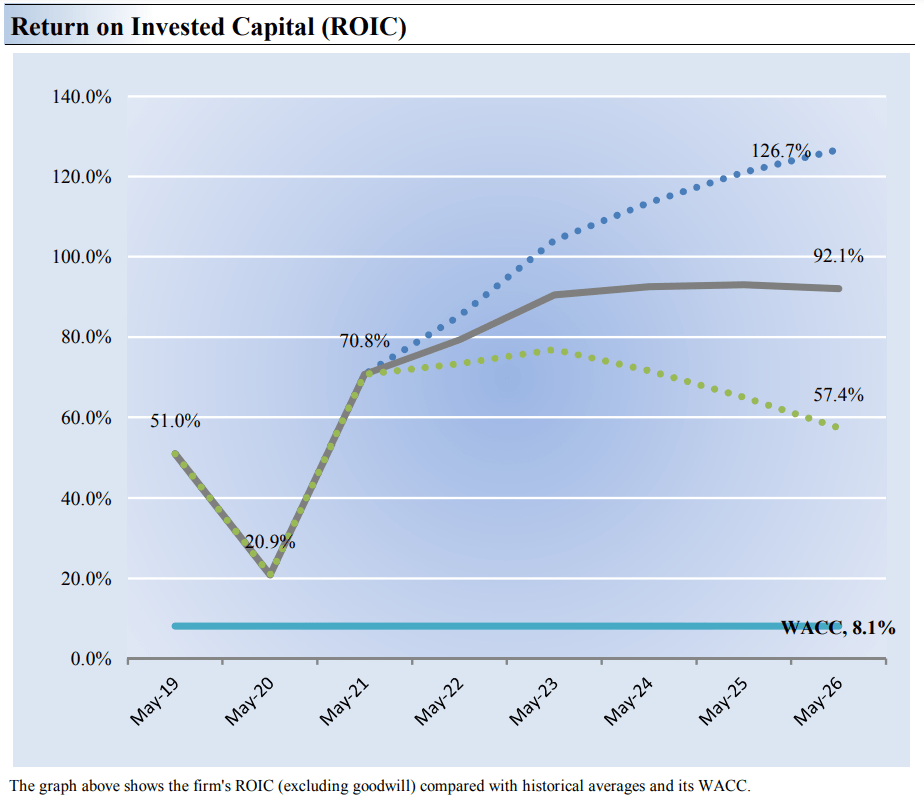
The best measure of a company’s ability to create value for shareholders is expressed by comparing its return on invested capital with its weighted average cost of capital. The gap or difference between ROIC and WACC is called the firm’s economic profit spread. Nike’s 3-year historical return on invested capital (without goodwill) is 47.6%, which is above the estimate of its cost of capital of 8.1%.
As such, we assign Nike a ValueCreation™ rating of EXCELLENT. In the chart below, we show the probable path of ROIC in the years ahead based on the estimated volatility of key drivers behind the measure. The solid grey line reflects the most likely outcome, in our opinion, and represents the scenario that results in our fair value estimate. Nike is a fantastic economic-profit generator, and we expect this to continue, despite challenges in Greater China and higher freight and logistics costs.
Latest Quarterly Analysis of Nike
On June 27, Nike’s fourth-quarter fiscal 2022 results for the period ended May 31, 2022 were about as expected as its direct-to-consumer business offset weakness elsewhere. On a consolidated basis, the company experienced a modest revenue decline due largely to weakened sales in Greater China (FXI), but Nike was still able to beat consensus estimates, with diluted earnings per share coming in at a healthy $0.90. Still, fourth-quarter fiscal 2022 revenues dropped 1% due in part to currency pressures, while net income fell 5% and diluted earnings per share dropped 3%.
Nike’s gross margins were hurt 80 basis points in the quarter in part due to obsolescence reserves from weakened demand in Greater China and higher freight and logistics expenses. The company noted that inventories leaped 23% from the prior-year period, to $8.4 billion, due to supply chain issues, and we’re not too happy about the inventory build, but the increase is understandable given lockdowns in Greater China. Revenue in Greater China fell 19% in the quarter, too, which while striking, may have been better than many were expecting, again given the lockdowns.
Image Source: Nike’s 8-K, June 27, 2022. Nike’s revenue faced pressure in Greater China to the tune of -19% as apparel sales fell 39%. Though the results were disappointing, we believe that many market participants were expecting worse. (Image Source: Nike’s 8-K, June 27, 2022)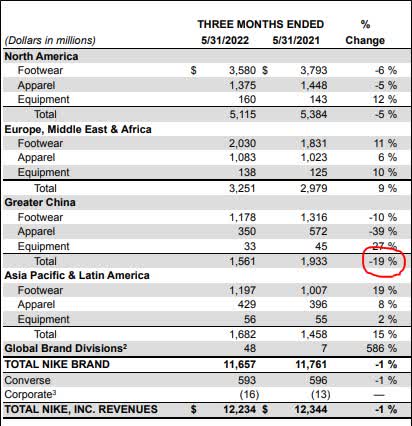
All things considered, the quarterly performance could have been better, but it fits the major consumer-business related themes we’ve been witnessing of late with respect to gross margin pressure and inventory build. In the company’s fourth-quarter 2022 press release, the company announced a brand new four-year $18 billion share repurchase program, and while we’d prefer Nike to stock up more cash on its balance sheet, it’s hard to argue with an executive suite that knows its shares are underpriced. After all, we value Nike’s equity at $139 per share, meaningfully higher than its share price of ~$105 at the moment. The board is clearly looking to add economic value by buying back Nike stock on the cheap.
Looking at Nike’s balance sheet, there’s not much to worry about. Cash and equivalents and short-term investments totaled ~$13 billion at the end of May, while total debt and notes payable were ~$9.43 billion, good enough for a solid net cash position. The company hasn’t published a cash flow statement yet, and while the inventory build will represent a stiff use of cash in the period, management did note that “free cash flow was offset by share repurchases and dividends,” implying, at least to us, that the measure was still strong, albeit not as strong as it could have been. We continue to be huge fans of Nike’s free cash flow generating capacity as well as its net cash rich balance sheet as it buys back its own underpriced stock.
Nike’s Cash Flow Valuation Analysis
We think Nike is worth $139 per share with a fair value range of $111-$167. The margin of safety around our fair value estimate is driven by the firm’s LOW ValueRisk rating, which is derived from an evaluation of the historical volatility of key valuation drivers and a future assessment of them.
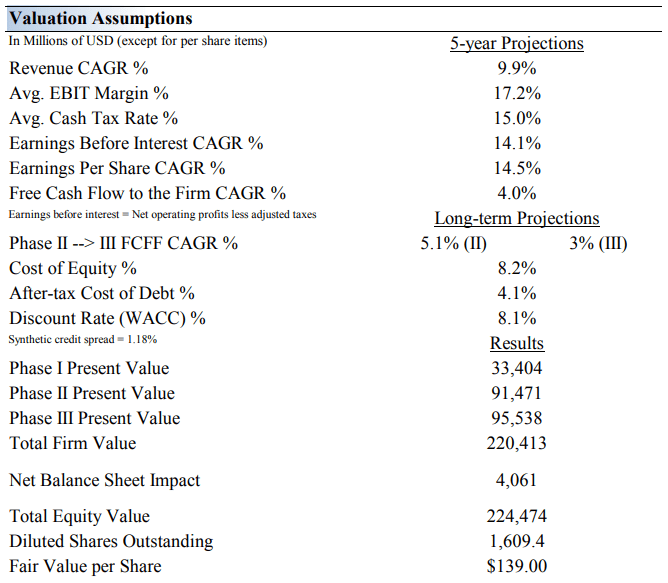
Our near-term operating forecasts, including revenue and earnings, do not differ much from consensus estimates or management guidance. Our model reflects a compound annual revenue growth rate of 9.9% during the next five years, a pace that is higher than the firm’s 3-year historical compound annual growth rate of 7%.
Our model reflects a 5-year projected average operating margin of 17.2%, which is above Nike’s trailing 3-year average. Beyond year 5, we assume free cash flow will grow at an annual rate of 5.1% for the next 15 years and 3% in perpetuity. For Nike, we use a 8.1% weighted average cost of capital to discount future free cash flows.
Nike’s Margin of Safety Analysis
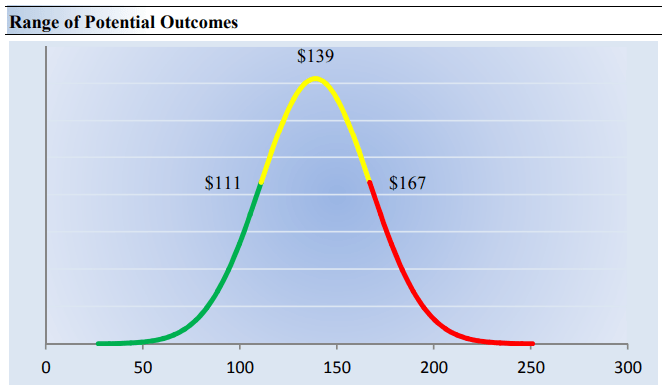
Our discounted cash flow process values each firm on the basis of the present value of all future free cash flows. Although we estimate Nike’s fair value at about $139 per share, every company has a range of probable fair values that’s created by the uncertainty of key valuation drivers (like future revenue or earnings, for example). After all, if the future were known with certainty, we wouldn’t see much volatility in the markets as stocks would trade precisely at their known fair values.
This is an important way to view the markets as an iterative function of future expectations. As future expectations change, so should the company’s value and its stock price. Stock prices are not a function of fixed historical data but rather act in such a way to capture future expectations within the enterprise valuation construct.
Our ValueRisk rating sets the margin of safety or the fair value range we assign to each stock. In the graph above, we show this probable range of fair values for Nike. We think the firm is attractive below $111 per share (the green line), but quite expensive above $167 per share (the red line). The prices that fall along the yellow line, which includes our fair value estimate, represent a reasonable valuation for the firm, in our opinion.
Concluding Thoughts
Nike CEO John Donahoe may have said it best in its fourth-quarter fiscal 2022 press release:
“Nike’s results this fiscal year are a testament to the unmatched strength of our brands and our deep connection with consumers. Our competitive advantages, including our pipeline of innovative product and expanding digital leadership, prove that our strategy is working as we create value through our relentless drive to serve the future of sport.”
What more can we say about this great company. We like its financials quite a bit, fourth-quarter fiscal 2022 earnings came in better than expected, the company is navigating supply chain issues, inflationary pressures, and weakness in Greater China quite well, and it just launched a new massive buyback program to take advantage of its underpriced stock. Nike boasts an impressive Dividend Cushion ratio of 3.8, and we’re reiterating our $139 per share fair value estimate on shares. Shares yield ~1.1% at the time of this writing.
This article or report and any links within are for information purposes only and should not be considered a solicitation to buy or sell any security. Valuentum is not responsible for any errors or omissions or for results obtained from the use of this article and accepts no liability for how readers may choose to utilize the content. Assumptions, opinions, and estimates are based on our judgment as of the date of the article and are subject to change without notice.
Be the first to comment