

jaturonoofer/iStock via Getty Images
If I was to say the word bank, JPMorgan Chase (JPM), Bank of America (BAC), or Wells Fargo (WFC) would probably be the first companies you associated with the word. JPM, BAC, and WFC are 3 of the largest banks in the United States, so this wouldn’t come as a surprise. Outside of the national banking establishments, there are also regional and Thrift banking institutions. Thrift banks specialize in savings accounts and originating home mortgages for their customers. Thrift financial institutions are also known as savings and loan associations.
The largest difference between a conventional and thrift banking institution is that thrifts are established to service consumers rather than businesses. Thrift banking establishments are required to segment 65% of their lending portfolio toward individual consumer loans. Thrift banks can offer larger interest rates on customer’s savings as they have the ability to borrow money at a lower rate of interest from Federal Home Loan Banks. While their main lines of business are savings and originating mortgages, Thrifts also offer standard banking products such as checking, personal & car loans, and credit cards. The disadvantages of Thrift institutions are that they offer fewer services and options compared to a JPM, especially when someone is looking at wealth management and foreign exchange availability.
Based on my research New York Community Bancorp, Inc. (NYSE:NYCB) is the largest bank in the Thrifts and Mortgage Finance sector. This is a name that may be controversial as NYCB reduced its annual dividend by -38% in Q1 of 2016 and has declined by -26.57% YTD. I have been taking a hard look at different banks as they have been selling off into a rising rate environment. The Fed has been aggressive in 2022 and is projected to increase rates by another 0.75% in July.
Theoretically, the foreseeable future should be bullish for banks as rising rates will work in their favor. NYCB hit my radar as, after years of disappointment, its financials are moving in the right direction. NYCB is growing its overall revenue, net interest income, net income, and EPS, while decreasing its total non-interest expenses. Since there aren’t many thrift banks comparable in size to NYCB I have compared it to 3 thrift banks and 3 regional banks based on specific metrics I look at, and NYCB looks attractive.
Since 2016 NYCB has maintained its dividend at an annual rate of $0.68, which is a forward yield of 7.46%. I think the financial industry has been hit hard during the market decline, and shares of NYCB look to be an opportunity in the Thrift banking sector.
Seeking Alpha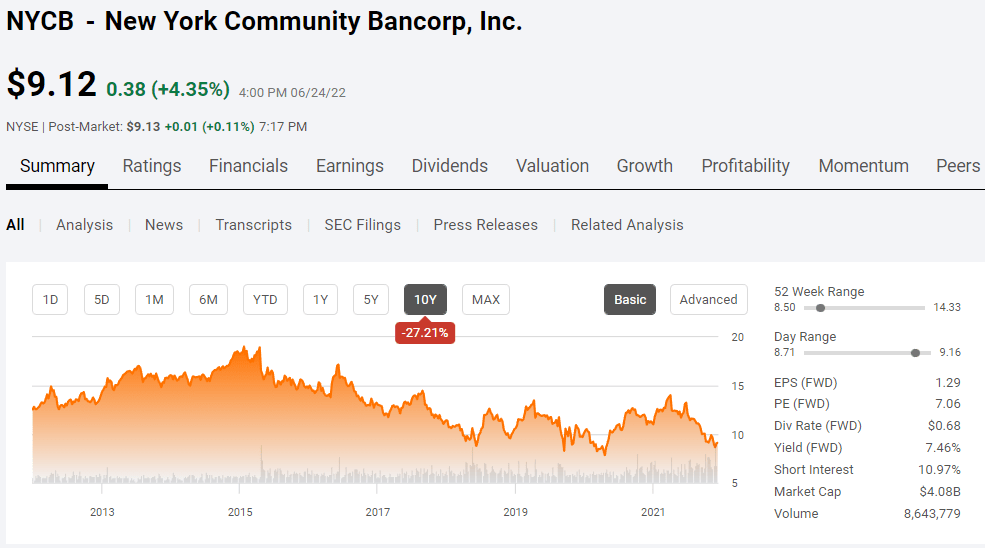
New York Community Bancorp is growing and improving its financials
Prior to conducting a comparison against its competitors, I want to gather an overall picture of NYCB’s business. Over the previous decade, shares of NYCB have been disappointed as they peeked around $18.95 in October of 2015 and established a track record of lower lows and lower highs since then. Shares of NYCB have declined by roughly -51.87% since October of 2015, so I wanted to understand 2 things, why have they declined, and have the financials been improving?
When looking at NYCB’s 2015 numbers, I can see why shares declined. 2015 was the only year in the previous decade where NYCB generated less than $1 billion in revenue and produced negative net income and EPS. 2015 looks like it was a horrible year for NYCB as it lost -$47.2 million and produced -$0.11 in EPS. This makes sense of why a dividend reduction occurred in the beginning of 2016. NYCB’s 2016 fiscal year was the exact opposite of 2015, as revenue grew by 125.43% ($795 million), and its net income jumped from -$47.2 million to $495.4 million. 2015 looks like an anomaly as it’s the only negative year NYCB produced in a decade, but the story wasn’t as simple as that. While NYCB reversed its course in 2016, it experienced several years of declines.
From 2016 – 2019 NYCB’s revenue declined by -27.63%, from $1.43 billion to $1.03 billion.
Steven Fiorillo, Seeking Alpha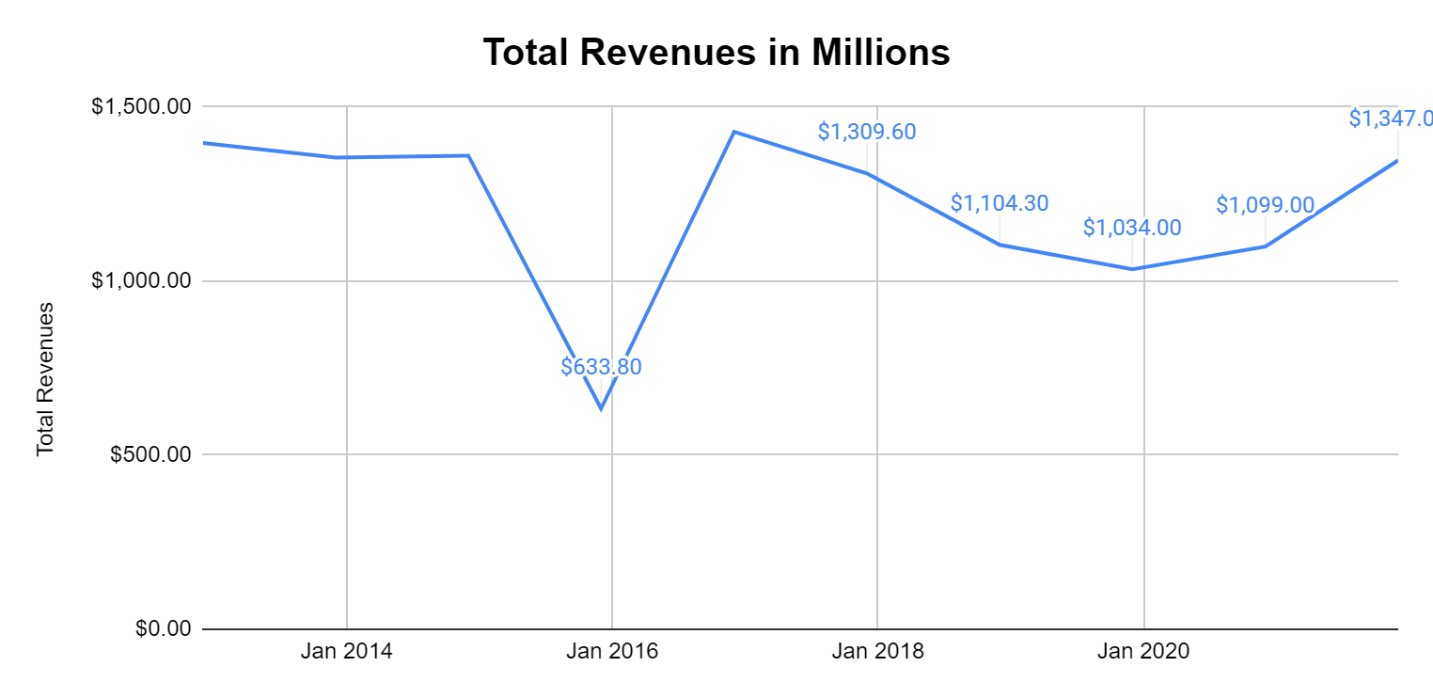
From 2016 – 2019 NYCB’s net income declined by -20.27%, from $495.4 million to $395 million.
Steven Fiorillo, Seeking Alpha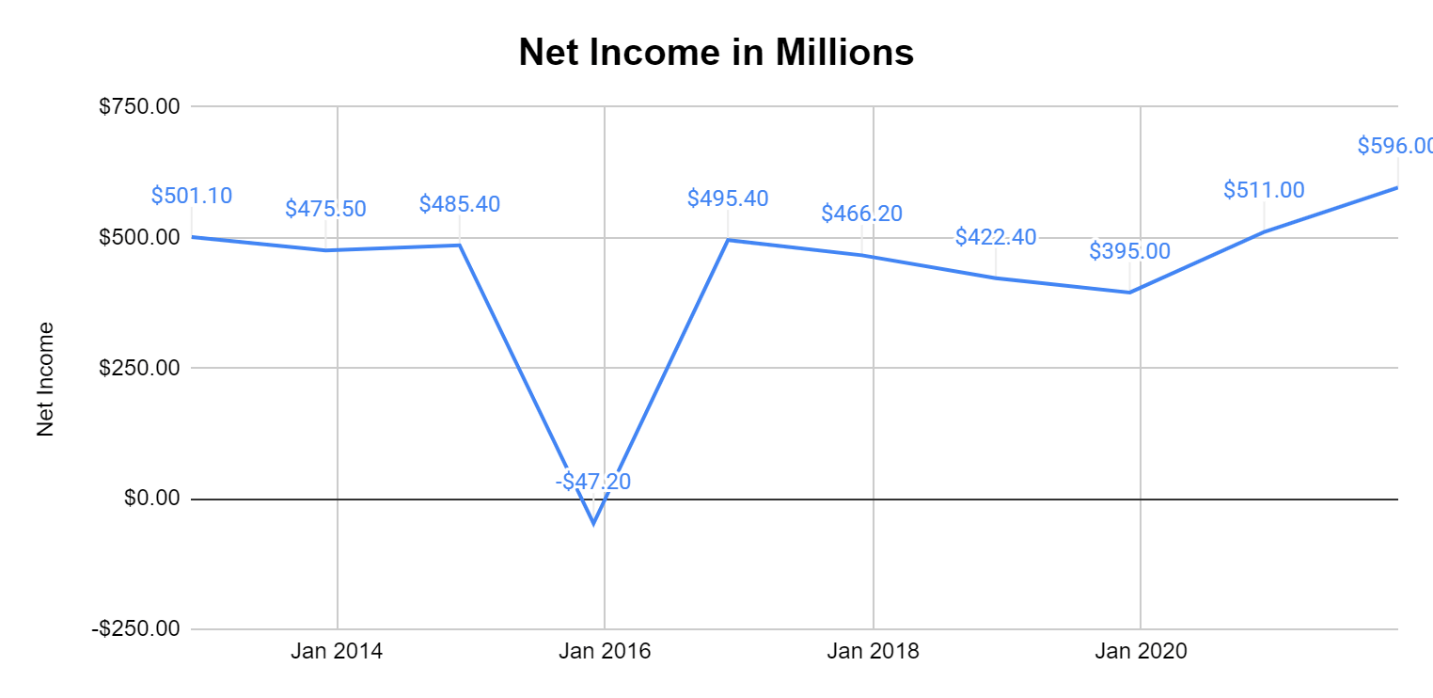
These declines impacted NYCB’s EPS as it fell by -23.76%, from $1.01 to $0.77 per share.
Steven Fiorillo, Seeking Alpha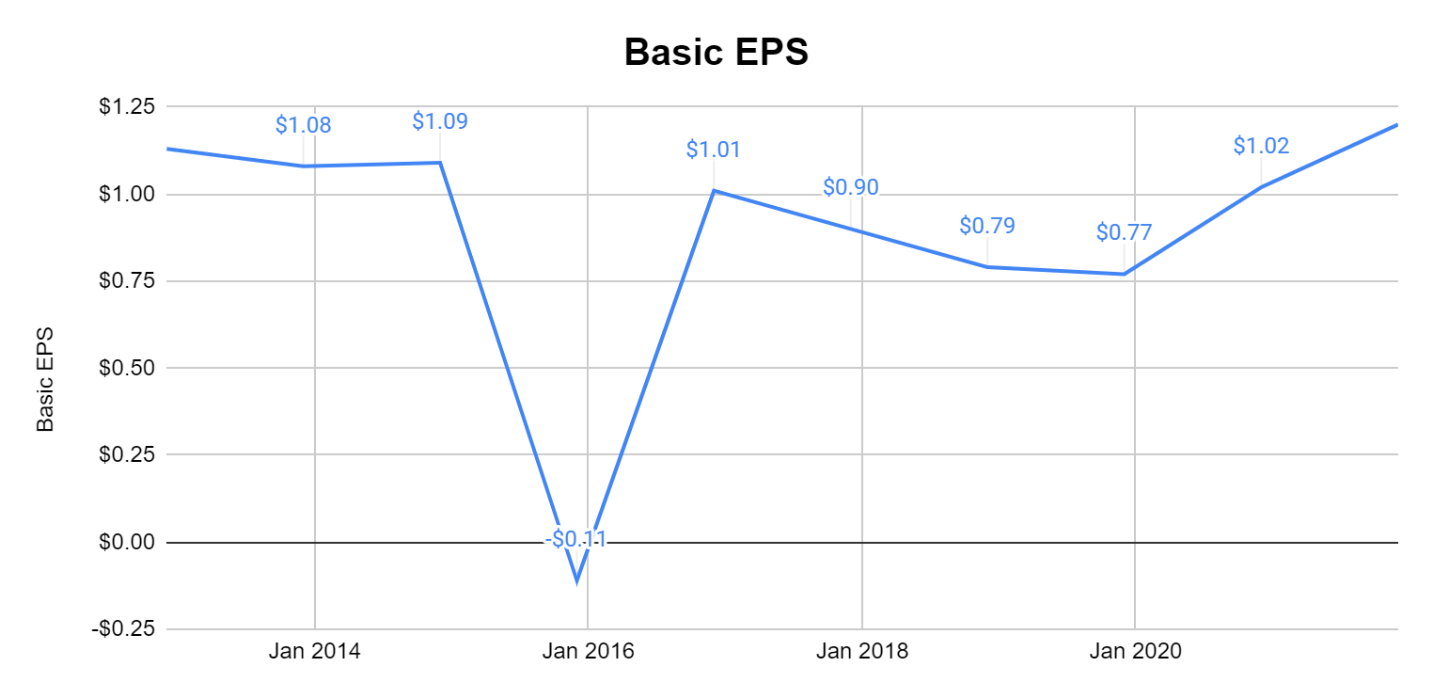
As you can see from the charts, NYCB has been growing since the close of 2019. Surprisingly NYCB found strength throughout the pandemic, and over the past 2 fiscal years and the current TTM, these metrics are looking much better. Since the close of 2019, revenue is up 32.31%, net income has climbed 53.42%, and EPS has grown 58.44%. Looking at the long-term chart, the market doesn’t seem to be rewarding NYCB for its turnaround.
The other 2 aspects I want to highlight are NYCB’s Net Loans and Total Deposits. Net Loans increased 9/10 years YoY while Total Deposits increased YoY over the past decade. This is important because NYCB’s business revolves around loan origination and generating returns from interest. NYCB needs these numbers to continue increasing to support future growth.
Steven Fiorillo, Seeking Alpha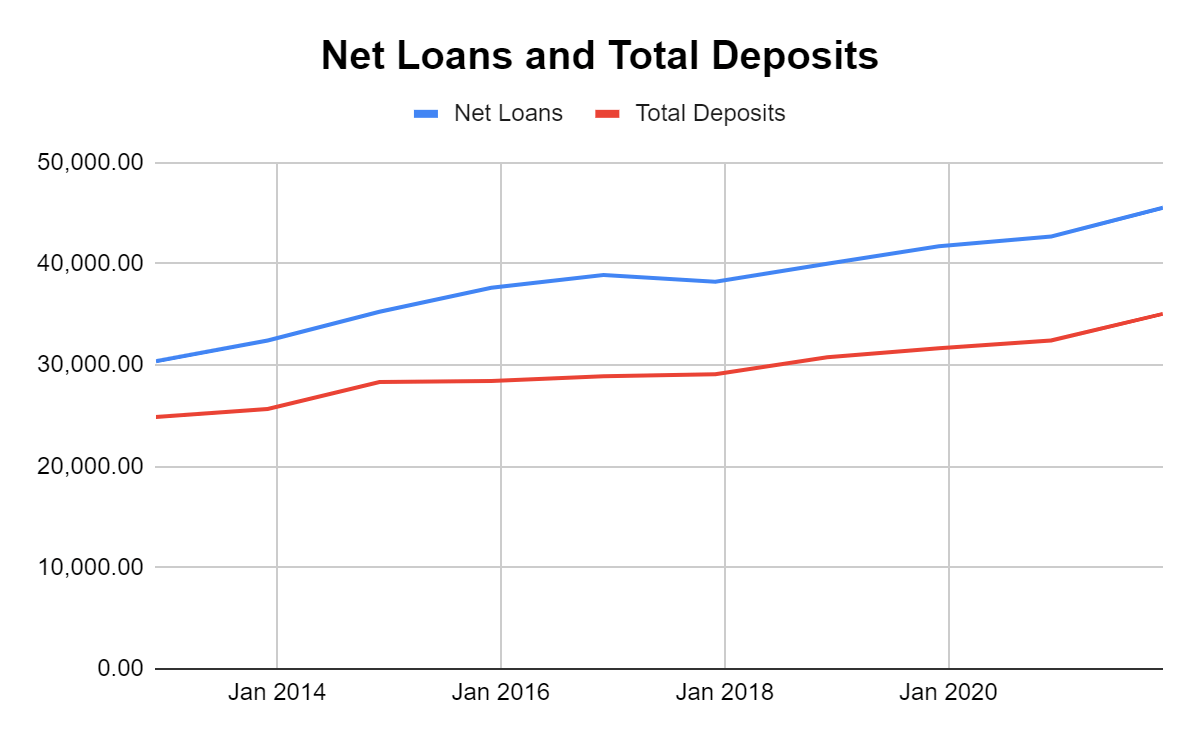
This makes me wonder what NYCB looks like compared to its peers from a valuation standpoint.
Comparing NYCB to its peers and looking to see if there is suppressed value in its shares
I will be comparing NYCB to the following companies:
TFSL, WSFS, and CLBK are considered Thrift banks and were some of NYCB’s largest competitors that were actual banks in the Thrift financial sector. Since there weren’t many comparable Thrift banks by market cap to NYCB, I added some of the well-known regional banks for this comparison. Similar to my other bank articles, I will look at the following metrics:
- Price to Earnings P/E
- A company’s P/E ratio is important in comparing with similar firms in the same industry.
- Price to Book P/B
- P/B ratios are commonly used to compare banks, because most assets and liabilities of banks are constantly valued at market values.
- Loan Deposit Ratio LDR
- indicates the banks liquidity.
- Equity to Market Cap
- Valuation the market has placed on the company’s equity
- Tangible book value to market cap
- tangible book value excludes the value of intangible assets such as goodwill. Intangible assets such as goodwill are not as easy to liquidate as tangible assets, and even though they have value, I believe finding the tangible book value is a more realistic measure of a company’s value. I wanted to see how the tangible book value compared to each company’s market cap
- Dividend Yield and Payout Ratios
- Amount of earnings each company pays per share through its dividend and how much of its earnings are paid
- % difference between tangible book value and share price
- Indicates if the market is discounting a company’s shares or placing a premium on them
- % difference between market cap and equity
- Indicates if the market is placing a positive multiple on a company’s equity of discounting it
NYCB is trading at the 2nd lowest P/E ratio of the peer group I constructed. NYCB current sits at a 7.48 P/E which is significantly lower than others in the group.
Steven Fiorillo, Seeking Alpha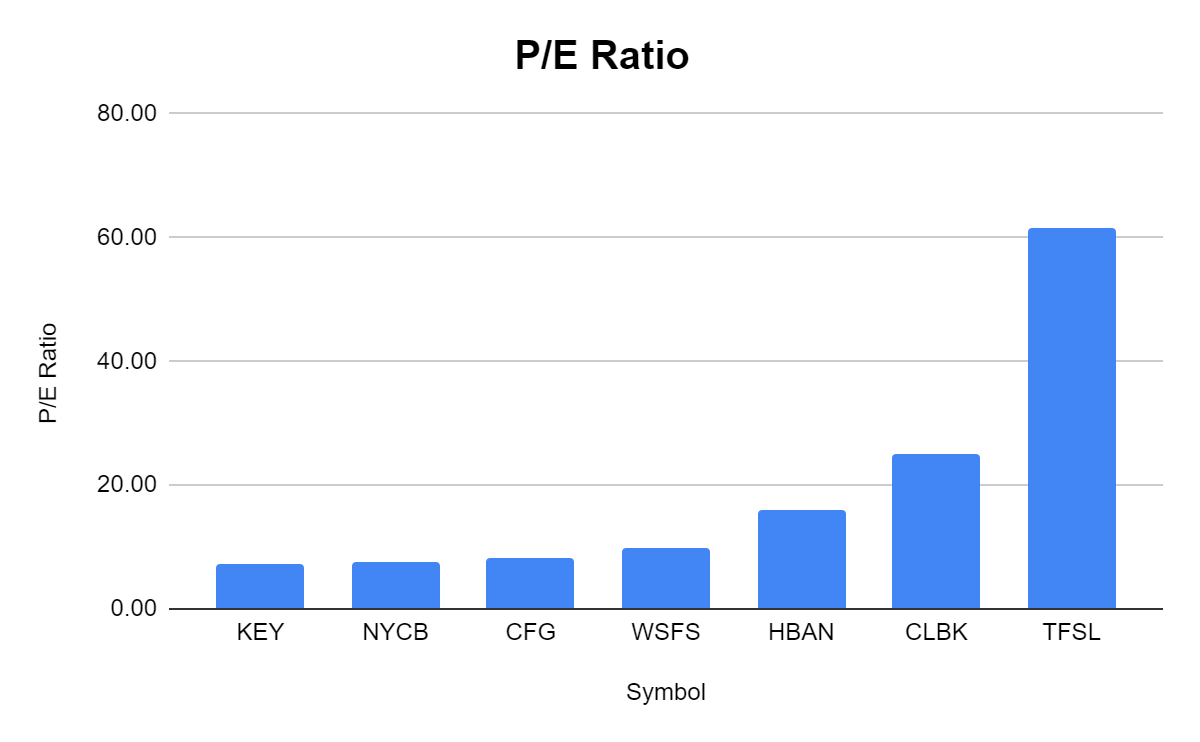
Next, NYCB has the lowest Price to Book Ratio of the group. NYCB’s share price is 66% of its book value indicating that its undervalued.
Steven Fiorillo, Seeking Alpha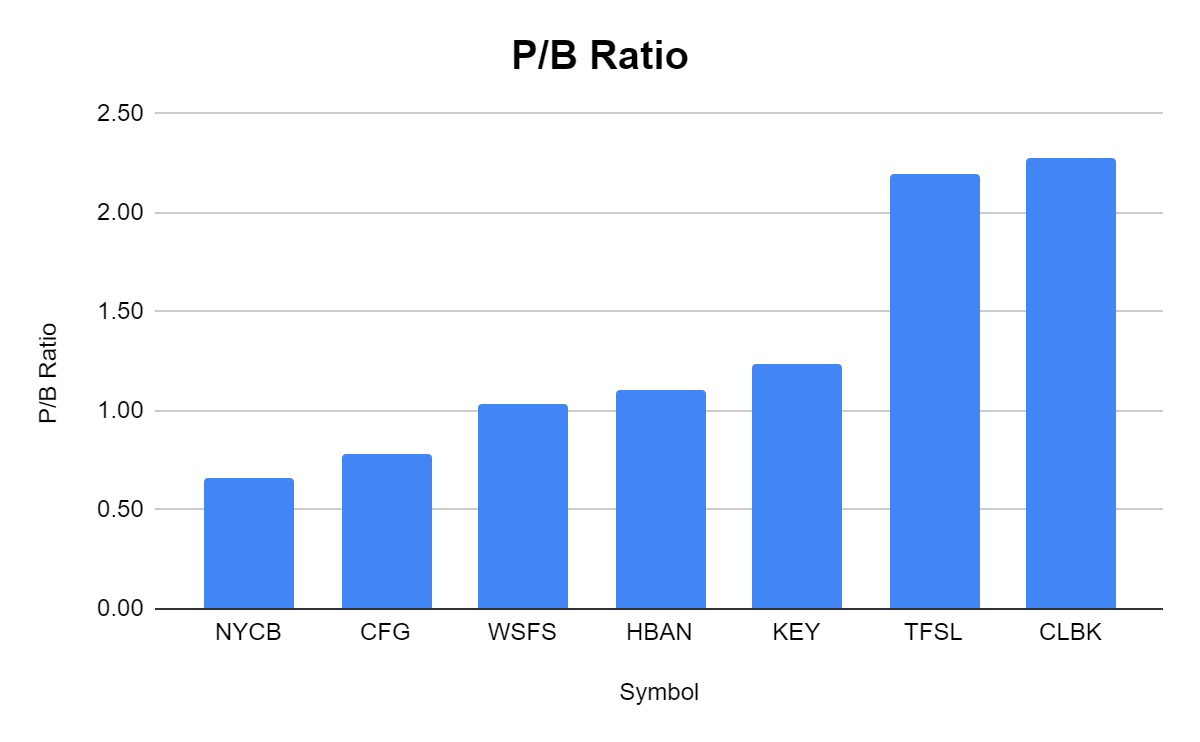
The LDR ratio is the one metric that doesn’t paint a great picture. NYCB is levered in this respect as it has a 1.23x loan to deposit ratio. Most of the banks I have looked at from national, regional, and thrift banks have a spread between deposits and loans.
Steven Fiorillo, Seeking Alpha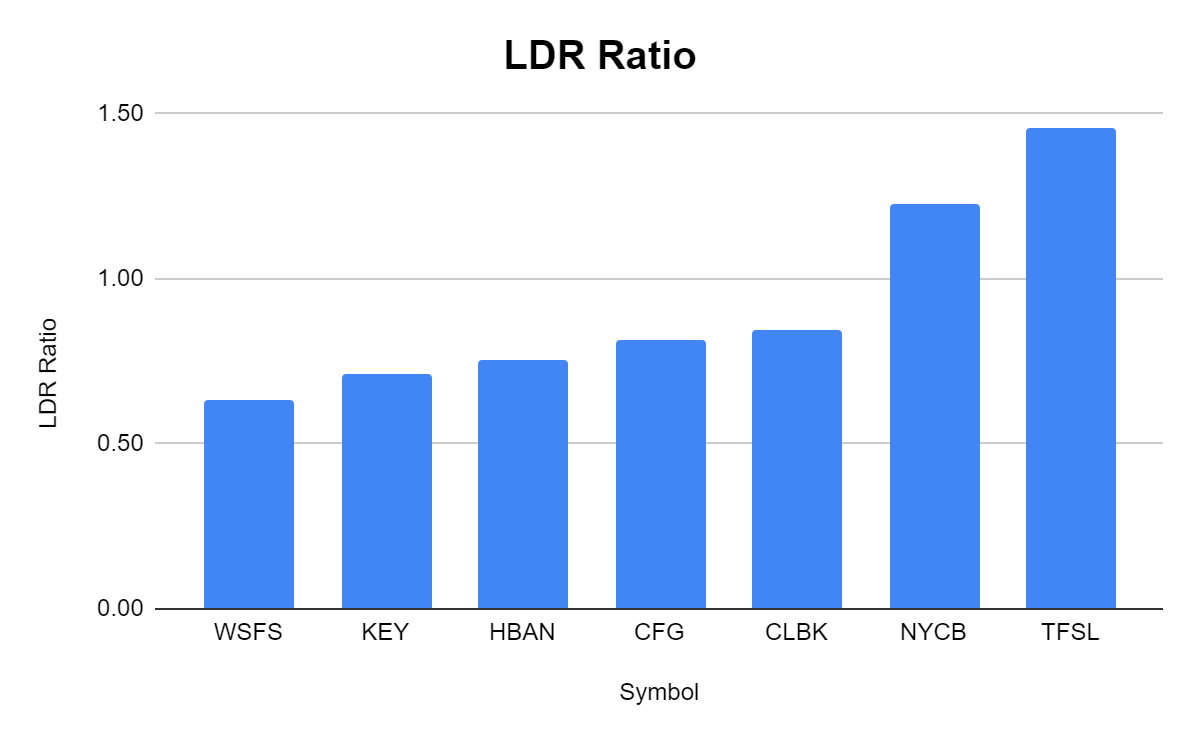
NYCB looks to be deeply discounted considering its equity. NYCB has 162.21% of its market cap in equity on its balance sheet. Of the 7 banks I selected, 4 of them trade at a premium to equity, while HBAN and CFG trade at slight discounts. NYCB is the outlier.
Steven Fiorillo, Seeking Alpha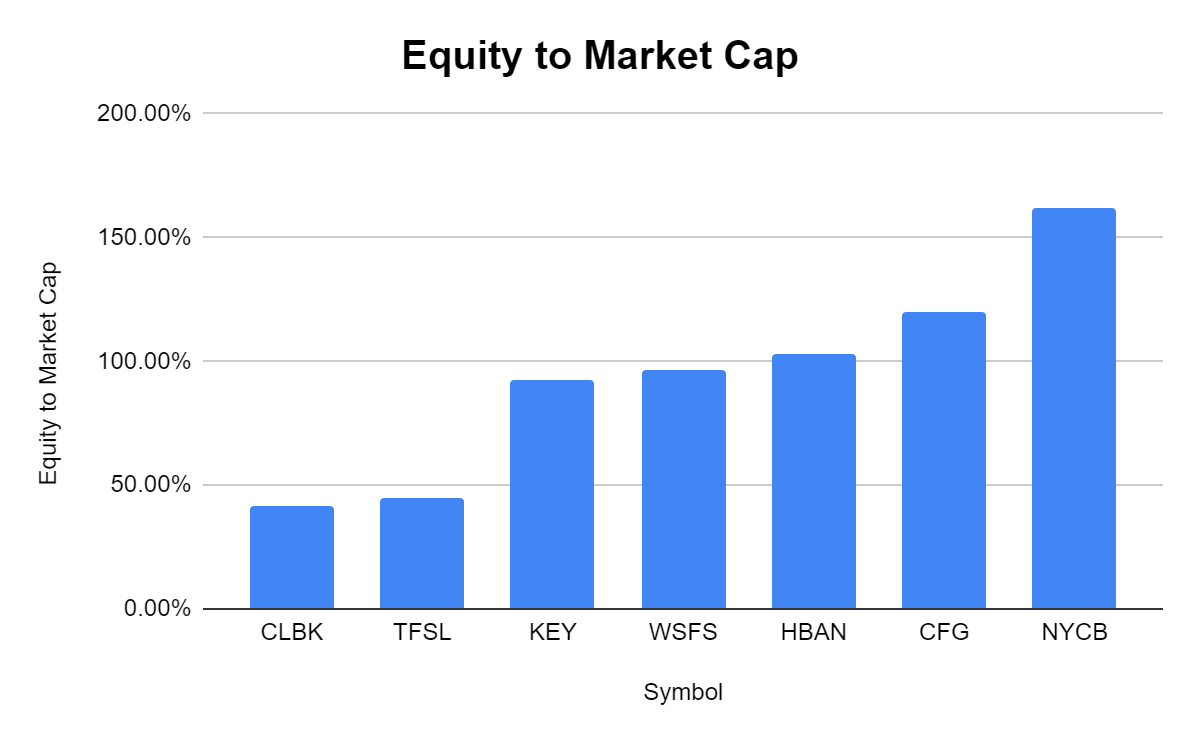
What could be the most interesting metric is the tangible book value to market cap. NYCB has 93.44% of its market cap in tangible book value on its balance sheet. This is 23.52% more than CFG, which has the 2nd largest ratio. Compared to its peer group NYCB is being deeply discounted, yet it has the largest amount of Tangible Book Value compared to its market cap.
Steven Fiorillo, Seeking Alpha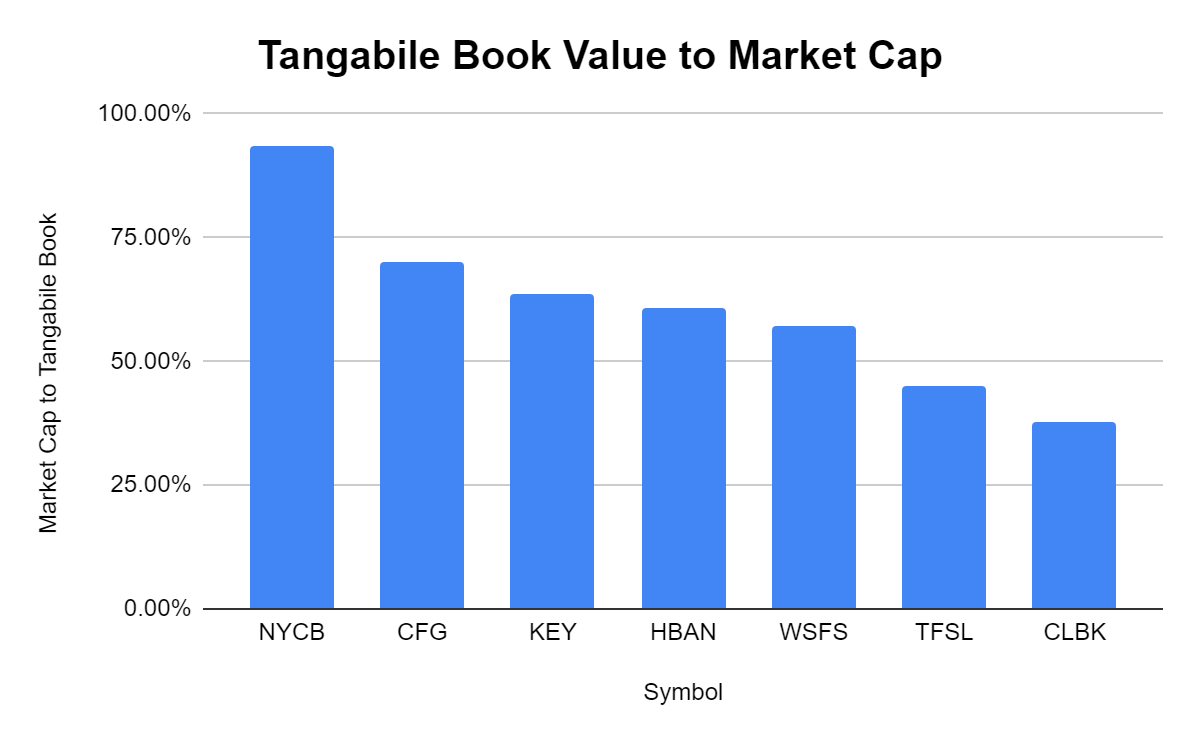
Looking at the dividends and seeing how NYCB’s stacks up
NYCB currently pays a $0.68 dividend per share which is a forward yield of 7.46%. Normally when companies have such a high dividend yield, red flags appear, and the first question becomes, is it supported? In NYCB’s case, the dividend yield isn’t too good to be true. NYCB has generated $1.22 in EPS over the TTM, which creates a 55.74% payout ratio. This is actually a very low payout ratio for a dividend that is yielding 7.46%. NYCB has more than enough room to start increasing its dividend if it chooses to do so. So how does NYCB stack up against its peer group?
From a dividend yield perspective, NYCB has the 2nd largest yield. HBAN, KEY, and WSFS are all in the 4-5% range, CLBK does not pay a dividend, and WSFS has a 1.29% yield. Only TFSL has a larger dividend than NYCB. At a 7.96% yield, it will be interesting to see its payout ratio compared to NYCB.
Steven Fiorillo, Seeking Alpha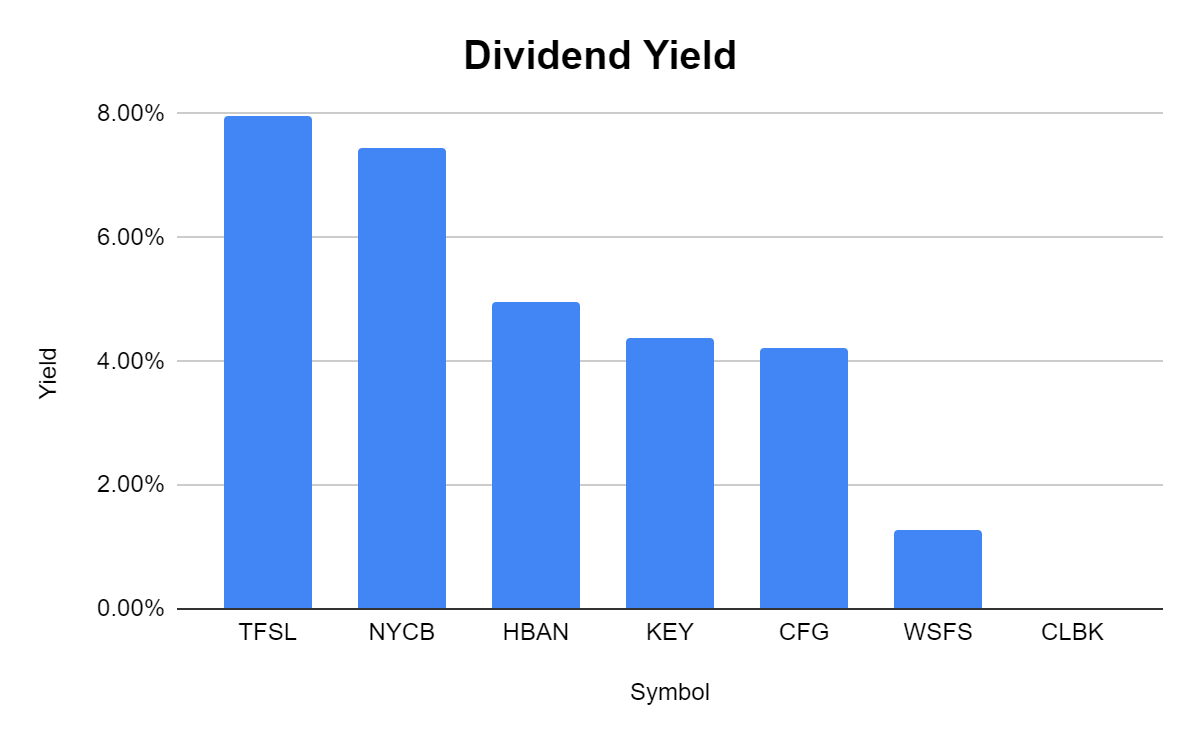
This is why looking at the payout ratio is critical. TFSL has a 7.96% yield while NYCB has a 7.46% yield, but these dividends are not on the same playing field. TFSL looks to have an unsustainable dividend yield as its payout ratio is 491.3%. TFSL only generates $0.23 in EPS, yet it pays out $1.13 per share. NYCB’s dividend looks remarkable on this metric as you can get a 7.46% yield with a 55.74% payout ratio where the EPS has been growing.
Steven Fiorillo, Seeking Alpha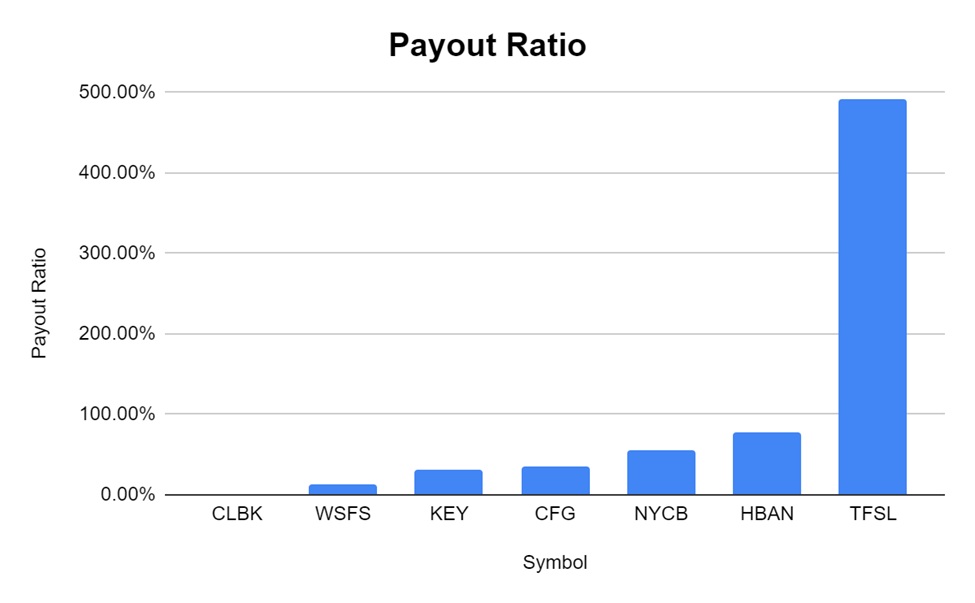
Conclusion
After looking through NYCB’s metrics, I am surprised that shares have sold off as much as they have and that they haven’t rebounded in lockstep with its financial growth. Except for the LDR ratio, everything about NYCB indicates it’s a screaming buy. Today you’re getting a 7.46% dividend that is fully covered with a lot of room for future increases. NYCB looks to be undervalued by 50.44% based on its book value per share, and from an equity perspective, NYCB is 62.21% undervalued from a 1:1 methodology to market cap. Looking at the tangible book value, NYCB has the best ratio to market cap out of the group and looks to be at least 23.52% undervalued compared to its next peer.
Overall, NYCB has been growing since its recent declines going into 2019, and in the TTM, NYCB looks to have had its best 12 months over the past decade from a profitability level. With rates rising, I think NYCB is a strong buy today as its yield is fully supported, and there should be significant upside potential in its future.
Be the first to comment