


Vertigo3d
Nexstar Media Group (NASDAQ:NXST) is a television broadcasting network that has been built on the back of acquisitions with a pretty good history of integrating their different assets. The company also owns national digital properties like News Nation, The Hill and Best Reviews and a minority stake of 31% in the Television Food Network that has been a consistent provider of cash distributions to the company.
In this article, I will try to address the main drivers of Nexstar Media performance and at the same time describe and substantiate what I consider to be conservative biased assumptions for each of those drivers to back up my thesis that Nexstar Media should be a solid addition to an investment portfolio.
Revenues
The company derives its revenue mainly from distribution of their TV signals from traditional cable & satellite (C&S) companies and from online video distributors (approximately 50% of total revenue), Local and National advertising (between 35% to 40% of total revenue), political adverting that represents between low single digits to low teens depending on the US election calendar and the rest is mainly digital advertising.
Considering the history of acquisitions, it’s hard to fully grasp the level of organic growth but for what can be derived from years without significant acquisitions you can see that the rate of growth has been very interesting for a company that is trading cheaply even for the standards of the industry.
But that revenue growth has been coming mainly from the increase of distribution rates to C&S companies on the back of two main levers. The first one is the strong negotiating position derived from the fact that the stations that it owns reach 68% of all television households in the US. And the second is the fact that their stations represent a higher percentage of the overall viewership of C&S companies than the percentage of the distributions fees that they receive represent of the whole pie. Those drivers should continue to be a positive influence on the growth of the company considering that most of their contracts are being renewed during the second half of this year and during 2023, but it’s ultimately a limited strategy considering the structural decline of the cable industry.
So, let’s tackle that issue first as it’s the most significant one at least from a strictly financial perspective. I will start by looking at the aggregated figures reported by Comcast (CMCSA), Charter Communications (CHTR) and DISH Network (DISH) (three of the main cable and satellite operators in the US) in terms of total clients and revenue specifically for this segment (Pay TV) and use that as a proxy for the industry.
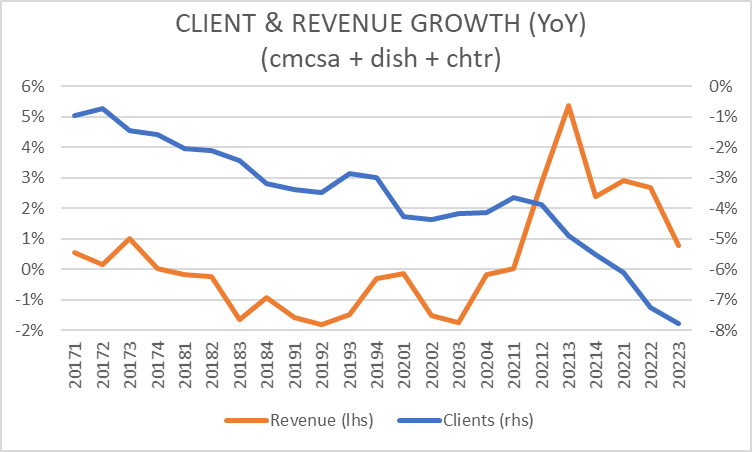
Comcast, Dish and Charter earning releases
Prior to the pandemic, the attrition rate of clients was accelerating up to a rate of 4% annually with revenues declining around 1% per year. But during the pandemic the industry increased prices significantly, at a rate of 9% or even 11% during some quarters, resulting in a significant increase of the attrition rate to levels closer to 8% per year. And this is the part of the equation that in my opinion most significantly influence the low multiples at which Nexstar Media trades.
So, let’s run some numbers to understand what this means for the company in the context of their significant negotiating position. The company has stated that according to them their industry represents around 40% of the overall viewership of cable and satellite audiences but only receives a little bit under 30% of the distribution fees paid by the industry. ¿Will they be able to fully close that gap? I don’t think so, because on the other side are content providers that while representing lower percentage of overall viewership, provide highly valued content like sport events or expensive productions like Game of Thrones.
I like to be reasonably conservative in my assumptions, so I would use a 2% annual decrease in revenues for the industry and will assume that the company manage to close that gap from 30% to 35% in the next 10 years to derive a growth rate for this portion of their revenues starting on the third quarter of 2023 and assume a 3% growth for the next three quarters as some negotiations are already baked in.
With that, I get to a growth rate of -0.4% on 3Q23 that lineally declines to -0.6% in 4Q32. To be clear this is a much lower growth rate that the one the company talks about. In fact, you can hear Tom Carter, President & COO of Nexstar talking about mid-teens growth in 2023 and a little lower than that in 2024 at the Credit Suisse Communications Conference. In the last earnings conference, management was less bullish as they recognized the accelerating level of attrition in the cable industry but did not provide specific growth rates.
But as an exercise let’s assume they manage to close the gap to 35% of the fees in 5 years to reach a less conservative growth rate. Under those assumptions the growth would start at 1.1% on 3Q23 and would lineally decrease to 0.74% on 4Q27 and from there it would align with the 2% annual reduction that I am assuming for the Cable/Satellite industry.
In the end, sooner or later 50% of their revenues will perform on the secularly decreasing fashion of the industry from which those are derived. Apart from that, there are the streamers or what they call Online Video Distributors (OVDs) and that is a bit of a black box. In some of their earning calls they have mentioned that they are receiving distribution revenue from OVDs, in particular, they have mentioned Paramount and Peacock but I have not seen any information regarding what specific percentage of the overall distribution revenue comes from OVDs.
Management recently participated in the last Stephens Investment Conference and confirmed the assertion of the analyst interviewing them that pointed to that source being less than 10% of their distribution revenue. So as a conservative guess I would assume that 5% of the overall distribution revenue its coming from streaming service providers and I would assume a 5% growth for the next 10 years for that portion. And with that, the revenue growth for Distribution starting on 3Q23 improves to -0.15% and stays basically stable by ending at -0.16% on Q432.
Now we can move to core advertisement, and as you can see in the next chart, there seems to be very little if any organic growth in the periods between acquisitions (Media General in 1Q17 and Tribune Media in 4Q19). Apart from that, traditional broadcasting is losing market share to digital alternatives on a secular basis, and we are in the middle of a strong correction in advertising expenditures as the economy decelerates. In fact, they saw core advertising revenue lower by 8% on a YoY basis in 3Q22. So, I am assuming the same reduction for the next three quarters and then 6% YoY recovery for four quarters. From there on (3Q24), zero % growth.
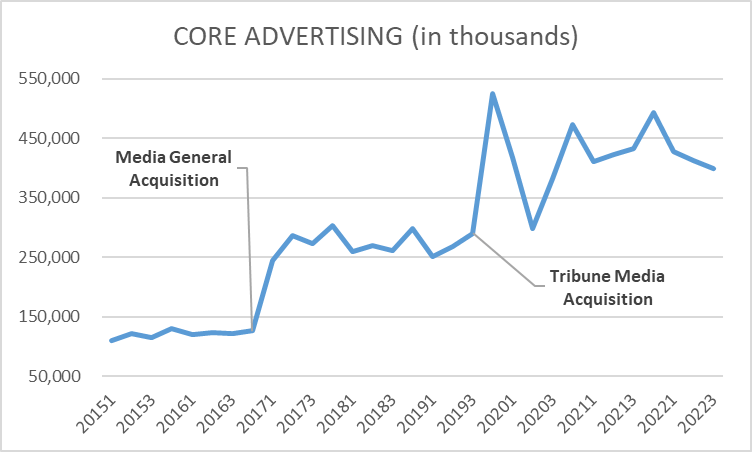
NXST financial statements
After that we come to Political advertising where Nexstar has shown that they have a very successful franchise as their ability to target local markets for specific elections is probably among the best in the country. So, I am assuming a 2% growth for 4Q22 vs 4Q20 as they pointed in the last earning call that they have already surpassed the political revenue at the election date vs 2020. After that I am assuming a 14.75% (3.5% annualized growth) growth vs the previous comparable cycle. So as an example, for the 2024 election year the 14.75% growth is applied to the 2020 political advertising revenues. And if you look at the previous 3 election cycles in the next chart, even accounting for the acquisitions they have grown much more than that. As an example, let’s take the first 3 quarters of 2018 and compare them with the first 3 quarters of 2022 accounting for the reach expansion obtained through the Tribune Media Acquisition. That acquisition expanded their national reach from 38.8% of the Television Households to 68% a 75% increase. During that period NXST reached $111 million in political advertising revenue which would be $194 million when adjusting for the added reach. And during this year’s first three quarters political advertising revenue has been $239 million a 23% growth vs the acquisition adjusted 2018 political advertising revenue.
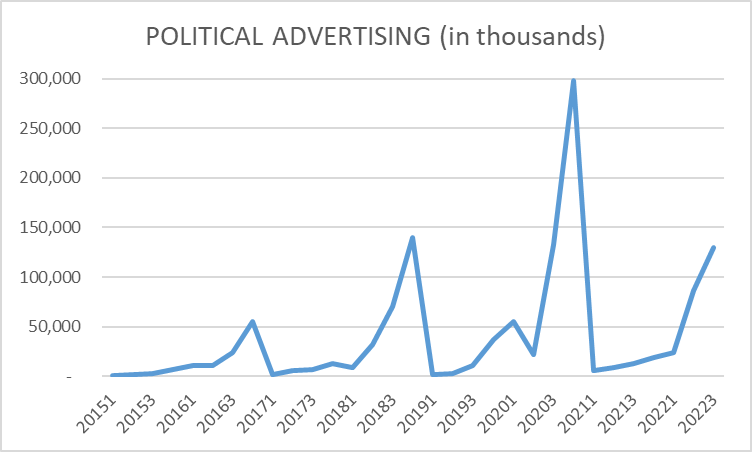
NXST financial statements
Finally, we come to Digital Revenue and Trade & Other. For digital revenue I am assuming a 3% annual growth for the next 10 years and for Trade & Other to stay flat as has been the case for the last 5 years.
With all that long explanation of what I consider to be conservative assumptions for the different components of revenue I get an overall average annual revenue growth of 0.7% for the next ten years.
Margins
I start with EBITDA (EBIT + Impairments + Depreciation & Amort) margin that has been improving at a consistent but moderate rate mainly for two reasons. The first one is their improved negotiating position with their counterparts in the pay tv industry but also with their counterparts in the network industry regarding their affiliation agreements that are periodically renewed. And the second one is their ability to significantly reduce fixed costs in the markets where they operate a duopoly, meaning they operate two stations for the same market.
I will assume a 38% percent margin for all non-election quarters and a 45% margin for the 4th quarter of election years. I think those are reasonably conservative, especially for the election quarters.
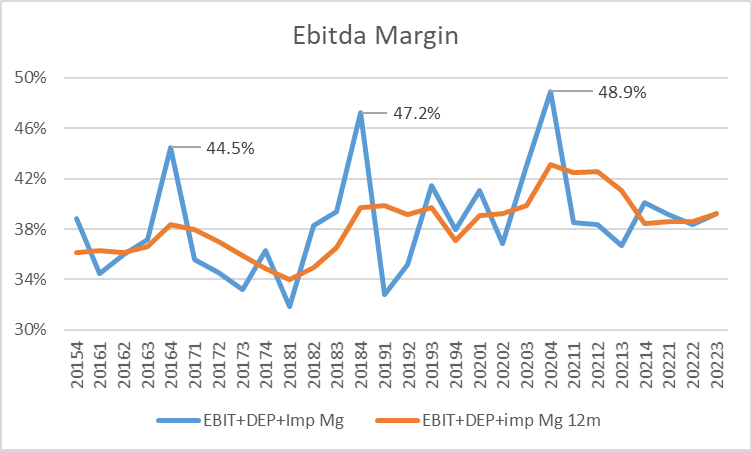
NXST financial statements
The CW Network Acquisition
The CW Network was created during the 2000s as a 50/50 joint venture between at the time CBS and Warner Brothers and for what I could find out was never run to turn a profit at the network level but was used as an engine of content creation that was then further monetized by both CBS and Warner Brothers. But more than 10 years later, in this new environment of streaming, it was a somewhat odd arrangement for two companies that are directly competing with their own streaming platforms (Warner Brothers Discovery and Paramount Global).
Nexstar Media acquired 75% of the Network for no consideration which seems a little odd even considering that the Network is losing money and the owners were eager to get out of the arrangement. So, at first, I thought that they might be taking on some material amount of debt, but that should have been disclosed by the company and it wasn’t. I tried to search around for some information and the only tidbits that I found were from the last 10-Q of Warner Bros. Discovery (WBD)…
WBD 3Q22 10-Q
…and the last 10-Q of Paramount Global (PARA).

PARA 3Q22 10-Q
Apparently, Nexstar Media is just taking on the cost of running the network and taking on some receivables and the sellers are taking with them certain licensing rights existing prior to the sale. That does not seem like a bad deal especially considering that Nexstar stations are the largest affiliates of the Network. Today The CW Network is poorly rated as its content is intended for a young audience, but the average age of their viewers is 58 years. And there again is a sign that the current owners did not care about the performance of the network beyond their ability to create content for them to monetize, but for Nexstar any improvement in ratings will positively impact the results of their affiliated stations.
The company has stated that they expect to turn the Network into profitability by 2025 and their track record with acquisitions point me to take them on their word. They expect to fund cash loses until that period in what they say it’s a “low 9 figures total amount”. Also, they expect the cash outlays to be heavily weighted to the first year as they need to fund the network’s programming for the 2022-2023 season and only after that period, they can run the show as they see fit. And that is exactly what they are doing as you can see by the number of cancelled shows (13) plus another three scheduled for their final season as they intend to move the balance of the network to more unscripted content, lower cost programming and in general content more aligned with their current viewership.
In the last earning call the CFO pointed to -$70 million of ebitda and a low 8 figures number in charges probably related to severance payment as the company has been changing the management of the network, so $100 million in cash impact for 4Q23. After that I assume the same $70 million of cash outflows until the end of the 22-23 season then for the 23-24 season (4Q23 to 3Q24) half of that amount and finally for the 24-25 season $15 million of quarterly cash outlays reaching breakeven by Q425. All in all, that is a total investment of $510 million starting in 4Q23 and ending in 3Q25, and at least on my book that looks more like a “mid-9 figure number” than “a low 9 figure number” so again I am erring on the conservative side.
And after that I am assuming ZERO cash inflow in perpetuity as I don’t want the investment case to be based on a cash source that does not exist today, but I would agree with critics that probably this assumption is pessimistic rather than just conservative.
Free Cash Flow to the Firm Valuation
Normally I don’t like to decide an investment based only on the calculations of a FCF exercise, but when faced with a stock that its trading cheap in absolute terms, and also in relative terms to its industry and its own history I think it’s a good way to check the likelihood of it being a value trap if you consciously use conservative assumptions.
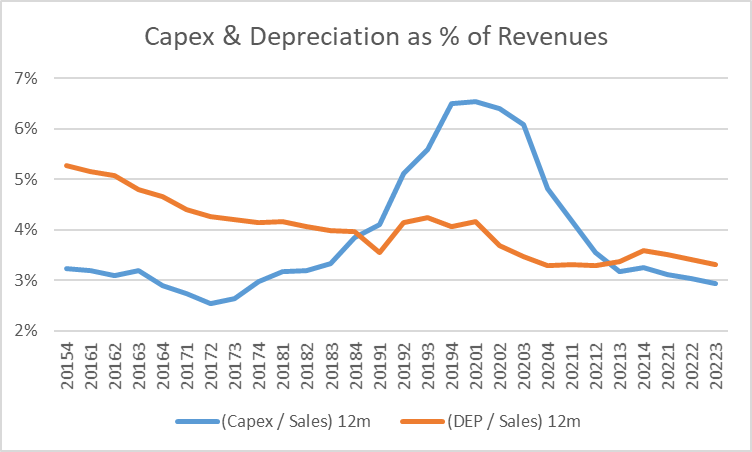
To get to the FCF to the firm I deduct from EBITDA (reached using the previously detailed revenue and margin assumptions) the amortization of broadcast rights and intangibles at the average level of the past year ($27 million and $77 million per quarter respectively) and quarterly depreciation calculated as a 3.3% of revenues. Specifically for the Amortization of Intangibles it is difficult to square the quarterly amortized amount with the reported Intangible asset considering the sequence of smaller acquisitions during the last couple of years. But looking at the current rate of depletion of that account in the quarters without the influence of acquisitions, the asset account should run out in 5 and a half years, so I am stopping the $77 million quarterly amortization after 1Q28. Finally, I would subtract the previously detailed cash outlays relating to the acquisition of The CW Network to reach earnings before interests.
To get to after-tax EBIT I am assuming a stable tax rate of 21% and then I add back both amortization amounts and depreciation and then I deduct the Capex that is assumed at the same rate of depreciation (3.3% of revenues) which is consistent with recent history.
NXST financial statements
And finally, I would add as a cash inflow the $155 million expected after-tax payment related to the sale of a 30-acre site in Chicago that apparently would be used by Bally’s to build $1.74 billion casino.
Before addressing the discount rate, I would first address the Net Debt figure that I will use to subtract from the NPV. Obviously, I will consider current and noncurrent financial debt net of cash, but I will also include the Other Noncurrent Liabilities account net of Operating lease liabilities that basically includes the net unfunded status of its pension plan – for a total Net debt of $7,060 million.
The WACC its always tricky but let’s try to do a standard exercise to see what we get with values consistent with Friday’s 18th of November market close.
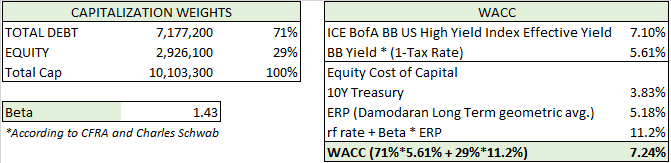
author’s calculation
By just sticking that rate I get a fair value per-share (using weighted diluted shares outstanding) of 353 implying a ridiculous level of upside of 107%. The problem here is that the implicit exit multiple of the perpetuity by using that rate is 13.8 times FCF, an excessive multiple for the industry. But even changing the perpetuity for a more reasonable 9 times FCF I get to a fair value of 260 implying a 53% of upside.
Anyway, I would encourage the reader to forget about those juicy upsides, those are just exercises to check that we are not getting onto something that might be considered a value trap.
But there is a final version of this exercise that is the one I like the most, and it relates to the rate at which the net present value goes to zero and, in this case, its 11.09% at the closing price of 171. That rate implies an exit multiple of 9.02 times FCF which I deem to be reasonable.
Interest Rate Risk
By using free cash flow to the firm I addressed the higher cost of debt through the discount rate, but in the short term the company it is facing higher cash outflows from the perspective of the shareholder as roughly 60% of their debt pays a floating rate. And since 2Q21 their annualized quarterly cost of debt has increased by almost 50% of the jump observed in the quarterly average 3-month treasury rate.
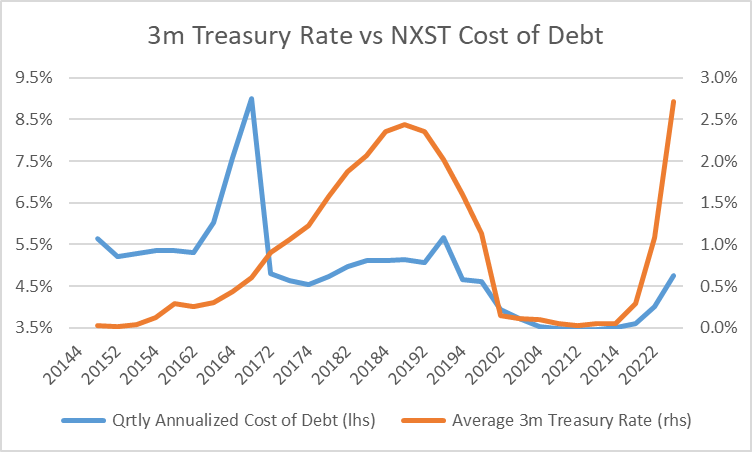
FRED and NXST financial statements
Looking forward the Federal Reserve is expected to increase its target rate to a range between 4.75 to 5%, so I will assume that the 3m treasury rate reach a peak of 5%. Under that scenario and assuming the same 50% passthrough, their annualized cost of debt should peak at 5.9% vs 4.3% for the last 12 months, implying a $120 million increase in interest expense vs the last 12-month period under the current gross financial debt load of $7.18 billion.
Trailing 12 months FCF adjusted for movements in working capital came at $1,424 million a 21% FCF Yield. By starting at that level and subtracting the expected increased interest expense ($120 million) and the cash outlays related to The CW Network for the next 12 months ($310 million and the peak in cash outlays relating to the acquisition) and then adding back the after-tax inflow from the property sale ($155 million) we get to a proforma FCF of $1,149 million, representing a still very attractive FCF Yield of 17%.
Conclusion
It was a conscious decision to use conservative assumption and despite that I got to an investment case that should provide an 11% annual return with some clear upside from three drivers. The first and most obvious of all for a management with an excellent track record of integrating acquisitions, is turning the CW Network into a cash source either directly or indirectly through the impact of improved ratings on their affiliated stations and/or a lower amount of investments for the integration phase than the $510 million that I assumed. Secondly, it’s that the strength of Nexstar’s political advertising franchise that will likely translate into higher revenue growth and higher margins than the ones I used as assumptions. And finally, it’s the new broadcasting standard ATSC 3.0 that is starting to be implemented. I won’t get that deep into it, but I would encourage you to hear the comments by Tom Carter at the Stephens investment conference webcast that I had linked above. There, starting at the 39-minute mark he addresses the revenue potential of the technology or, you could read the following linked article that describe the findings of BIA Advisory Services that Mr. Carter mentioned a few times in his comments pointing towards the same potential.
All in all, I think that NXST offers a respectable 11% annual return based on a set of conservative assumptions with some clear drivers of potential upside and with a relative low risk of material surprises to the downside, making it a pretty decent addition to a portfolio of investments.
And just to finalize, it is important for me to point out that I am not married to this view, and I welcome any constructive criticism and new information that may help me improve my understanding of the company.
Thanks for reading and good luck with your investments!
Be the first to comment