

naisupakit
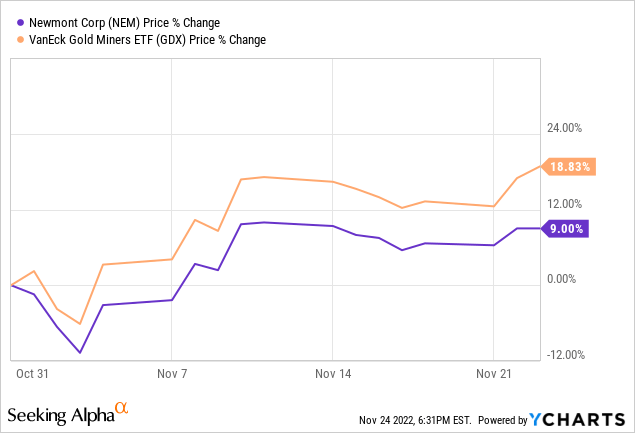
Newmont (NYSE:NEM) reported Q3 results on November 1 and the market reaction left little to the imagination. Newmont is trailing peers (GDX) by almost 10% as a result.
Metal production of 1.5M ounces of gold (plus additional 300K ounces in by-products) was in line with expectations, and Newmont remains on track to achieve its production guidance for the year. However, production targets were not the market’s main focus this earning season. To quote a recent Haywood research note:
[…] strong operational momentum and capital discipline proved to be key drivers this reporting cycle, while producers who reported increased cash costs, higher inflation induced capex guidance, and otherwise missed estimates, showed weakness following earnings.
And this leads right to the heart of Newmont’s problem in the eye of the market: costs. And that includes costs at capital programs, as well as production costs. So let’s look at these two items in more detail.
Capital Costs
Here are two quotes from the Q3 earnings release to set the scene. The first one relates to the Tanami expansion:
Total capital costs are expected to be approximately 25% above the prior estimate, incorporating the significant impacts from Covid-related restrictions and protocols and the current market conditions for labor and materials.
And the second one relates to the Ahafo North project:
Total capital costs are expected to be approximately 15% above the prior estimate, incorporating the cost associated with delayed land access.
Both projects are not only affected by cost inflation, but also by delays pushing back the dates for commercial production. Both expansion projects were originally scheduled to enter commercial production in early 2024, but this milestone has been pushed back to early 2025 at Tanami; and mid-2025 at Ahafo North.
Acknowledging the challenges with regard to cost inflation and project scheduling, the company has delayed an investment decision for the Yanacocha sulfide expansion to late 2024, and it is taking a very cautious approach to other growth projects within its portfolio. The suspension of capital spending at Yanacocha has allowed the company to reign in development capex spending but by the same token, this decision along with the mentioned delays will have a noticeable impact on the longer-term production outlook for which an update is scheduled for February 23, 2023.
Production Costs
Here are a couple of charts from our database to illustrate the steady increase of all-in-sustaining costs, or AISC, reported by Newmont in recent years. The first chart shows consolidated AISC and gold production. The step-change at the start of this year is clearly visible for the red line illustrating AISC.
Gold production and AISC (company filings and author’s database)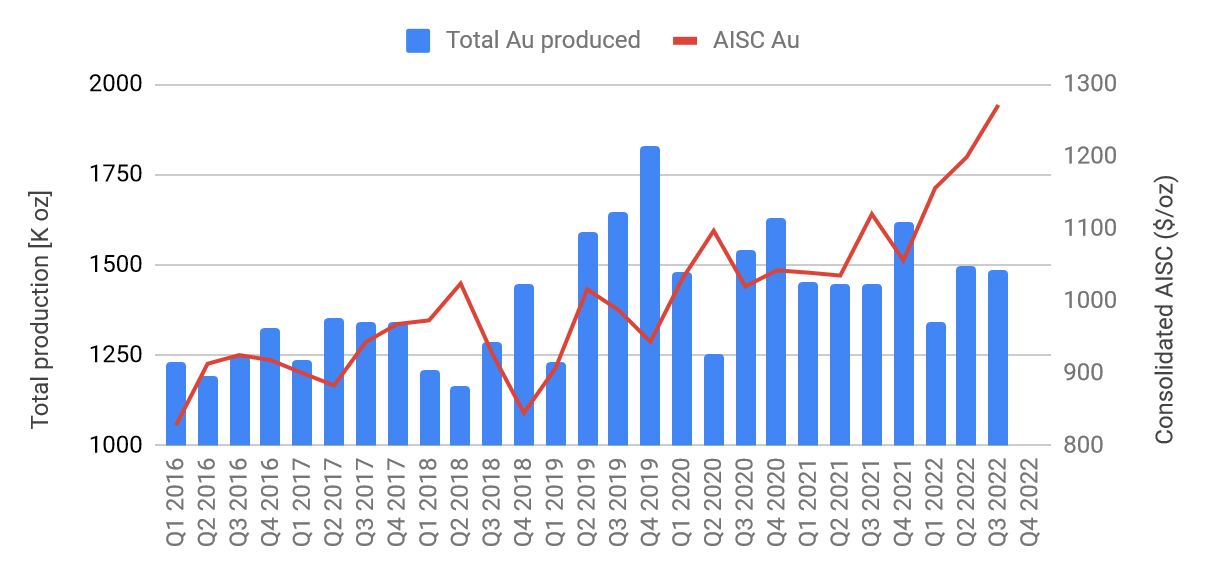
Some assets have been more affected than others, but unfortunately for Newmont (and its JV partner Barrick Gold (GOLD)) the Nevada assets stand out in terms of cost increase. To add insult to injury, and amplify the cost problem in Nevada, production numbers have also flagged this year (blue bars show production of Newmont’s Nevada assets prior to the formation of Nevada Gold mines, the mentioned JV with Barrick Gold).
Nevada operations (company filings and author’s database)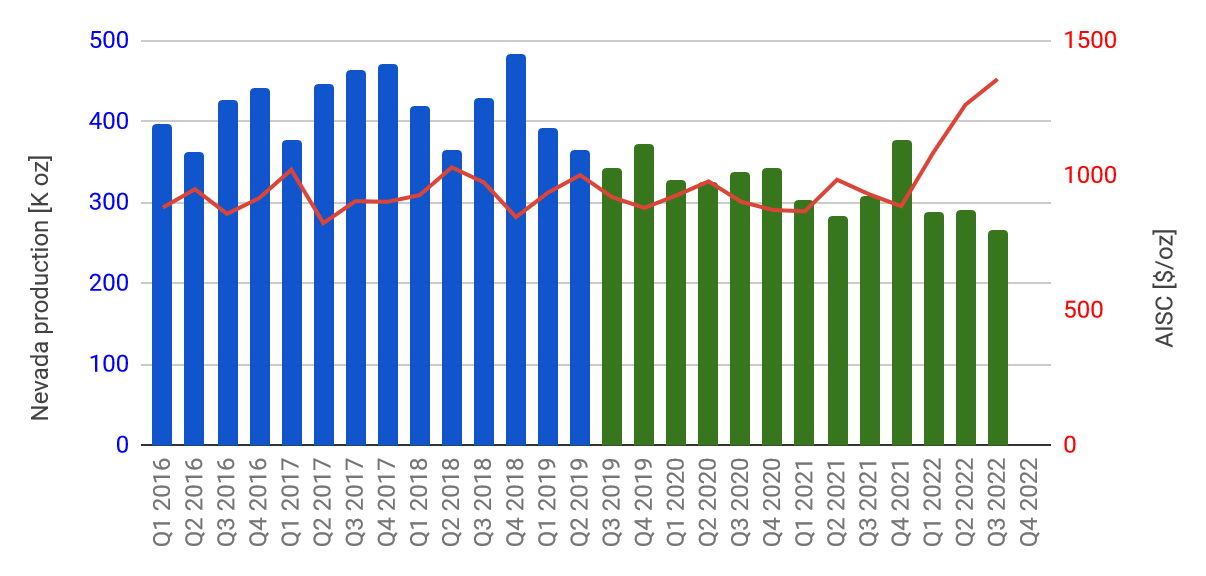
In very general terms, Newmont’s mines in Australia and Africa have fared better than the North- and South American assets within the portfolio, but overall the increase in consolidated all-in-sustaining costs has been pronounced, jumping almost 30% from post-Goldcorp-merger levels in 2021 to the numbers reported for Q3 — quite contrary to the promised cost-reductions due to merger-related synergies.
Newmont blamed the usual suspects for this cost increase during the earnings call: “[…] higher direct operating costs as a result of inflationary pressures, driven by higher labor costs and an increase in commodity input costs, including higher fuel and energy costs.” Plenty of peers are experiencing similar cost pressures and use similar wordings in their reports; and the market is paying very close attention to how well each gold miner manages these challenges.
Financials
The mentioned cost increase in combination with a weakening gold price has put significant pressure on Newmont’s margins. The company is currently generating similar cash per ounce as it was back in early 2019, despite a gold price increase of $~500/oz during this period of time. The yellow bars in the chart below illustrate the margin squeeze.
Margins (company filings and author’s database)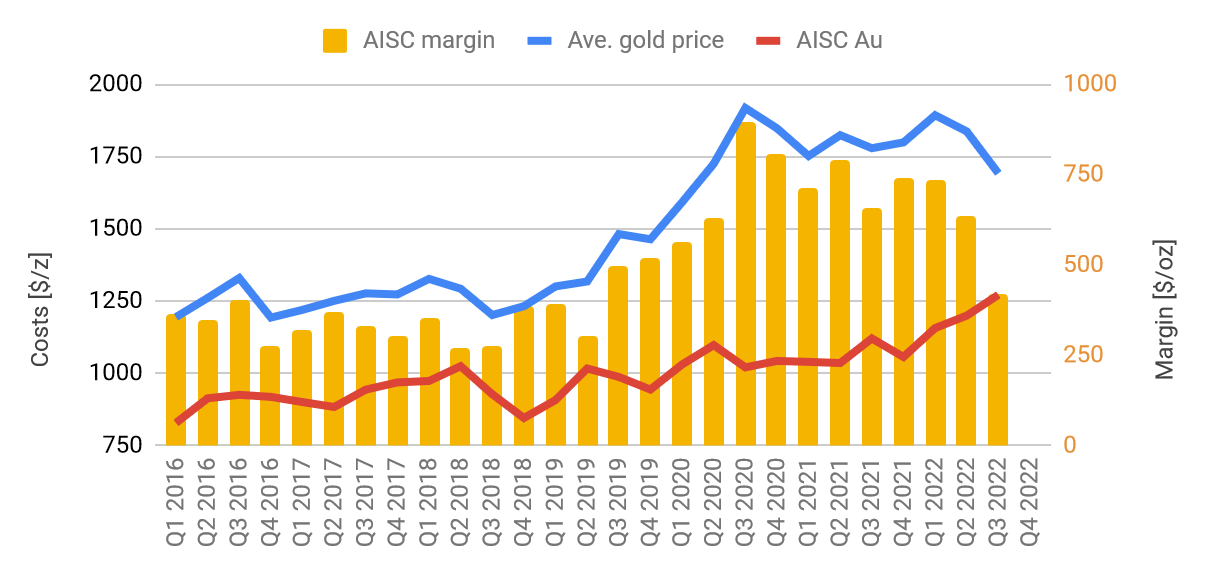
Free cash flow suffered as a result of the shrinking margins, and dropped into negative territory for the first time since Q2/2019 (blue line in the chart below). And when we netted out growth capital to calculate “sustaining FCF” shown in red in the chart below, the resulting number turned positive, but not by much.
Free cash flow (company filings and author’s database)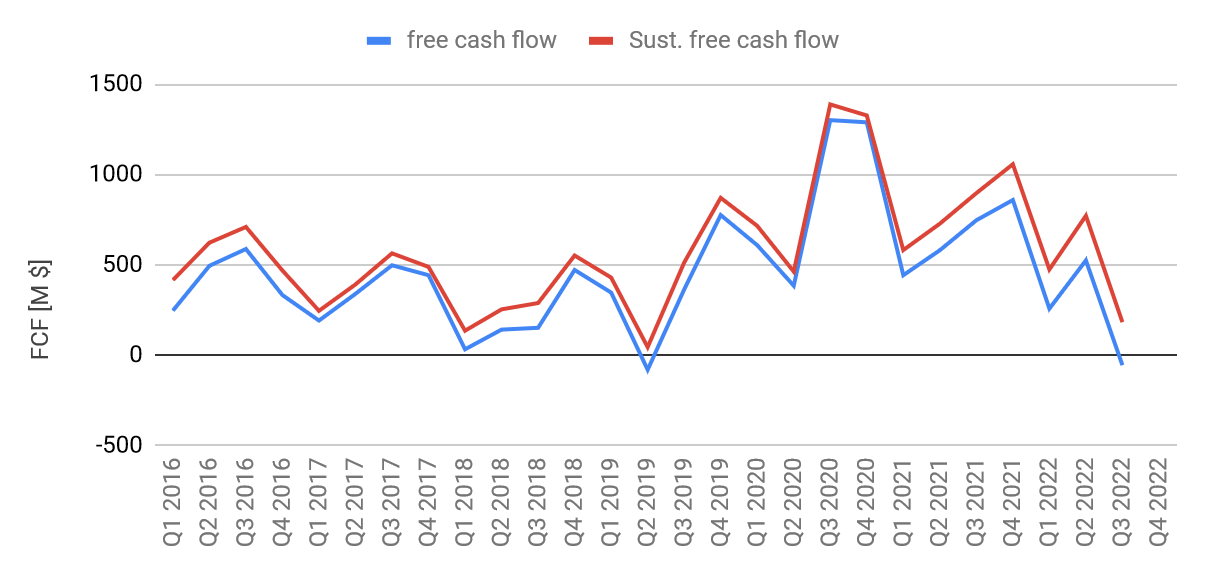
The balance sheet has improved significantly since the Goldcorp merger and remains in good shape. There is no current debt, and in fact, no mandatory debt repayments are due before 2027. At the end of Q3 the company had $6.7B in liquidity at its disposal.
Balance sheet (company filings and author’s database)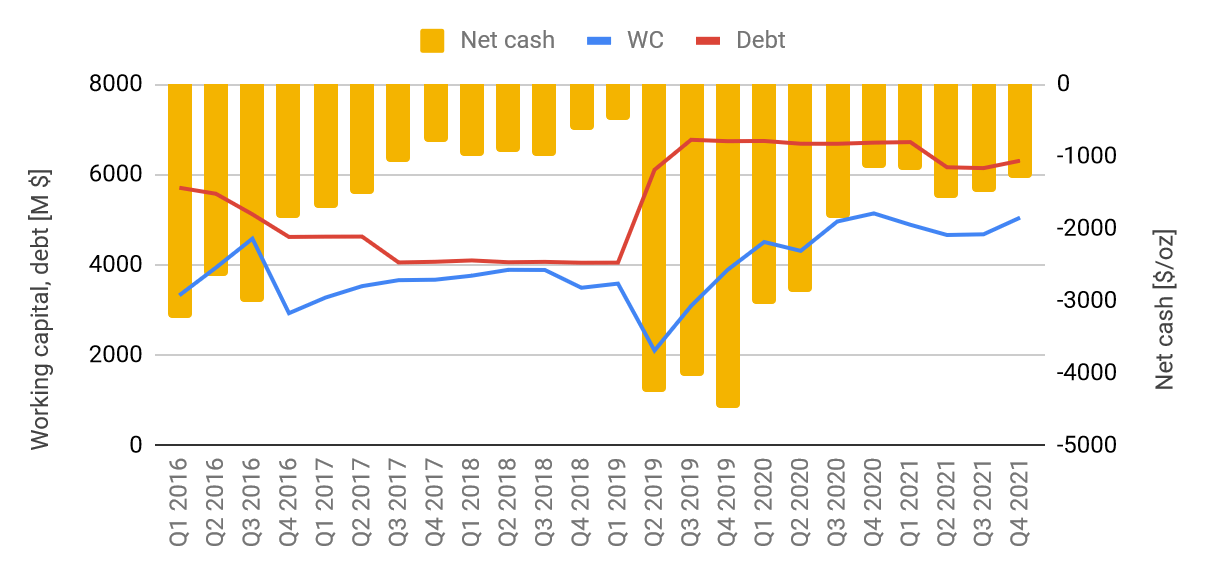
Summary & Investment Thesis
The market clearly was not happy with Newmont’s third quarter, apparently focusing on the company’s rising production costs. This topic was addressed in the earnings call and several cost control measures were discussed in detail. Management seemed adamant that guidance will be achieved, stating:
We remain on track to achieve our full year guidance ranges as we build momentum for strong production in the fourth quarter.
If this comes true, then Newmont is going to enjoy an above-average Q4 in terms of gold production, which will already go a long way toward improving costs. Further cost-cutting will depend mostly on the Nevada operations, and there is reason to believe that costs have peaked at the Nevada mines, at least for the time being. With these expectations in mind, we submit that Newmont should be able to reverse the gap between itself and its peers shown in the very first chart of this post come Q4 earnings season – i.e. February 2023.
Until then the main share price driver will be the gold price; and on this front, we are tentatively optimistic in the short term.
We are currently not ready to buy Newmont as a long-term holding, but we see an opportunity for a short-term trade to benefit from a comparatively strong fourth quarter and a postulated gold price rally into Christmas.
Be the first to comment