

Chip Somodevilla
I don’t know about you, but I’m tired of listening to mainstream journalists’ subjective opinions on inflation. The U.S. inflation rate settled at 7.7% in October, leading many to believe a change in the interest rate cycle might be en route. November’s inflation numbers are due December 13th. Thus, we took it upon ourselves to forecast inflation with R Programming to add to market transparency. Additionally, we assessed inflationary pockets and provided an anecdotal yet, objective takeaway.
I hope you enjoy the article, and I look forward to potential debates.
Time Series Forecasting Inflation
Forecasting inflation is best executed with time-dependent regression models, otherwise known as time series forecasting. According to academic literature, inflation most effectively described by utilizing a single-factor autoregressive model, which leverages past price level patterns to determine future price levels. Some analysts utilize multifactor models that consider variables like employment rates, Fed Funds rate, and PMI, among many others. However, our experience tells us that a single-factor autoregressive model yields the best results as multifactor models often lead to overfitting, thus, providing bogus forecasts.
We tested various multifactor and single-factor models and discovered superior results with a single-factor model. In addition, we applied artificial neural networks to our forecast, which allowed us to sort and cleanse the data more effectively.
Please keep in mind that our model’s output should be considered as an indicator instead of a settled law, as it’s merely a prediction.
Our Results
Firstly, let’s look at our tested horizon. We fitted the model with monthly data since 2014. LSTMs work best whenever the input variables’ frequency matches the desired output variable’s frequency. Utilizing the data, we trained the model and forecasted for two months ahead (November and December).
Data From Gurufocus; Author in R Programming (The Factor Investing Hub)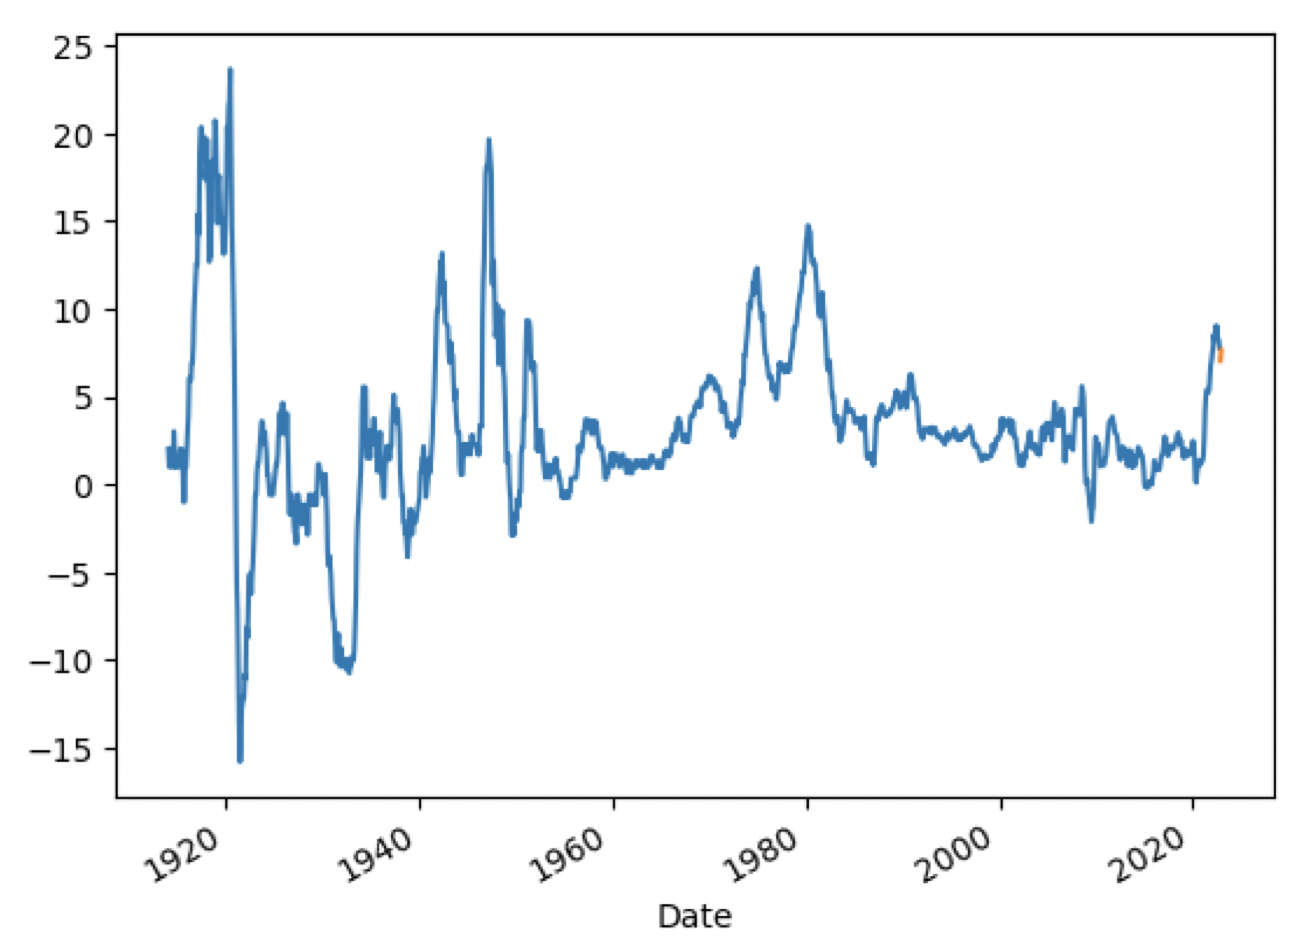
The chart below is an illustration of our cross-validation. Cross-validation is a back-testing process that forecasts retrospectively and matches results with actual output.
Data from Gurufocus; Author in R Programming (The Factor Investing Hub)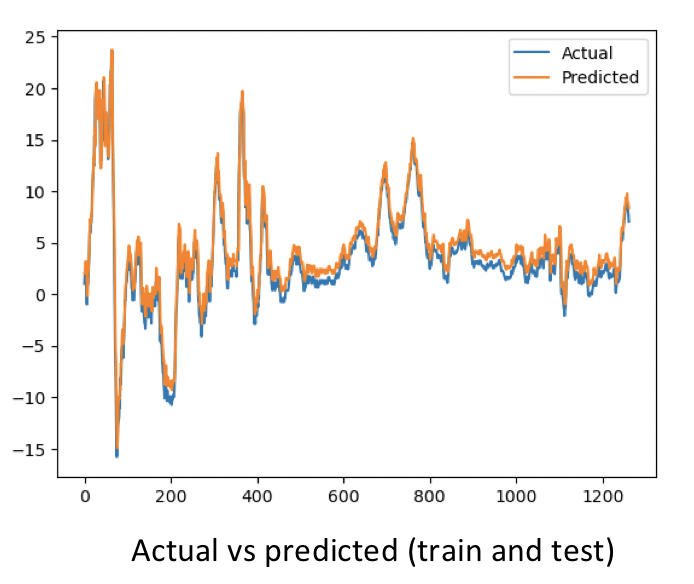
The table below illustrates our testing results. The adjusted R-Squared conveys the influencing variable’s capacity to explain the output variable’s distribution. An R-Squared of 0.971 is considered sublime; therefore, we had confidence in forecasting inflation.
Data from Gurufocus; Author in R Programming (The Factor Investing Hub)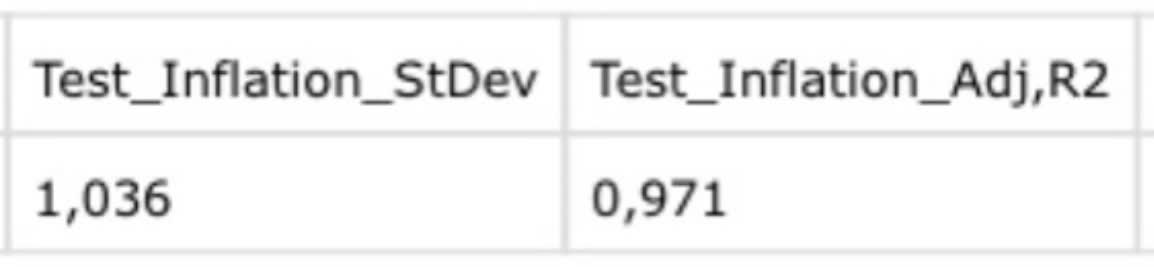
We followed our back-testing process and forecasted inflation for November and December. According to our model, inflation could settle at 7.06% in November and 7.66% in December.
Our model generated a p-value of 0.25, which isn’t ideal as a p-value below 0.10 is usually required to reject the null hypothesis. However, given inflation’s current volatility, we believe our results to be reasonable.
Data From Gurufocus; Author in R Programming (The Factor Investing Hub)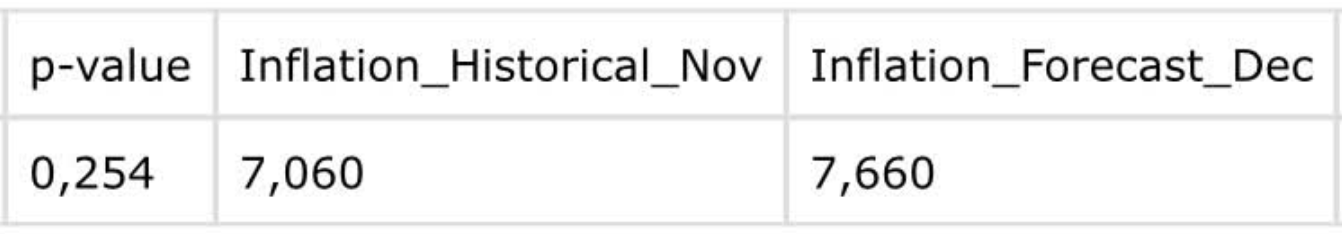
Discussing Anomalies & Pockets
Anomalies
Our intuition tells us that the forecasted tapering of November’s inflation could simply be due to a followed-up downward trajectory from October’s results.
We believe our December results could be due to a seasonal anomaly, primarily driven by consumers’ tendency to spend excessively during the festive season. In addition, possible misreads on inflation tapering could lead to more stale interest rate policies, subsequently catching policymakers and consumers off guard.
Pockets
When I say pockets, I’m referring to segmental inflation. CPI is a parsimonious number, but price level growth discrepancies between baskets of goods are far and wide apart at the moment.
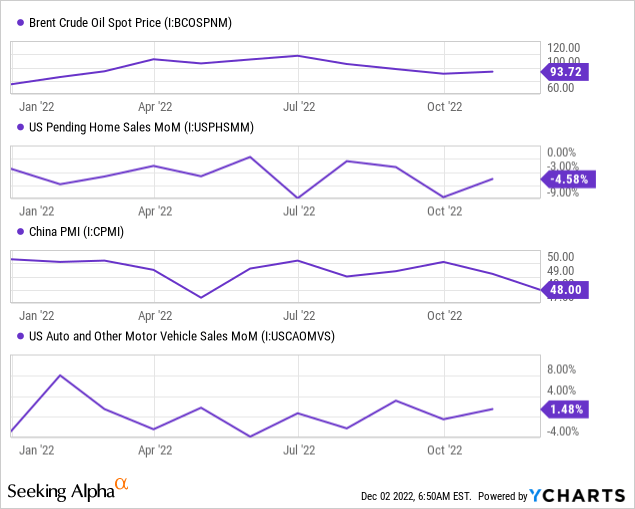
First, we experienced a drop in oil and gas prices in November, which could’ve calmed non-core inflation. In addition, caps on energy prices, such as the $60 cap in Europe, could taper prices leading forward.
Furthermore, pending home sales have rebounded slightly, suggesting stronger broad-based demand for November in the real estate space. However, a 4.1% drop in recent week-over-week railroad traffic suggests broad-based durable goods sales might not be as healthy as many think.
A worrisome aspect is China’s receding PMI. China is crucial to the global supply chain, and the nation’s persistent lockdowns could fuel supply-side inflation.
Lastly, auto sales have advanced recently, which could be a key consideration for future interest rates policy.
Why We Might Be Wrong
As previously mentioned, our forecast is based on a single-factor model, meaning it ignores the finer details. The current inflationary environment is volatile; therefore, forecasting inflation is a difficult task.
Furthermore, interest rate policies take time to yield an effect on the economy, and recent policy shifts have been radical, meaning inflation rate predictability is an arduous task.
Lastly, various idiosyncratic events are unfolding. Pandemic lockdowns in China, the war in Ukraine, and an energy shortage in the EU have coalesced to formulate an unstable economic environment, leading to forecasting difficulties.
Concluding Thoughts
Our LSTM neural network model suggests that November’s inflation rate could find calm. However, December’s inflation number could settle higher again. Moreover, evidence indicates that non-core inflation could be brought down by receding energy prices. Moreover, core inflation could also soften amid declining railway traffic.
Concerns about supply-side inflation persist amid continuous pandemic lockdowns in China and the ongoing war in Ukraine. On top of that, a seasonal spending animal could drive inflation up in December.
Be the first to comment