

Adrian Vidal
New York Community Bancorp (NYSE:NYCB) has gotten crushed in 2022 as it started the year trading at $12.42. During the market correction, NYCB reached a low of $8.50, declining -31.56% over the first half of 2022. Since its lows, NYCB has climbed 26.71%, gaining $2.27 per share, and now trades at $10.77, which is still off its 2022 starting point by -13.29%. Over the past month, NYCB has continued its rally by 17.7% as they delivered a top and bottom line beat on Q2 earnings. NYCB delivered $377 million of revenue, an increase of 8.6% YoY and a beat of $23.4 million while generating $0.35 in non-GAAP EPS, a beat of $0.03. Since my first article on NYCB, it’s appreciated by 18.48%, and when the dividend is added, the total return is 20.47% compared to 11.89% for the S&P. I am revisiting NYCB to see if it still looks attractive after the recent run or if shares are more in-line with its peer group.
Seeking Alpha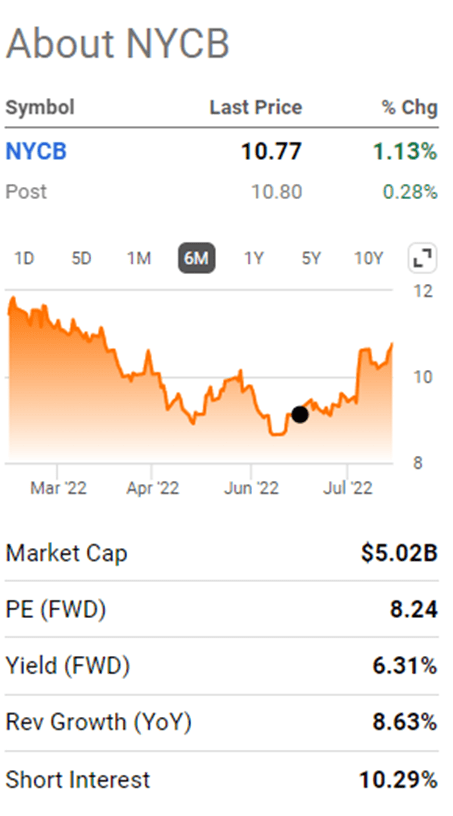
New York Community Bancorp’s numbers continue to improve
Looking back at NYCB’s 2015 numbers, I can see why shares declined. 2015 was the only year in the previous decade where NYCB generated less than $1 billion in revenue and produced negative net income and EPS. 2015 looks like it was a horrible year for NYCB as it lost -$47.2 million and produced -$0.11 in EPS. It’s no secret that NYCB went through years of adversity which ultimately led to its large dividend being reduced. After the treacherous 2015, NYCB’s business rebounded in 2016, then fell into a downward spiral for several years. From 2016-2019, NYCB’s revenue declined by -27.63%, from $1.43 billion to $1.03 billion, net income declined by -20.27%, from $495.4 million to $395 million, and EPS fell by -23.76%, from $1.01 to $0.77 per share.
Steven Fiorillo, Seeking Alpha Steven Fiorillo, Seeking Alpha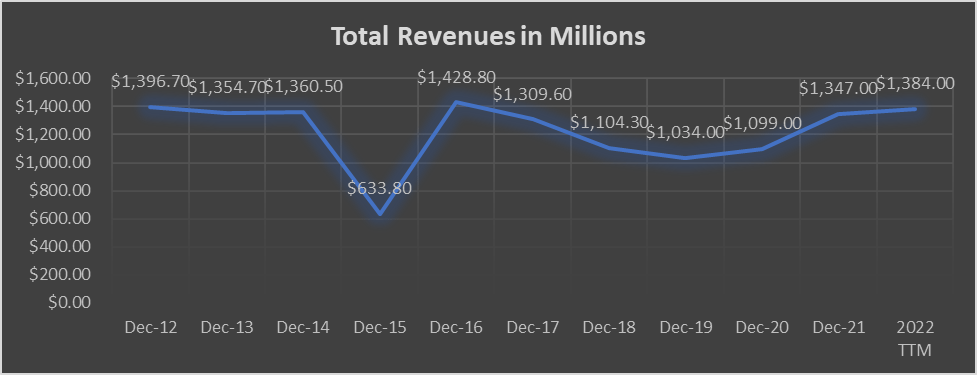
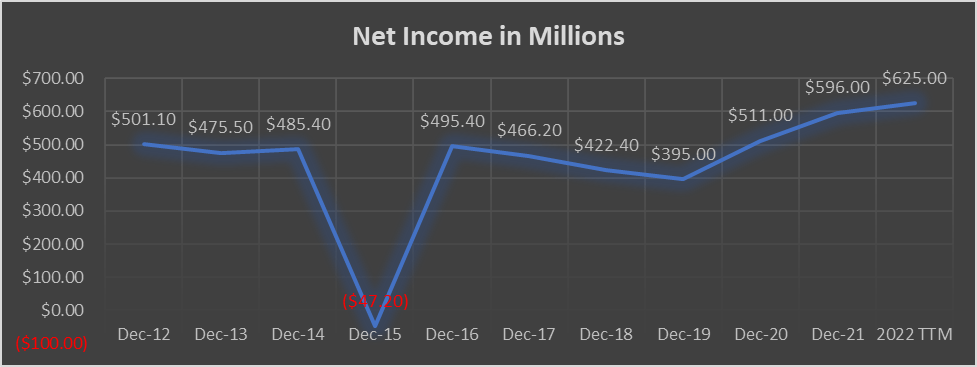
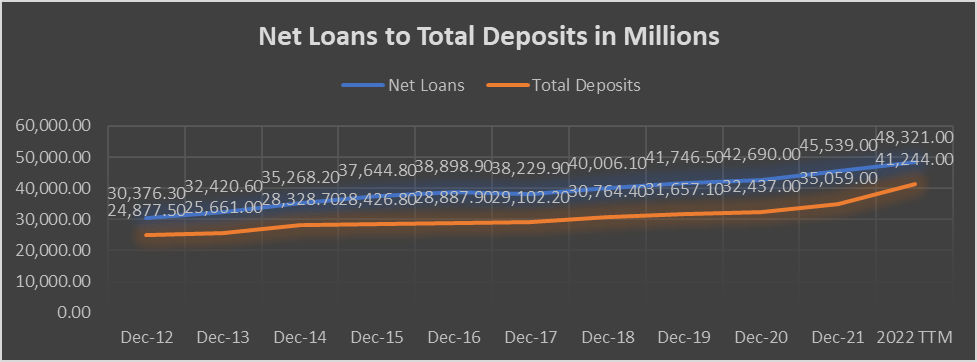
While NYCB hit a major rough patch, Q2 earnings were released, and it indicated that NYCB is still progressing. From the close of 2020, revenue has increased by $285 million (25.93%), net income increased by $114 million (22.31%), and its EPS increased by $0.24 (23.53%). Looking at the Trailing Twelve Months (TTM) compared to 2021, revenue is up $37 million (2.75%), net income is up $29 million (4.87%), and EPS is up $0.06 (5%). NYCB has also grown its deposits sequentially YoY since 2012 and its loans YoY since 2017. The loan portion is critical because, in a rising rate environment, banks tend to do well.
As a thrift banking institution, NYCB has the ability to borrow money at a lower rate of interest from Federal Home Loan Banks. While their main lines of business are savings and originating mortgages, thrifts also offer standard banking products such as checking, personal & car loans, and credit cards. Since 2020, NYCB has increased its loans by $5.63 billion (12.19%) and YoY by $2.78 billion (6.11%). Larger cumulative loan originations should continue to drive revenue, which should ultimately drive net income growth and EPS growth.
Steven Fiorillo, Seeking Alpha Steven Fiorillo, Seeking Alpha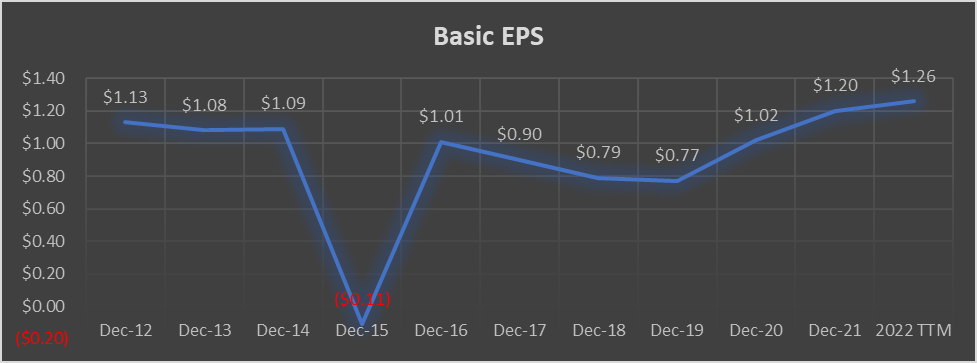
Even though shares of NYCB have appreciated by 26.71%, gaining $2.27 per share since their lows, I want to see how they compare to the peer group I created.
I will be comparing NYCB to the following companies:
- TFS Financial Corporation (TFSL)
- WSFS Financial Corporation (WSFS)
- Columbia Financial (CLBK)
- Huntington Bancshares Incorporated (HBAN)
- Citizens Financial Group (CFG)
- KeyCorp (KEY)
TFSL, WSFS, and CLBK are considered thrift banks and were some of NYCB’s largest competitors that were actual banks in the thrift financial sector. Since there weren’t many comparable thrift banks by market cap to NYCB, I added some of the well-known regional banks for this comparison. Similar to my other bank articles, I will look at the following metrics:
- Price to Earnings P/E
- A company’s P/E ratio is important in comparing with similar firms in the same industry.
- Price to Book P/B
- P/B ratios are commonly used to compare banks, because most assets and liabilities of banks are constantly valued at market values.
- Loan Deposit Ratio LDR
- indicates the bank’s liquidity.
- Equity to Market Cap
- Valuation the market has placed on the company’s equity
- Tangible book value to market cap
- tangible book value excludes the value of intangible assets such as goodwill. Intangible assets such as goodwill are not as easy to liquidate as tangible assets, and even though they have value, I believe finding the tangible book value is a more realistic measure of a company’s value. I wanted to see how the tangible book value compared to each company’s market cap.
- Dividend Yield and Payout Ratios
- Amount of earnings each company pays per share through its dividend and how much of its earnings are paid
- % difference between tangible book value and share price
- Indicates if the market is placing a positive multiple on a company’s equity of discounting it
- Premium to Book
- Premium to Tangible Book Value
- Discount to Tangible Book Value
NYCB is trading at the lowest P/E ratio of its peer group. The group’s average P/E is 18.92 and NYCB is trading at a P/E of 8.22.
Steven Fiorillo, Seeking Alpha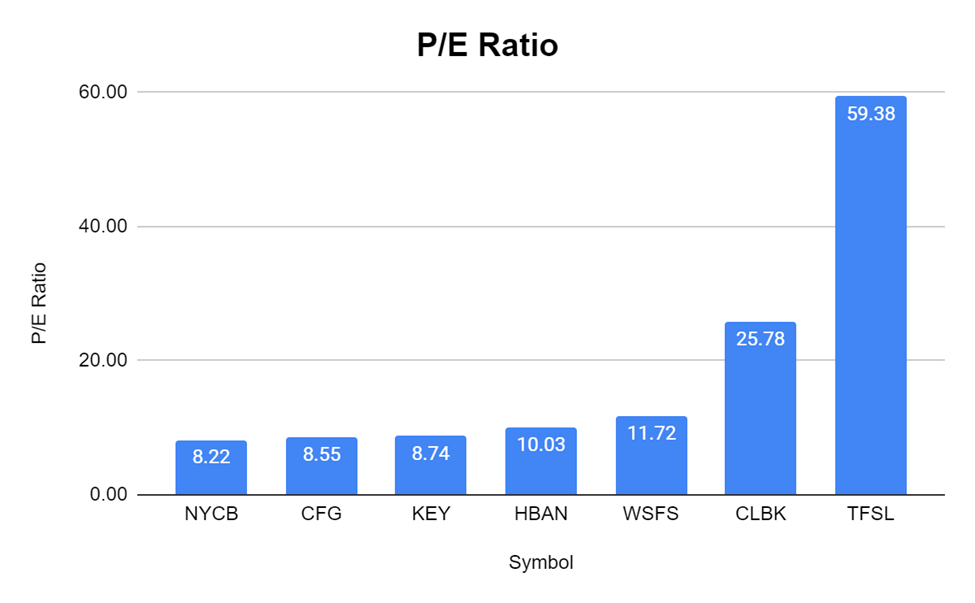
NYCB has the lowest P/B ratio at 0.79x, while the group average is 1.5x. This is a clear indication that the market is still undervaluing NYCB.
Steven Fiorillo, Seeking Alpha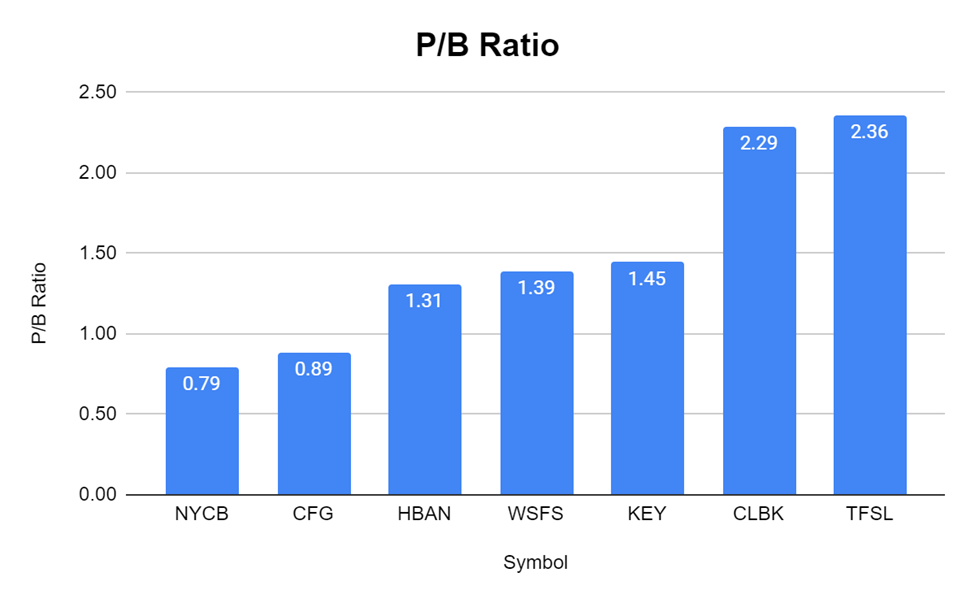
NYCB’s LDR ratio still doesn’t paint a great picture. NYCB is levered in this respect as it has a 1.17x loan to deposit ratio. While this is slightly lower than the 1.23x ratio last quarter, it’s still too high, in my opinion. Most of the banks I have looked at from national, regional, and thrift banks have a spread between deposits and loans.
Steven Fiorillo, Seeking Alpha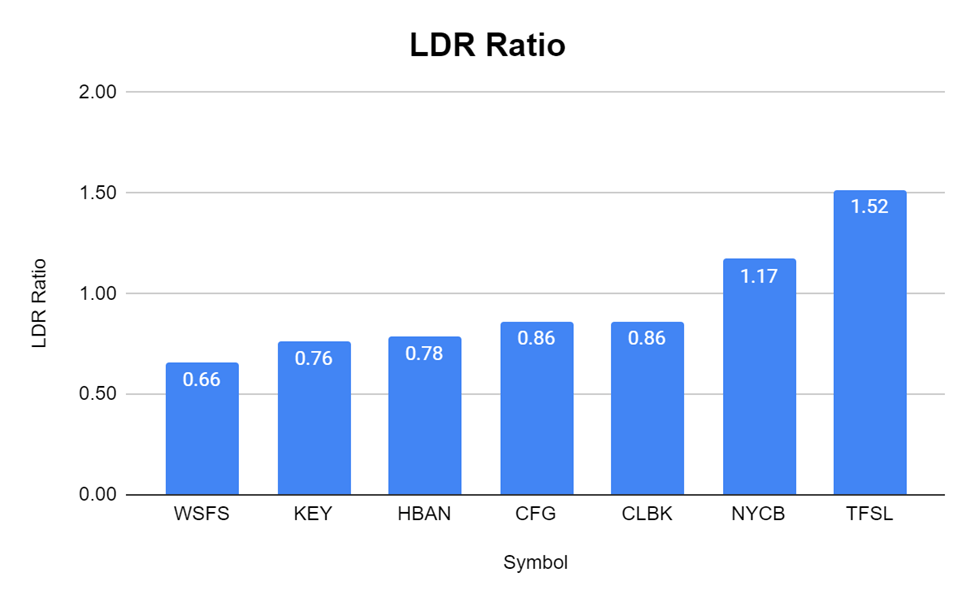
NYCB still looks like it’s trading at a discount considering its equity. NYCB has 152% of its market cap in equity on its balance sheet. Of the 7 banks I selected, 5 of them trade at a premium to equity, while CFG and NYCB trade at discounts that exceed 20%.
Steven Fiorillo, Seeking Alpha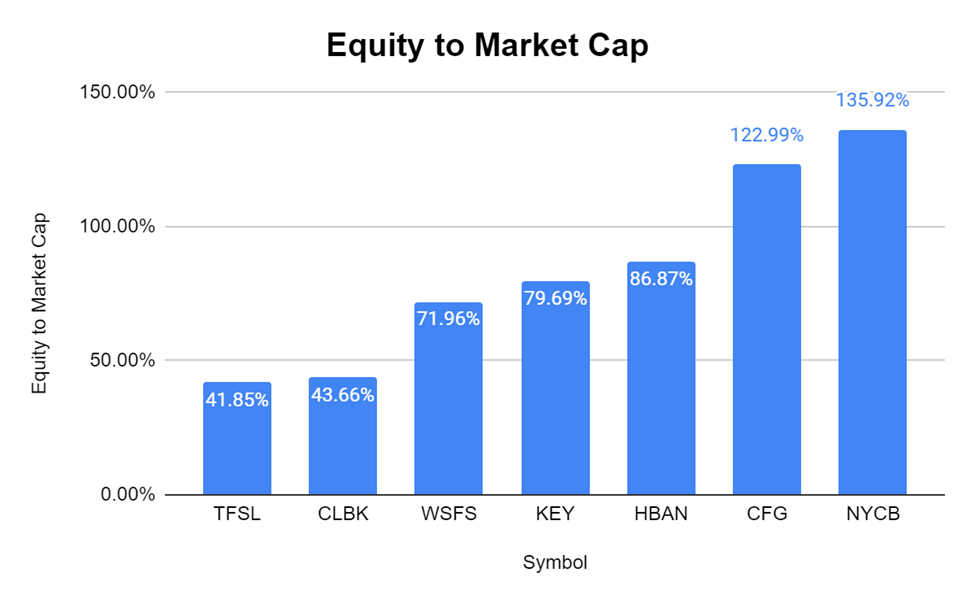
NYCB has 77.58% of its market cap in tangible book value on its balance sheet. The peer group average is 53.28%, and the closest company to NYCB is CFG, with 71.95% of its market cap in tangible book value. The market is significantly discounting NYCB to its peers in this aspect.
Steven Fiorillo, Seeking Alpha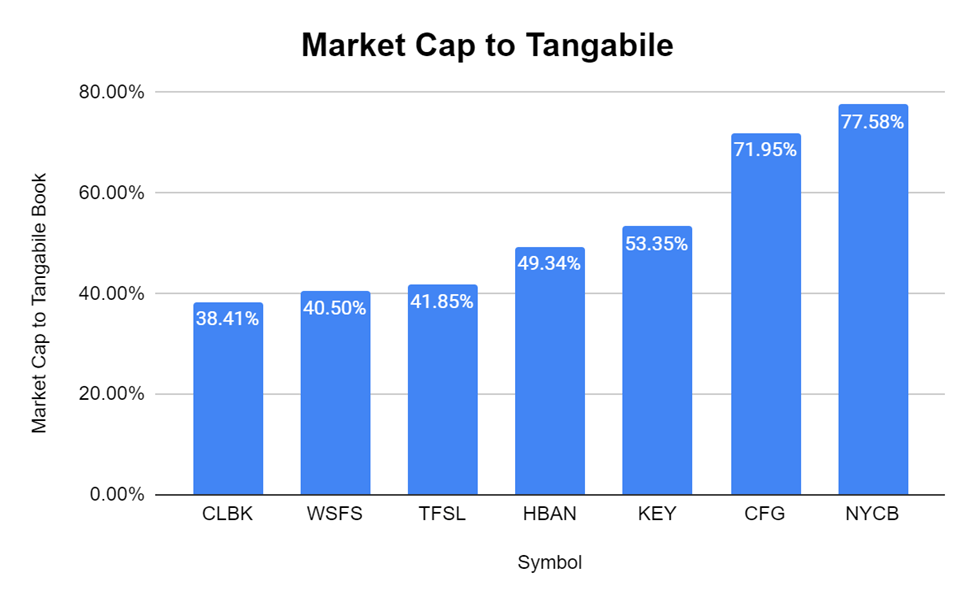
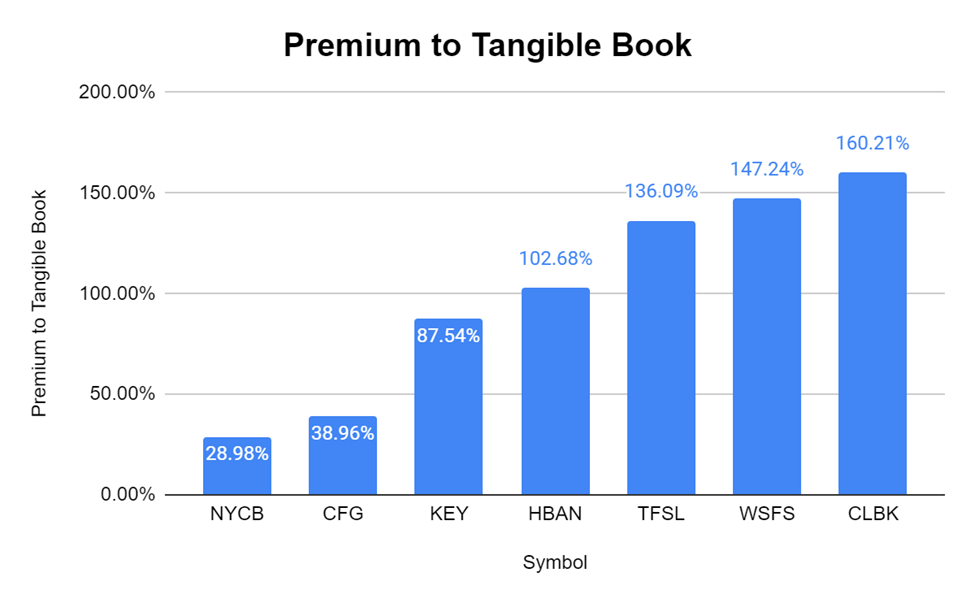
So how much of a discount is NYCB really trading at compared to book and tangible book? If you’re looking at book value, NYCB is trading at a -20.58% discount. The market has placed a 31.17% premium on HBAN and up to a 136.09% premium on TFSL. It’s hard to look at this and say that NYCB is being valued correctly as the only metric that is out of whack is the LDR ratio. Looking at the price to tangible book value, NYCB is also grossly undervalued. This is a stricter metric than looking at book value because it strips away all of the intangible assets. The market is giving NYCB a 29.98% premium above its tangible book value. Of these 7 banks, 4 of them have more than a 100% premium placed on their tangible book value and up to 160.21%. CFG is the closest to NYCB, and it trades at a premium of 38.96%.
Steven Fiorillo, Seeking Alpha Steven Fiorillo, Seeking Alpha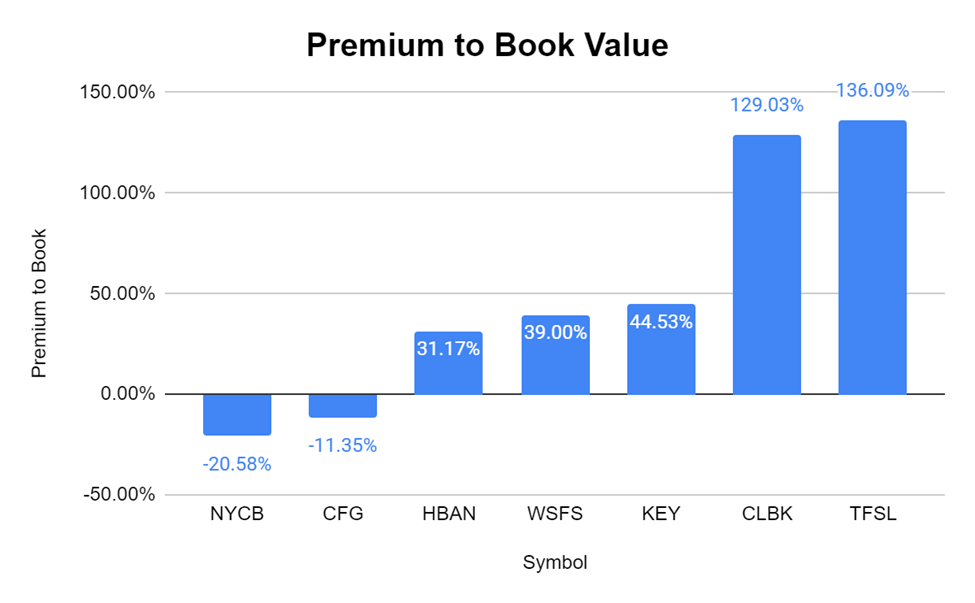
Prior to figuring out where I stand on NYCB, I need to look at the dividends from these banks
NYCB has not increased its dividend and is still paying $0.68 dividend per share, which is a forward yield of 6.31%. NYCB didn’t announce plans of a dividend increase on the Q2 call, and it looks like another year without a dividend increase is in the cards for shareholders. Honestly, I am fine with that, as NYCB’s yield is 6.31%, much larger than many other equities in the market. Other than TFSL, NYCB has the largest yield in its peer group.
Steven Fiorillo, Seeking Alpha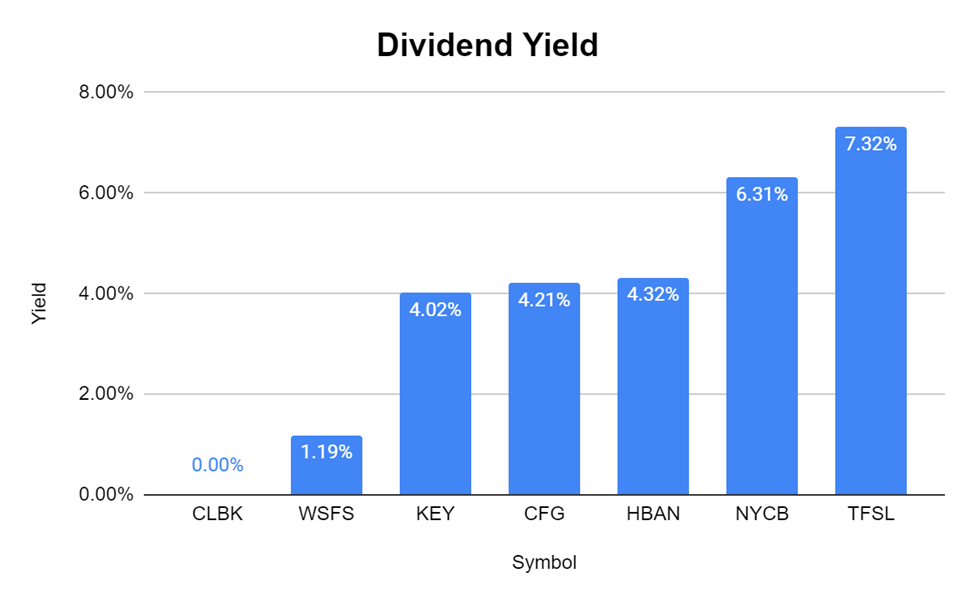
Regardless of what the dividend yield is, it’s important to look at the dividend payout ratio. I like to make sure that the dividend being paid isn’t unsustainable and that there is enough room for future increases. TFSL still has an unsustainable yield which they will either need to tap the debt market or their cash reserves to pay as their payout ratio is 434.62%. NYCB has a fantastic payout ratio at 51.91%, which is slightly lower than Q1’s payout ratio of 55.74% as EPS is growing. Having a 6.31% yield with a 51.91% payout ratio is fantastic, and NYCB isn’t in any danger of a dividend cut and has more than enough room to start growing its dividend again.
Steven Fiorillo, Seeking Alpha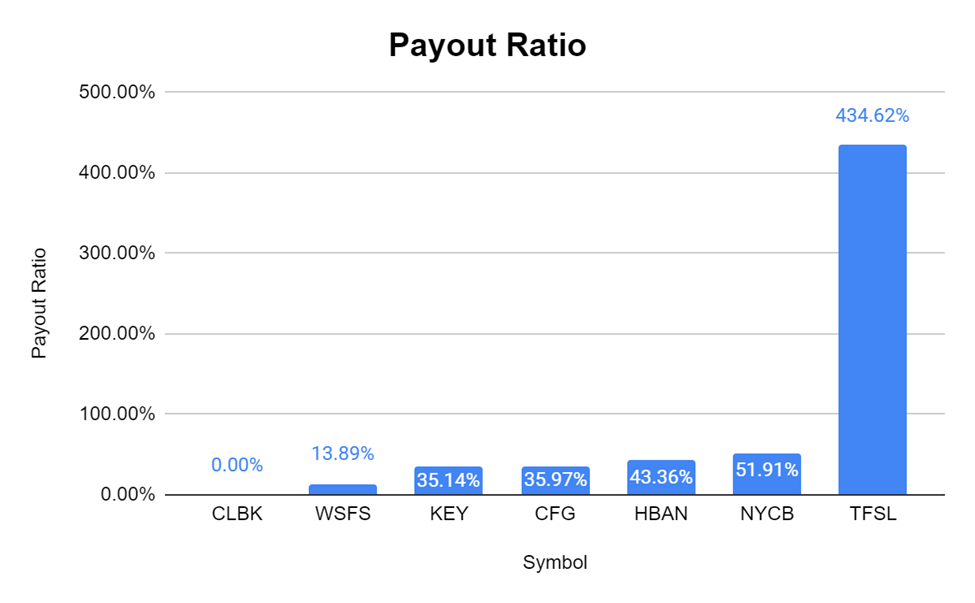
Conclusion
Even though NYCB has outperformed the S&P since the June lows, I think it’s still a strong buy. NYCB is paying a dividend that yields 6.31%, it’s fully covered by a 51.91% payout ratio, and its financials continue to improve. In the TTM, NYCB’s revenue has grown by $37 million (2.75%) YoY, driving net income and EPS. NYCB has an additional 35.92% of equity on its books compared to its market cap and trades at a discount to its peers in both P/E and P/B ratios. NYCB trades at a -20.58% discount to its book value, while the average bank in its peer group trades at a 49.70% premium. I think NYCB can get to a 1:1 ratio on book value before 2022 is over if the market continues to rally in the back half of 2022.
Be the first to comment