

DNY59
By Lena Katsnelson, Senior Manager and Lydia Hamill, Senior Associate
It is often the case that the lack of index coverage for a given asset class has a limiting effect on international investment and analysis. Availability of an index affords fixed income market participants the tools needed for peer group relative value analysis (as defined by the index provider with rules-based inclusion criteria), price and term structure transparency.
For example, investors are typically attracted to local currency frontier government bonds by the higher yields, shorter duration, foreign exchange exposure, and diversification benefits. However, they tend to not be included in mainstream or even standalone indices.
While these markets are challenging to invest in given the lower international investor participation rate and higher transaction costs, they are often included in portfolios that are benchmarked to mainstream EM indices, despite not being eligible for inclusion in these indices. Indeed, it is this dynamic that can create appealing market characteristics. The low percentage of international investors in frontier markets reduces the macro correlation with other fixed income assets, while offering a more attractive yield.
A core consideration for investors are the operational hurdles associated with transacting in these markets, including the need for an FX specialist to access the local currency, limited liquidity, complex domestic settlement and custody networks, and sovereign credit analysis to avoid default risk. By investing in this market through a specialist investment fund, an investor can take broad sector exposure with all the yield benefits and reduce idiosyncratic risk.
Defining the index
FTSE Russell pioneered indexing frontier emerging markets in fixed income by first defining it. Historically, it has been relatively straightforward for index providers to track US-dollar denominated government bonds issued by these countries, since hard currency indices tend not to incorporate specific country inclusion, only requiring the country to be classified as ‘emerging’. To offer an index that tracks local currency frontier EM government bonds, accessibility needs to be considered, due to the need for investment in the local capital markets ecosystem.
In launching the FTSE Frontier Emerging Markets Government Bond Index (FRNTEMGBI), FTSE Russell was able to accomplish this by leveraging the same market accessibility assessment that is incorporated into the flagship FTSE World Government Bond Index (WGBI) and FTSE Emerging Markets Government Bond Index (EMGBI) methodologies.
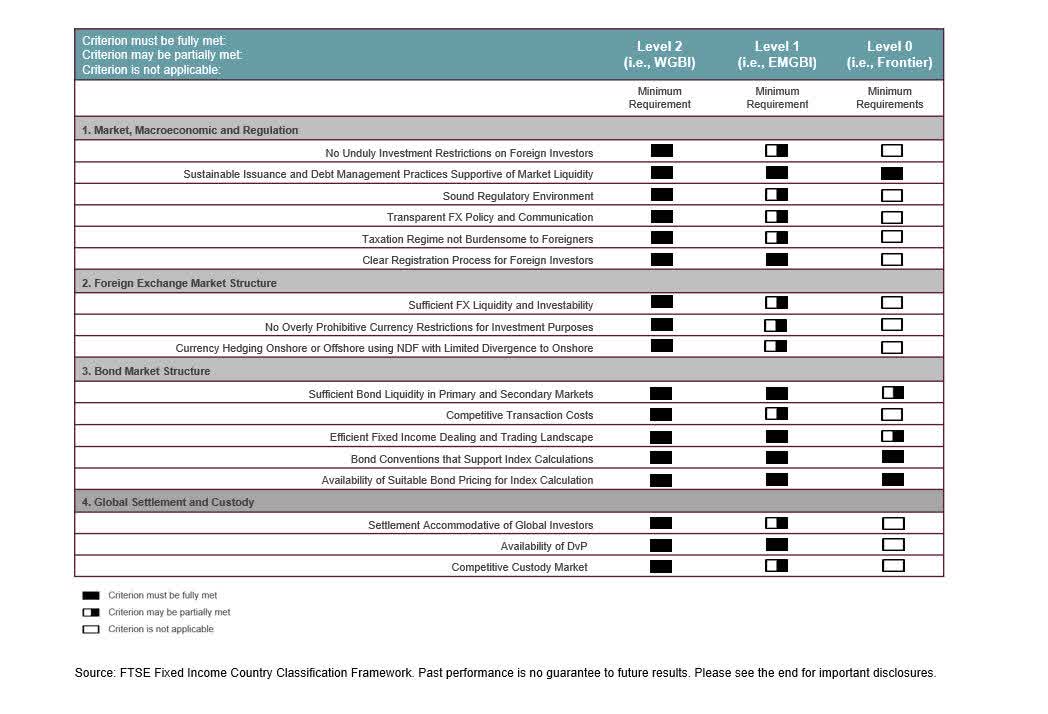
The framework is summarised in figure 1. The market accessibility thresholds are intended to capture the ease with which international investors can access a local currency market. For the FTSE FRNTEMGBI, requirements are far less stringent than those required for FTSE’s flagship local currency emerging markets Index, the FTSE EMGBI.
For example, there should be evidence of a sustainable issuance programme to ensure there is a sufficient supply of bonds for index users to invest in, debt management practices that support secondary market liquidity, and FTSE Russell must be able to source pricing and reference data from its pricing provider, Refinitiv. Moreover, the trading conditions are assessed to ensure there is a sufficient network of broker dealers to make markets for international investors. These minimum requirements (a level of 0), in conjunction with other objective entry requirements such as minimum market size, allow FTSE to define the frontier EM universe.
The case for frontier bond indices
In the current market backdrop of inflation and rising interest rates, as well as geopolitical uncertainties, investment in frontier EM local currency markets has some unexpected advantages. Traditionally, the term structure for a frontier EM market has been shorter than in developed markets because frontier markets tend to have shorter maturities and investors access a combination of bonds, treasury-bill, and local FX to add exposures.
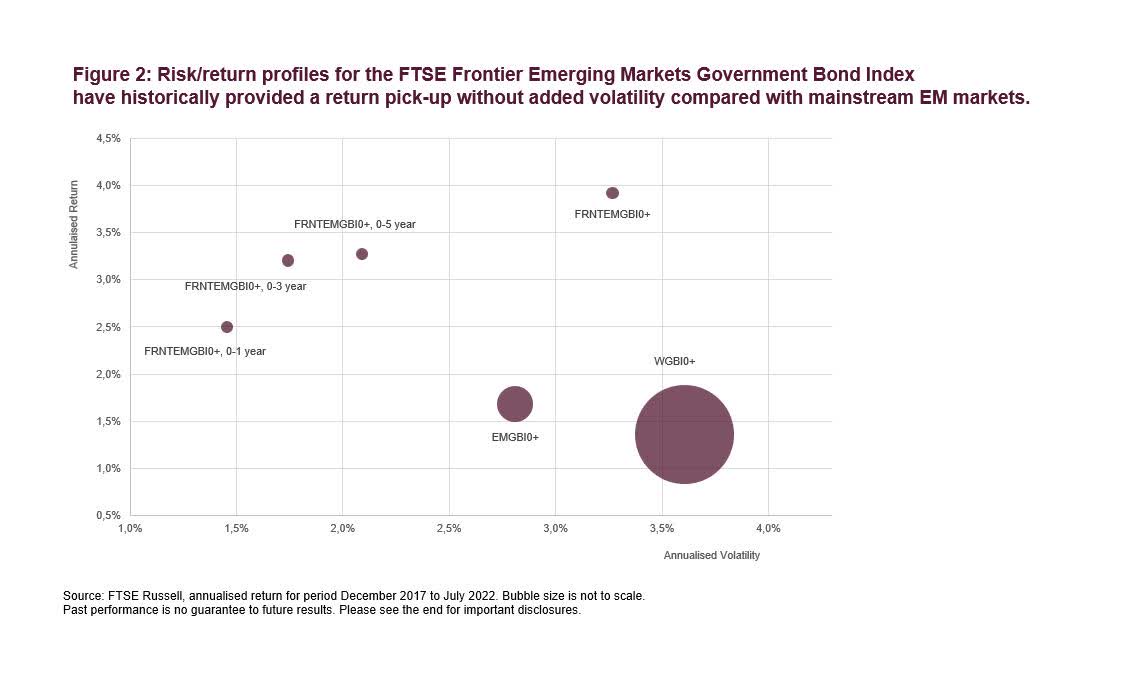
FTSE’s modular approach to index construction allows investors to measure this attractive relationship between yield and duration using our short-term frontier sub-indices. The short-term buckets, such as 0-3 year and 0-5 year, demonstrate this enhanced risk/return profile, with reduced interest rate sensitivity through a shorter duration profile (see figure 2).
Removing the minimum maturity of one year from traditional fixed income benchmarks reflects the practical experience of investors in this asset class to hold short-term instruments to maturity. Although unlikely, a passive investment strategy in this space would benefit from this rule by avoiding the forced divestment of a security that has reached the one year to maturity mark. Moreover, it lowers the duration of the index, better reflecting the investment choice set for frontier investors who may include non-index-eligible securities in their portfolios such as currency NDFs.
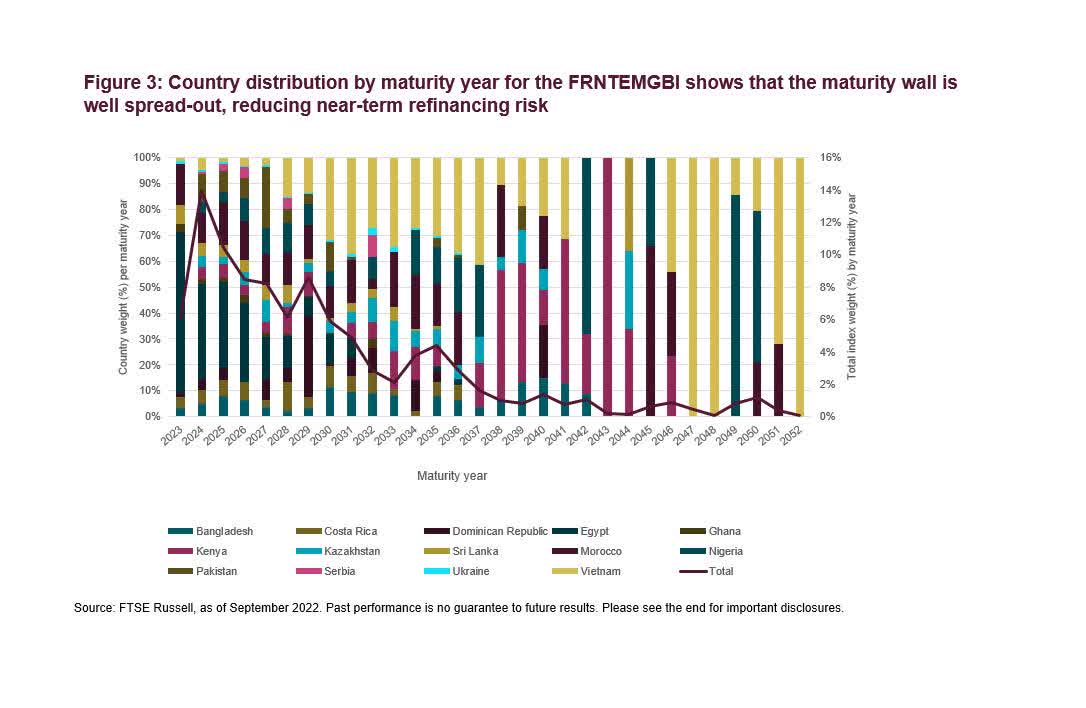
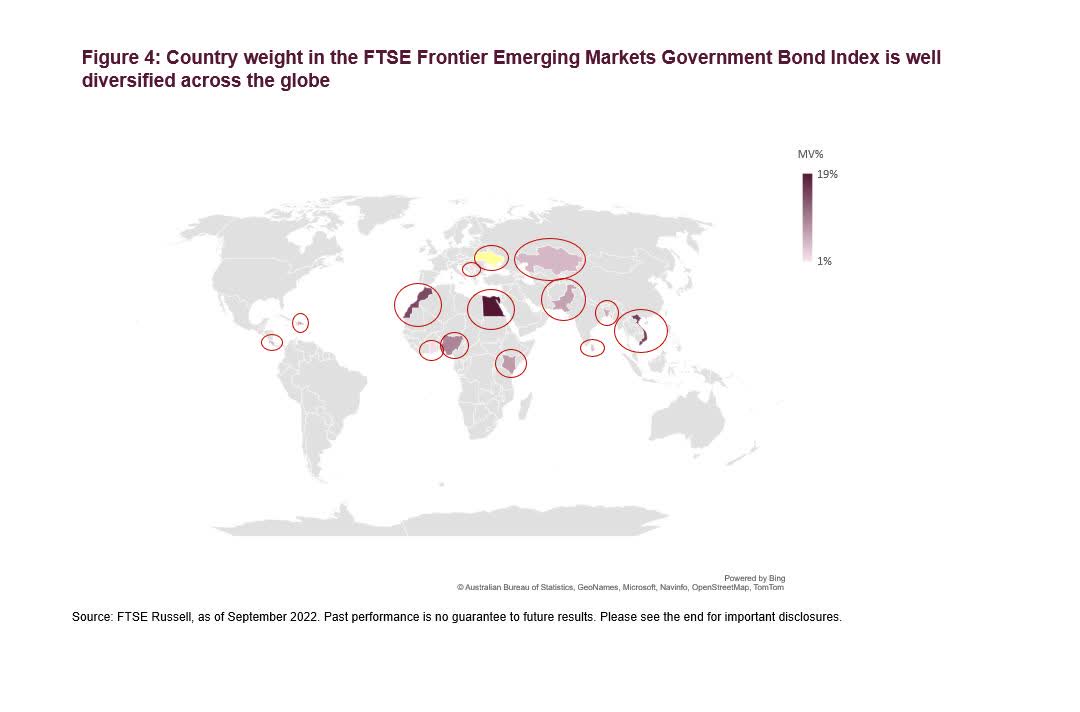
Heading into next year, the FTSE Frontier Emerging Markets Government Bond Index has a well populated yield curve, with only 6% of the universe maturing in 2023. Overall, only 28% of index market value will roll in the first 3 years. The credit concentration for the first maturity wave is weighted towards Egypt and Morocco, relatively large and stable African economies.
Moreover, Ukraine represents less than 1% of upcoming maturities. The geo-political uncertainty arising from recent events is a reminder that all markets are exposed to geopolitical risk, including the frontier EM markets. However, FRNTEMGBI has historically provided a higher annualized return, without added volatility, versus the mainstream EMGBI, as shown by figure 2.
Additionally, rising interest rates and stressed macroeconomic financing conditions are asymmetrical across geographies. The FTSE FRNTEMGBI represents a diversified exposure, which may mitigate this risk to some extent. According to African Development Bank[1], the ongoing conflict between Russia and Ukraine is likely to benefit oil and energy exporting countries, while having an adverse impact on commodity importing countries.
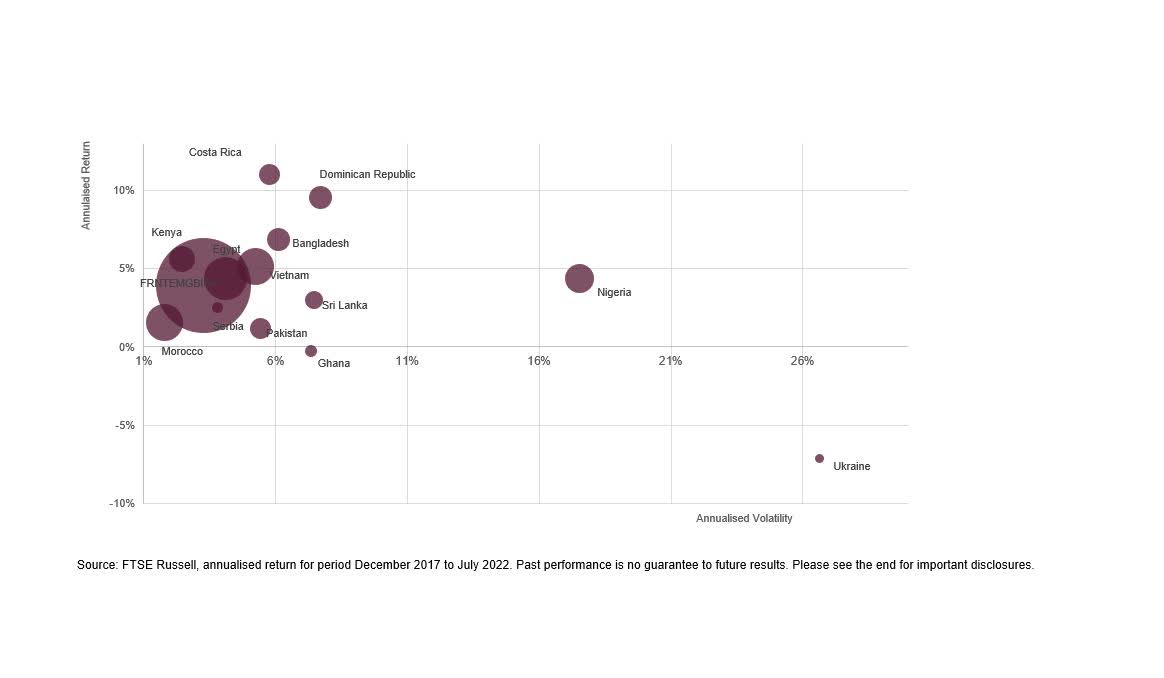
Careful country selection can help to manage these risks. The African Development Bank also note that proximity to the conflict is an important consideration, meaning that some physical distance could be preferable. Figure 4 shows that the FTSE FRNTEMGBI constituents are diversified across the globe, spanning countries from Africa, South America, and Asia, with under 5% of index market value coming from European issuers.
Diversification benefits
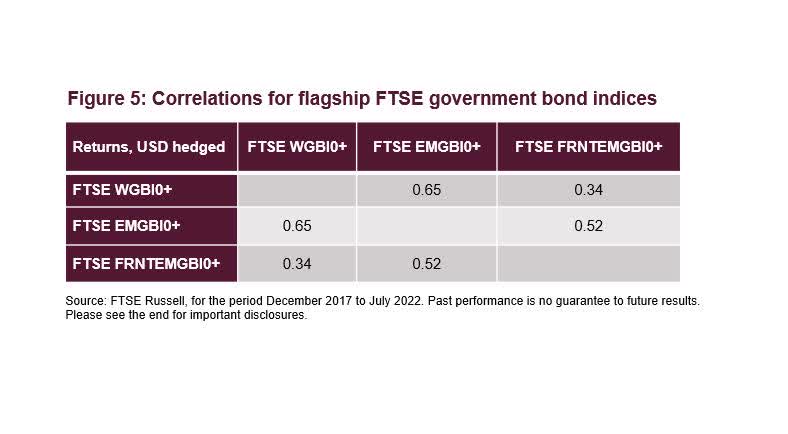
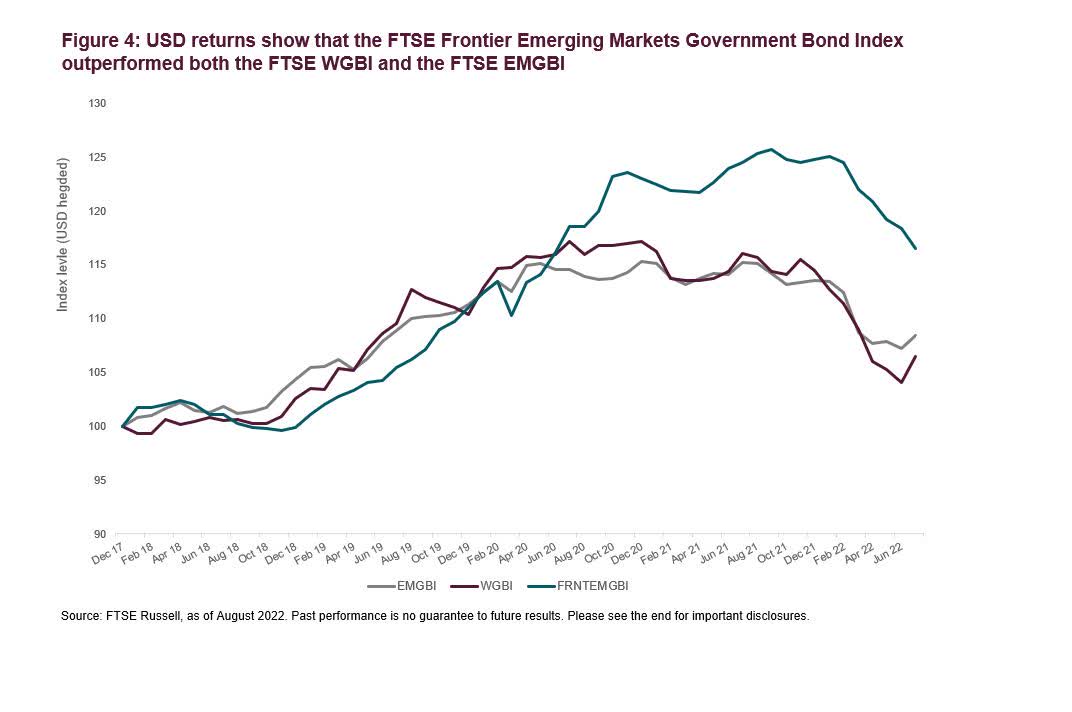
The relative outperformance of the FTSE FRNTEMGBI during the first half of 2022 versus the FTSE WGBI, characterised by highly liquid, accessible, and mostly developed markets, as well as the mainstream EM countries tracked by the FTSE EMGBI, is further evidence of the potential diversification benefits that the frontier choice-set provides. As shown by figure 5 below, the frontier index is less correlated with the FTSE WGBI historical returns versus the FTSE EMGBI, but also demonstrates some degree of independence against the FTSE EMGBI itself.
Back-tested returns demonstrate this low correlation especially during critical junctures such as the Covid crisis period. Figure 4 illustrates the enhanced returns relative to more developed markets in the last few years, even relative to more investment-grade emerging market bonds.
Given the themes discussed here such as difficulty defining frontier and the relatively volatile nature of frontier markets, the FTSE Frontier Emerging Markets Government Bond Index Series offers an elegant way of measuring a diversified exposure to frontier markets. Moreover, a short duration strategy may provide a lower-risk entry point for investors looking to gain exposure to these markets, given current market backdrops of inflation and market volatility.
|
© 2022 London Stock Exchange Group plc and its applicable group undertakings (the “LSE Group”). The LSE Group includes (1) FTSE International Limited (“FTSE”), (2) Frank Russell Company (“Russell”), (3) FTSE Global Debt Capital Markets Inc. and FTSE Global Debt Capital Markets Limited (together, “FTSE Canada”), (4) FTSE Fixed Income Europe Limited (“FTSE FI Europe”), (5) FTSE Fixed Income LLC (“FTSE FI”), (6) The Yield Book Inc (“YB”) and (7) Beyond Ratings S.A.S. (“BR”). All rights reserved. FTSE Russell® is a trading name of FTSE, Russell, FTSE Canada, FTSE FI, FTSE FI Europe, YB and BR. “FTSE®”, “Russell®”, “FTSE Russell®”, “FTSE4Good®”, “ICB®”, “The Yield Book®”, “Beyond Ratings®” and all other trademarks and service marks used herein (whether registered or unregistered) are trademarks and/or service marks owned or licensed by the applicable member of the LSE Group or their respective licensors and are owned, or used under licence, by FTSE, Russell, FTSE Canada, FTSE FI, FTSE FI Europe, YB or BR. FTSE International Limited is authorised and regulated by the Financial Conduct Authority as a benchmark administrator. All information is provided for information purposes only. All information and data contained in this publication is obtained by the LSE Group, from sources believed by it to be accurate and reliable. Because of the possibility of human and mechanical error as well as other factors, however, such information and data is provided “as is” without warranty of any kind. No member of the LSE Group nor their respective directors, officers, employees, partners or licensors make any claim, prediction, warranty or representation whatsoever, expressly or impliedly, either as to the accuracy, timeliness, completeness, merchantability of any information or of results to be obtained from the use of FTSE Russell products, including but not limited to indexes, data and analytics, or the fitness or suitability of the FTSE Russell products for any particular purpose to which they might be put. Any representation of historical data accessible through FTSE Russell products is provided for information purposes only and is not a reliable indicator of future performance. No responsibility or liability can be accepted by any member of the LSE Group nor their respective directors, officers, employees, partners or licensors for (A) any loss or damage in whole or in part caused by, resulting from, or relating to any error (negligent or otherwise) or other circumstance involved in procuring, collecting, compiling, interpreting, analysing, editing, transcribing, transmitting, communicating or delivering any such information or data or from use of this document or links to this document or (B) any direct, indirect, special, consequential or incidental damages whatsoever, even if any member of the LSE Group is advised in advance of the possibility of such damages, resulting from the use of, or inability to use, such information. No member of the LSE Group nor their respective directors, officers, employees, partners or licensors provide investment advice and nothing in this document should be taken as constituting financial or investment advice. No member of the LSE Group nor their respective directors, officers, employees, partners or licensors make any representation regarding the advisability of investing in any asset or whether such investment creates any legal or compliance risks for the investor. A decision to invest in any such asset should not be made in reliance on any information herein. Indexes cannot be invested in directly. Inclusion of an asset in an index is not a recommendation to buy, sell or hold that asset nor confirmation that any particular investor may lawfully buy, sell or hold the asset or an index containing the asset. The general information contained in this publication should not be acted upon without obtaining specific legal, tax, and investment advice from a licensed professional. Past performance is no guarantee of future results. Charts and graphs are provided for illustrative purposes only. Index returns shown may not represent the results of the actual trading of investable assets. Certain returns shown may reflect back-tested performance. All performance presented prior to the index inception date is back-tested performance. Back-tested performance is not actual performance, but is hypothetical. The back-test calculations are based on the same methodology that was in effect when the index was officially launched. However, back-tested data may reflect the application of the index methodology with the benefit of hindsight, and the historic calculations of an index may change from month to month based on revisions to the underlying economic data used in the calculation of the index. This document may contain forward-looking assessments. These are based upon a number of assumptions concerning future conditions that ultimately may prove to be inaccurate. Such forward-looking assessments are subject to risks and uncertainties and may be affected by various factors that may cause actual results to differ materially. No member of the LSE Group nor their licensors assume any duty to and do not undertake to update forward-looking assessments. No part of this information may be reproduced, stored in a retrieval system or transmitted in any form or by any means, electronic, mechanical, photocopying, recording or otherwise, without prior written permission of the applicable member of the LSE Group. Use and distribution of the LSE Group data requires a licence from FTSE, Russell, FTSE Canada, FTSE FI, FTSE FI Europe, YB, BR and/or their respective licensors. |
Editor’s Note: The summary bullets for this article were chosen by Seeking Alpha editors.
Be the first to comment