

winhorse
Thesis
Both Altria (NYSE:MO) and Philip Morris (NYSE:PM) released their Q3 earnings report (“ER”) last week. Overall, PM reported quite an upbeat Q3. Its Non-GAAP EPS came in at $1.53, beating consensus estimates by $0.17. And its revenues came in at $8.03B, also beating consensus estimates (by $730M). Furthermore, PM also reaffirmed its Pro Forma Adjusted Diluted EPS (actually decreased it by 1 cent) in a range of $5.22~$5.33 compared to the prior guidance range of $5.23~$5.34. The stock is currently yielding 5.46% as you can see from the following chart, about 14.7% above its historical average of 4.76%. By PE multiples, it’s currently trading around 16.5x PE, slightly below its historical median of about 17x.
All told, the market seems to have no concern about the dividend safety or growth potential of the stock, and rightfully so. After all, its EPS guidance represents a robust YoY growth of 10%+ when foreign exchange rate impacts are excluded. And its Pro Forma Adjusted Diluted EPS range of $5.22~$5.33 can comfortably cover its current dividend payout of $5.02 per share.
Source: Seeking Alpha data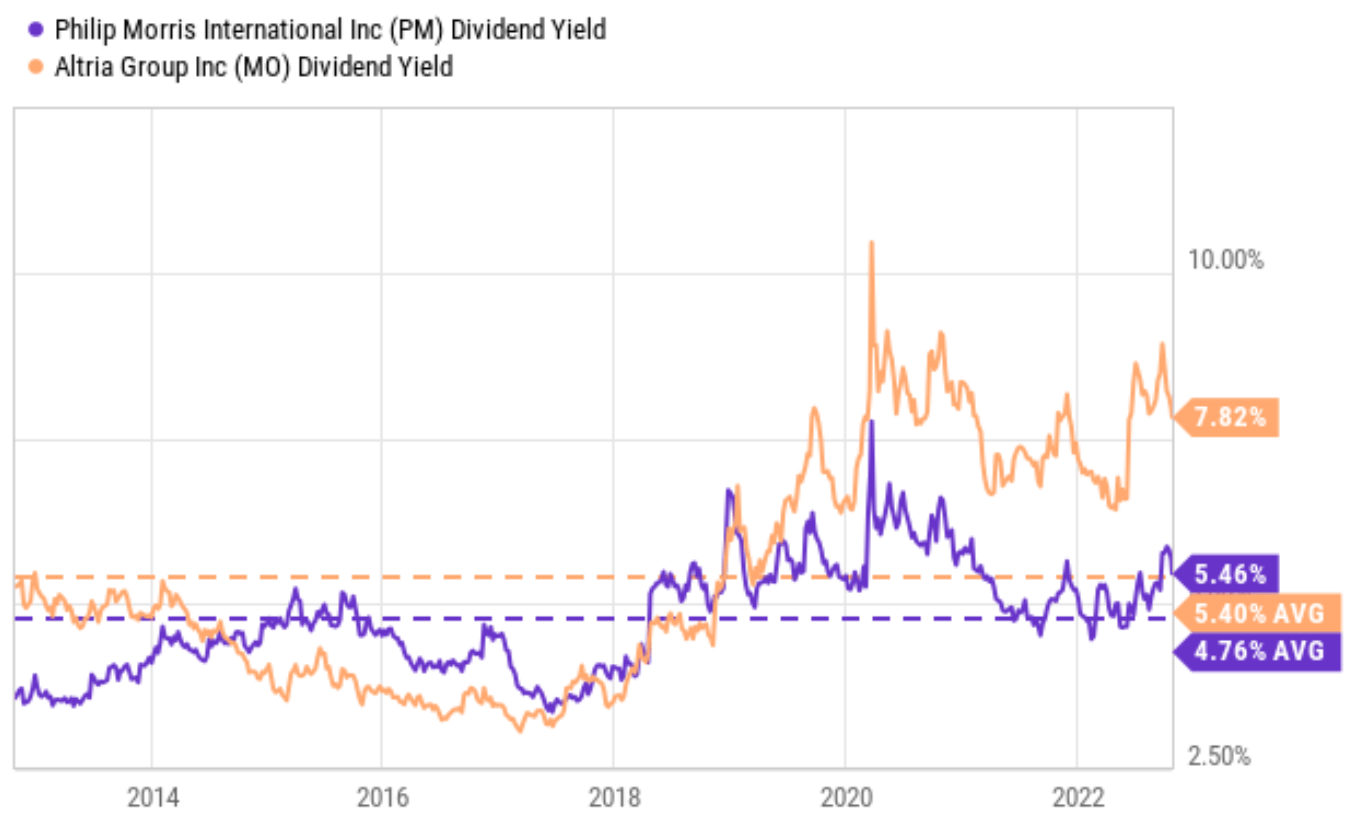
Altria (MO), on the other hand, is a different picture. Its Q3 results missed consensus estimates on both lines. Its Non-GAAP EPS came in at $1.28, missing consensus estimates by $0.02. And its revenues came in at $5.41B, missing consensus estimates by $180M and representing a -2.2% YoY decline. The company is also experiencing a series of setbacks in its development of alternative products. Its JUUL Labs recently announced the cancelation of international expansion and plans for staff cuts, the JUUL Labs are also dealing with a number of lawsuits and an FDA review and facing a potential Chapter 11 bankruptcy, and it also sold the U.S. IQOS rights to PM recently for $2.7B.
MO currently provides a dividend yield of 7.8% as you can see from the following chart. Such an extraordinary yield usually implies that the market is concerned about a dividend cut. To put things under perspective, a 7.8% yield is higher than PM’s 5.46% by more than 42% in relative terms and almost 45% higher than its historical average of 5.4%. In terms of PE multiples, MO is trading at 9.6x FW PE, also a substantial discount from PM’s 16.4x. And a casual look at the common payout ratios seems to confirm such concern about a dividend cut, as to be elaborated on in the next section.
The goal of this article, therefore, is to examine the dividend safety of both MO and PM in depth. And you will see that my conclusion is that both of the dividends are safe and MO’s safety is actually better than PM’s in some aspects.
The misleading payout ratios
I am sure that all dividend investors are familiar with the earnings and cash payout ratios, and these ratios are the first things that we check. However, these ratios are often misleading as in the case of MO.
The next chart shows MO and PM’s dividend payout ratios in terms of earnings (top panel) and also cash flow (bottom panel). MO’s current earnings payout ratio is 372% and PM’s is 66.8%. And you can also see that MO’s earnings payout ratios fluctuated in such a wide range. Such wild fluctuations are caused by accounting caveats and should be ignored in the case of MO. In its Q3 ER, MO narrowed its full-year 2022 EPS guidance to a range between $4.81 to $4.89. And the consensus EPS is $4.84, in the mid of this range. At its current dividend payout of $3.64 per share, the earnings payout ratio is about 75.2%, a quite healthy level and also not that different from PM’s 66.8%.
In terms of cash payout ratios, the picture is more similar between MO and PM because cash is less impacted by accounting caveats. MO’s long-term average cash payout is 86.5%, essentially on par with PM’s 80.2%. And MO’s current ratio of 78.2% is both below its long-term mean and also not that different from PM’s 67.6%.
Source:Seeking Alpha data
Closer look at dividend safety
A full discussion of the limitations of payout ratios and the holistic assessment of dividend safety can be found in our past articles. And as mentioned in these articles,
A holistic assessment enjoys the advantage of being comprehensive. The downside is that it’s a bit involved and requires a more intimate understanding of various financial concepts (cash position, working capital, debt, et al). Here, I will just point out a few simple things that you can easily and quickly check.
The first thing to check beyond the simple payout ratios is the debt coverage as shown in the chart below. PM’s debt/EBITDA ratio has fluctuated from about a low of 2.2x to as high as 2.8x in the past few years since 2016, with an average of 2.44x. Its current value of 2.27x is comfortably below its historical average by about 7% in relative terms.
In contrast, MO’s debt ratios are even safer as shown in the bottom panel of the chart. Again, ignore the wide fluctuations caused by accounting caveats. Also, do not be alarmed by the fact that its current value of 6.4x, which is far above PM. Not sure how YCharts got 6.4x (I am guessing it’s also because of accounting caveats). Its current debt/EBITA ratio is about 2.1x as commented by its CFO in Q3 ER, actually lower than PM’s 2.27x. As aforementioned, MO will also receive $2.7 billion as a part of the IQOS agreement. Management expects part of the cash proceeds to be used for debt repayment, which would further shore up its balance sheet and reduce its leverage ratio.
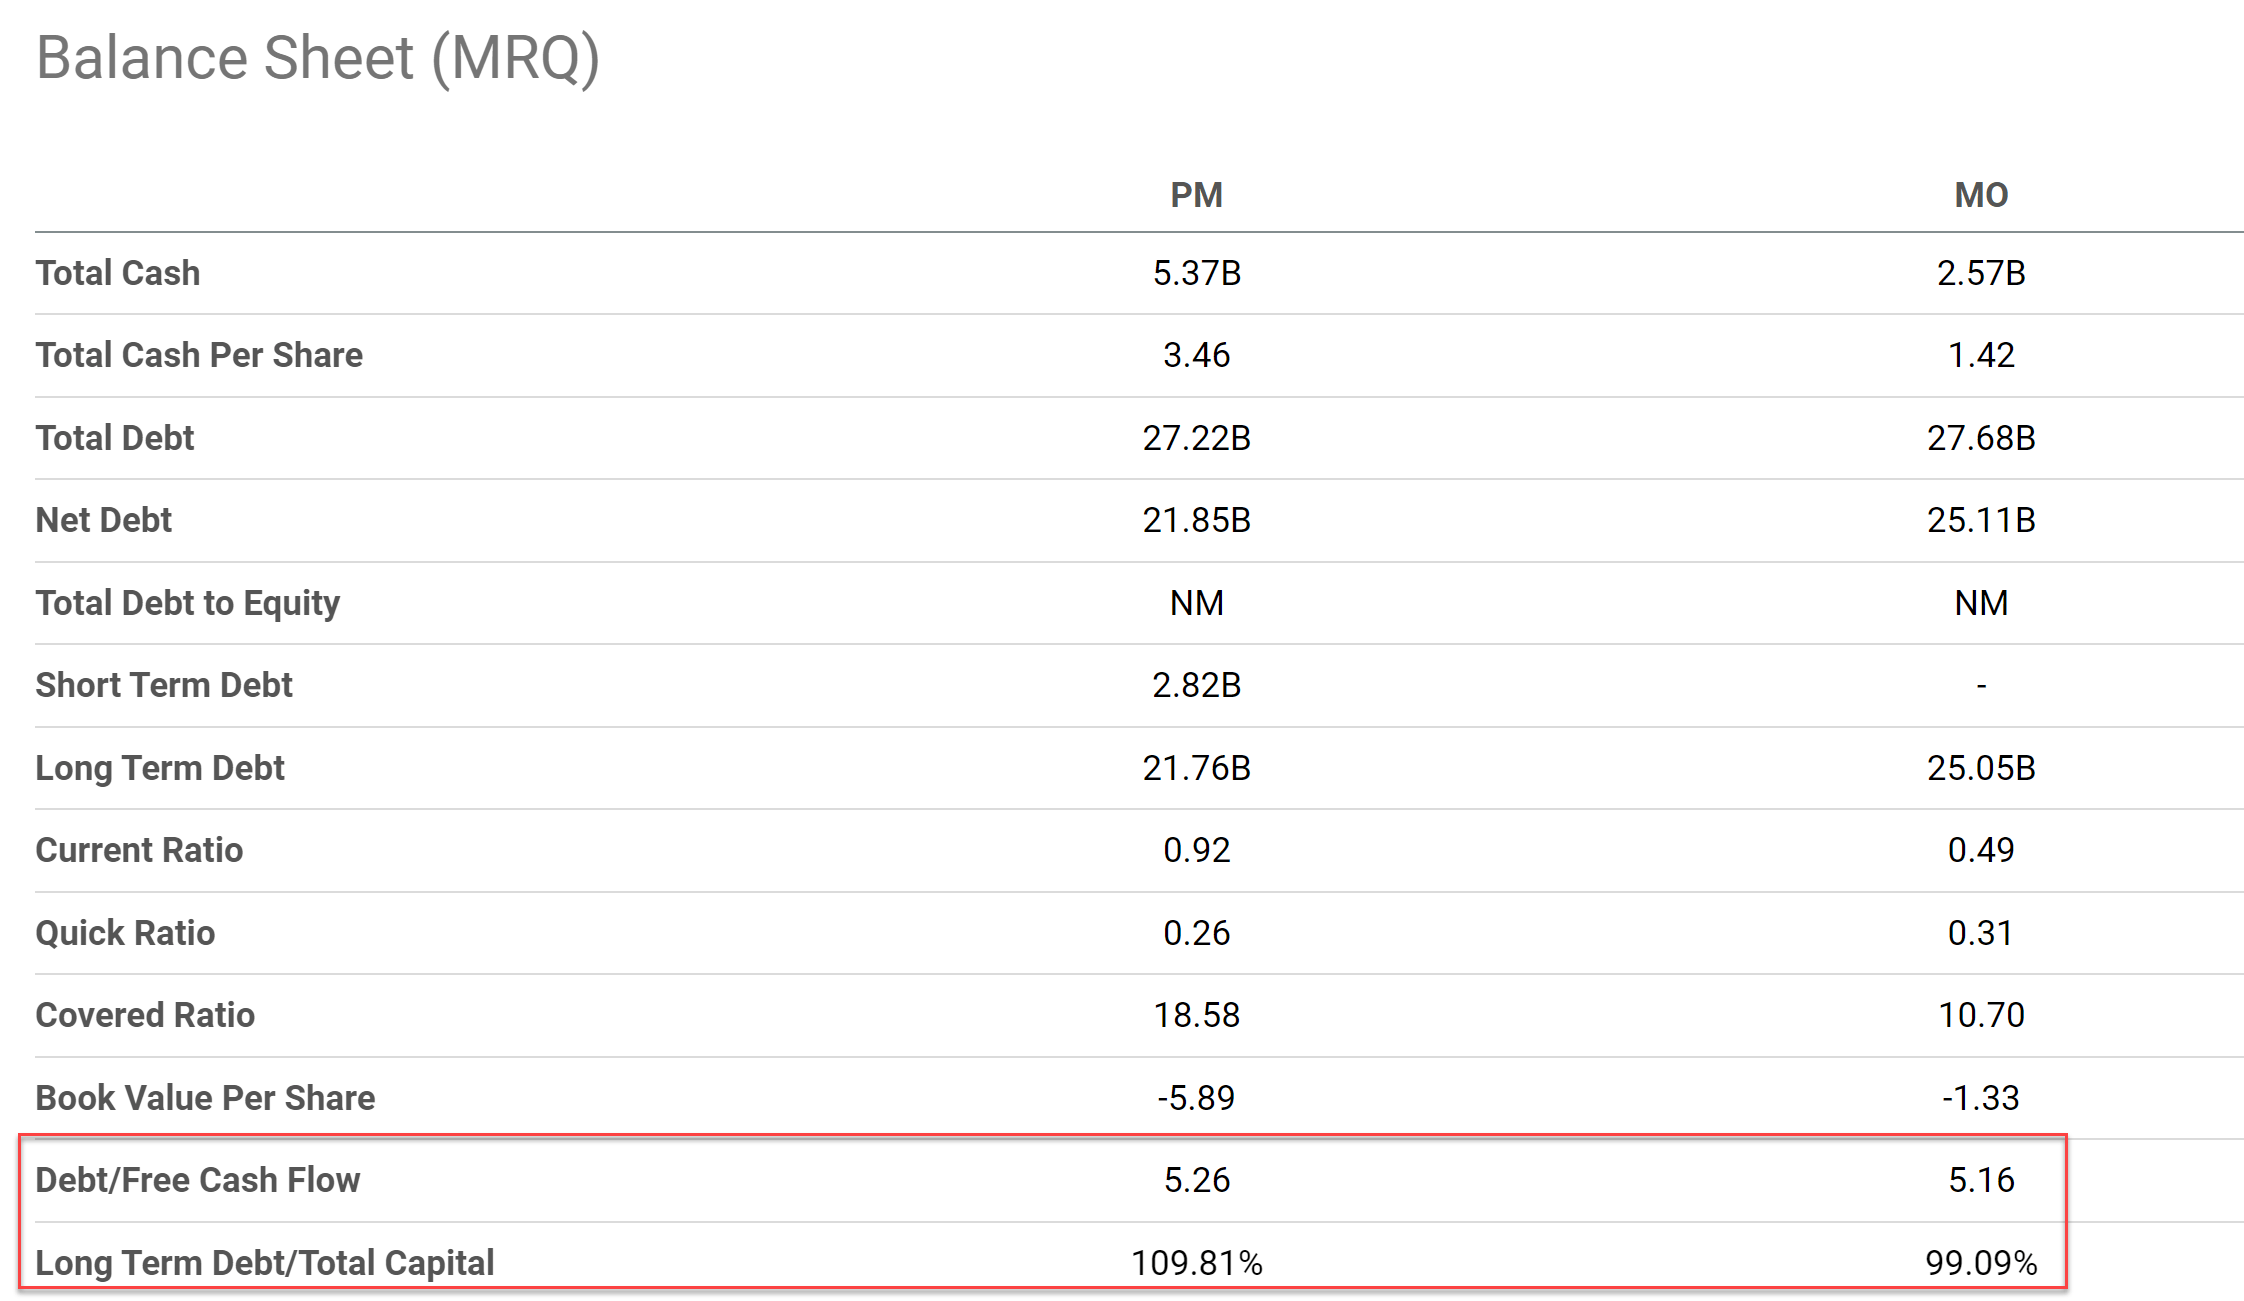
The second chart further confirms MO’s more conservative leverage. As seen, MO’s current long-term debt/total capital ratio is about 99%, compared to about 109% for PM. Also, MO’s debt/Free Cash Flow ratio stands at 5.16, also lower than PM’s 5.26.
Source: Seeking Alpha data Source: author based on Seeking Alpha data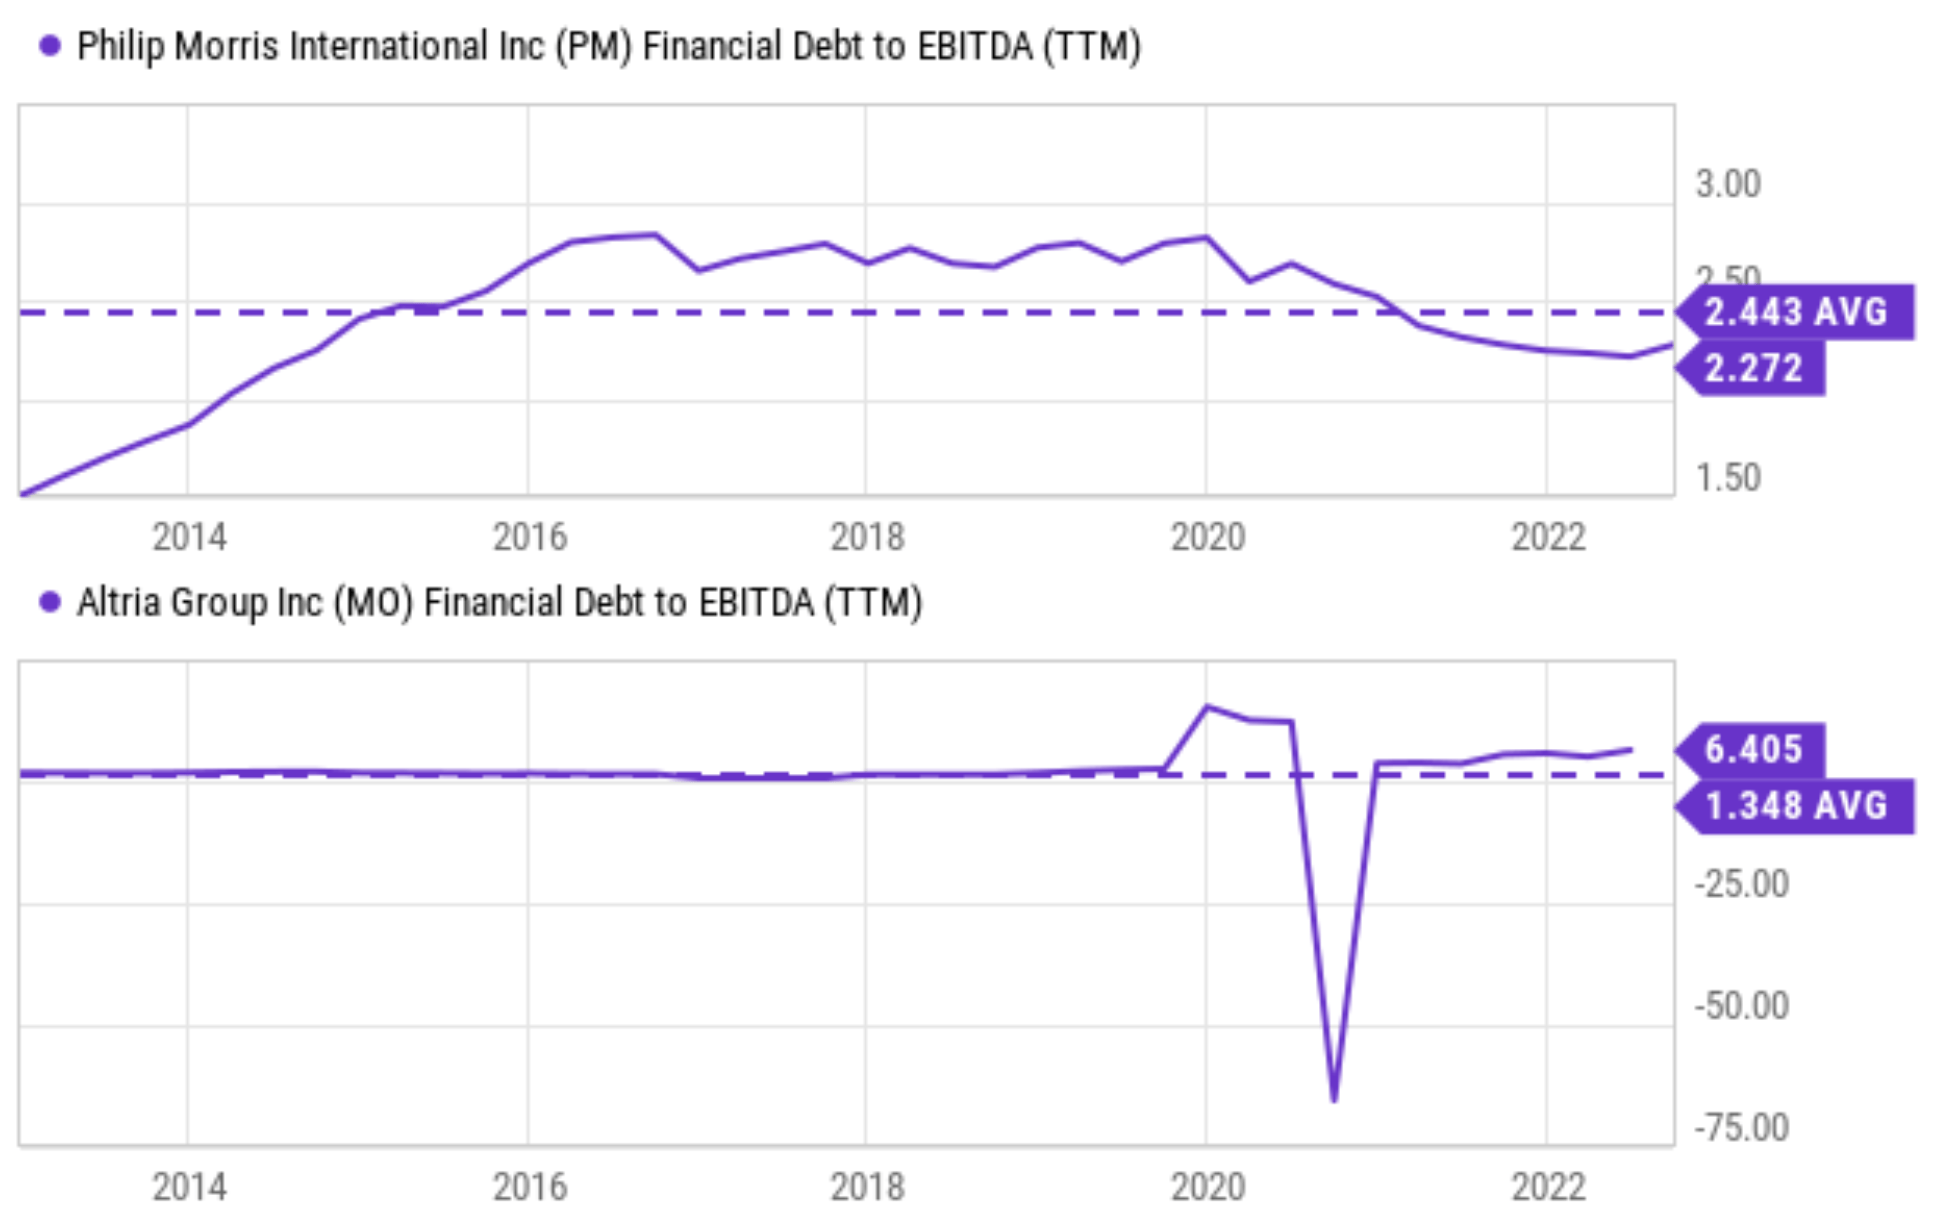
Growth rates and projected returns
Also as mentioned in our earlier article:
Another simple and quick thing to check is the reinvestment rate. A big part of dividend investing involves dividend GROWTH at a rate that can at least combat inflation. Without a healthy and sustainable reinvestment rate, a business will stagnate.
The following chart provides a summary of MO and PM’s CAPEX expenditures and their total depreciation and amortization (“DA”). And as a quick and dirty approbation, I will use the DA to approximate the maintenance CAPEX. Admittedly, both of them have been underinvesting in the recent 1 or two years as seen. However, note both of them have been systematically reinvesting and consistently spending on CAPEX over the long term. In PM’s case, its average DA over the past 10 years was about $897M, while its CAPEX investments have been on average $1067M. MO spends less on CAPEX compared to PM, but we will see later that its higher ROCE (return on capital employed) makes it up. And more importantly, also note that both of them have been enjoying extremely low maintenance CAPEX as approximated by their DA so that they do not have to spend too much on CAPEX to maintain healthy growth rates.
Source: Seeking Alpha data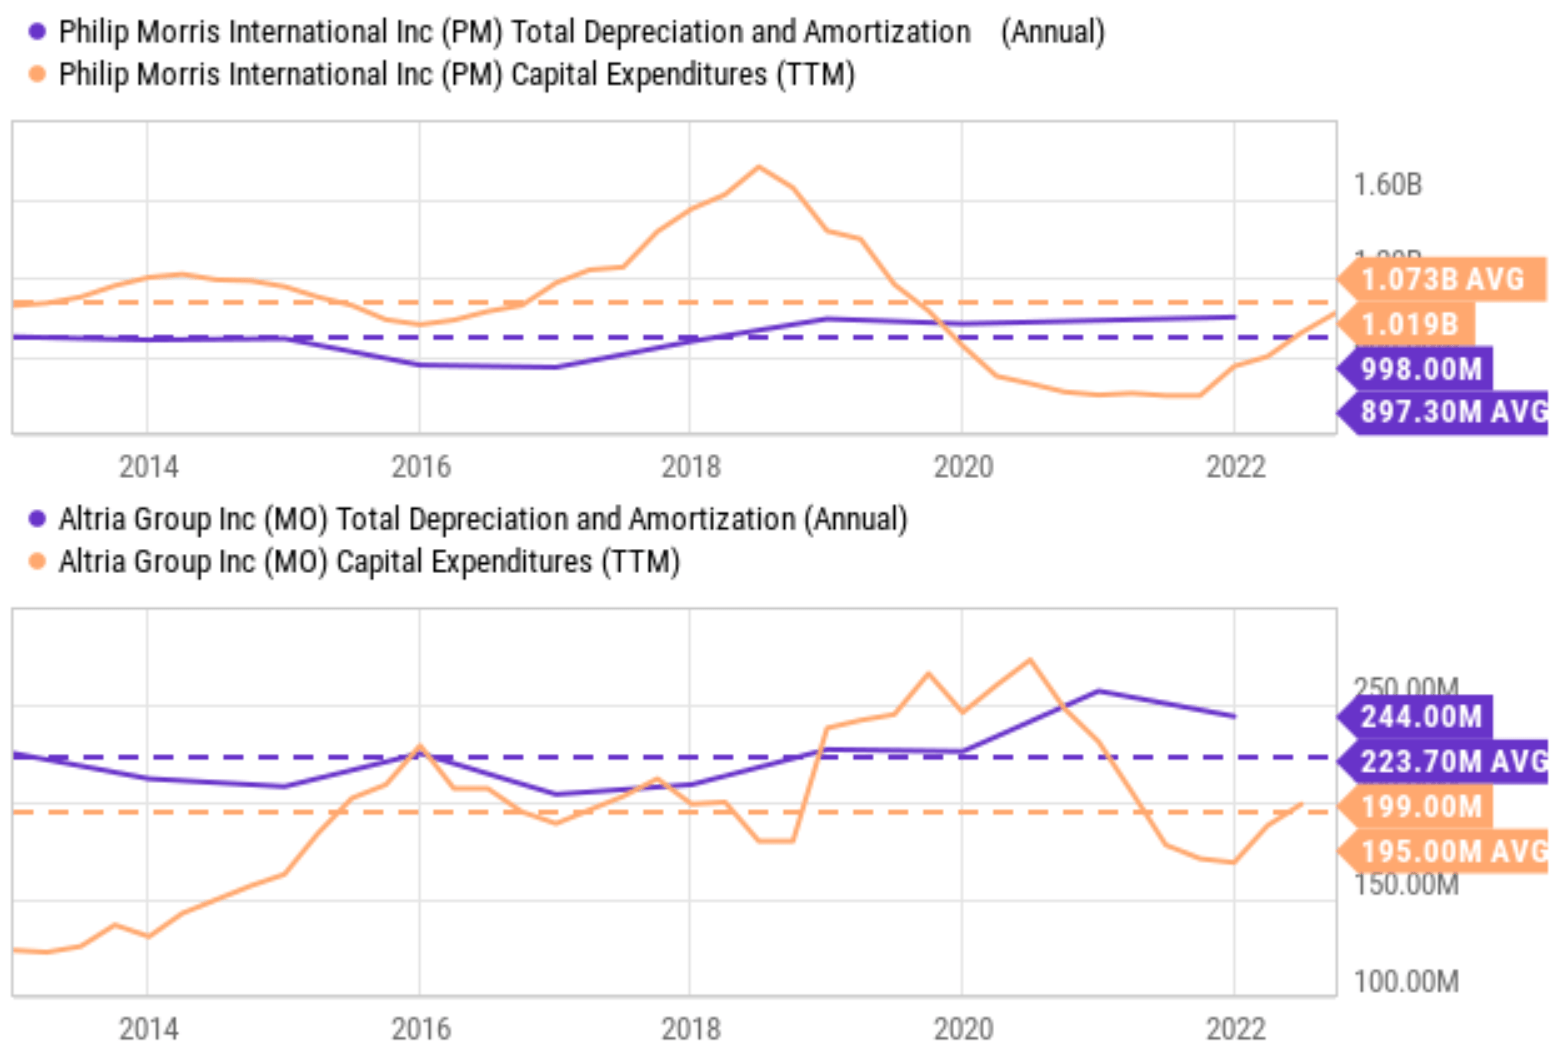
In the long term, the growth rate is simply the product of ROCE (return on capital employed) and reinvestment rate. For MO, its reinvestment rates are about 2% based on my analysis, and its ROCE is about 155% as analyzed in my earlier article. As a result, its long-term growth rate would be about 3.1% (2% reinvestment rate x 155% ROCE = 3.1% growth rate). And the projected returns in the next 3~5 years, as summarized in the following waterfall chart. This projection assumes the following return drivers:
- again, a 3.1% organic growth rate.
- 2.3% share repurchases based on historical trend
- A valuation reversion to the mean (from the current 9.6x FW PE to the historical mean of about 13x), contributing about 4.5% annual return in the next 3~5 years.
Based on the above assumptions, the annual return should be around 9.9% a year, as shown below. And note that a large portion of the total return (7.8%) is already provided by the current dividend yield.
The picture for PM would be quite similar as shown in the second chart. For PM, its reinvestment rates are about 4.5% based on my analysis, and its ROCE is about 80% as analyzed in my earlier article. As a result, its long-term growth rate would be about 3.6% (4.5% reinvestment rate x 80% ROCE = 3.6% growth rate). And the projected returns in the next 3~5 years are about 5.6% per year, which can be almost entirely supported by its current dividends alone.
Source: author based on Seeking Alpha data Source: author based on Seeking Alpha data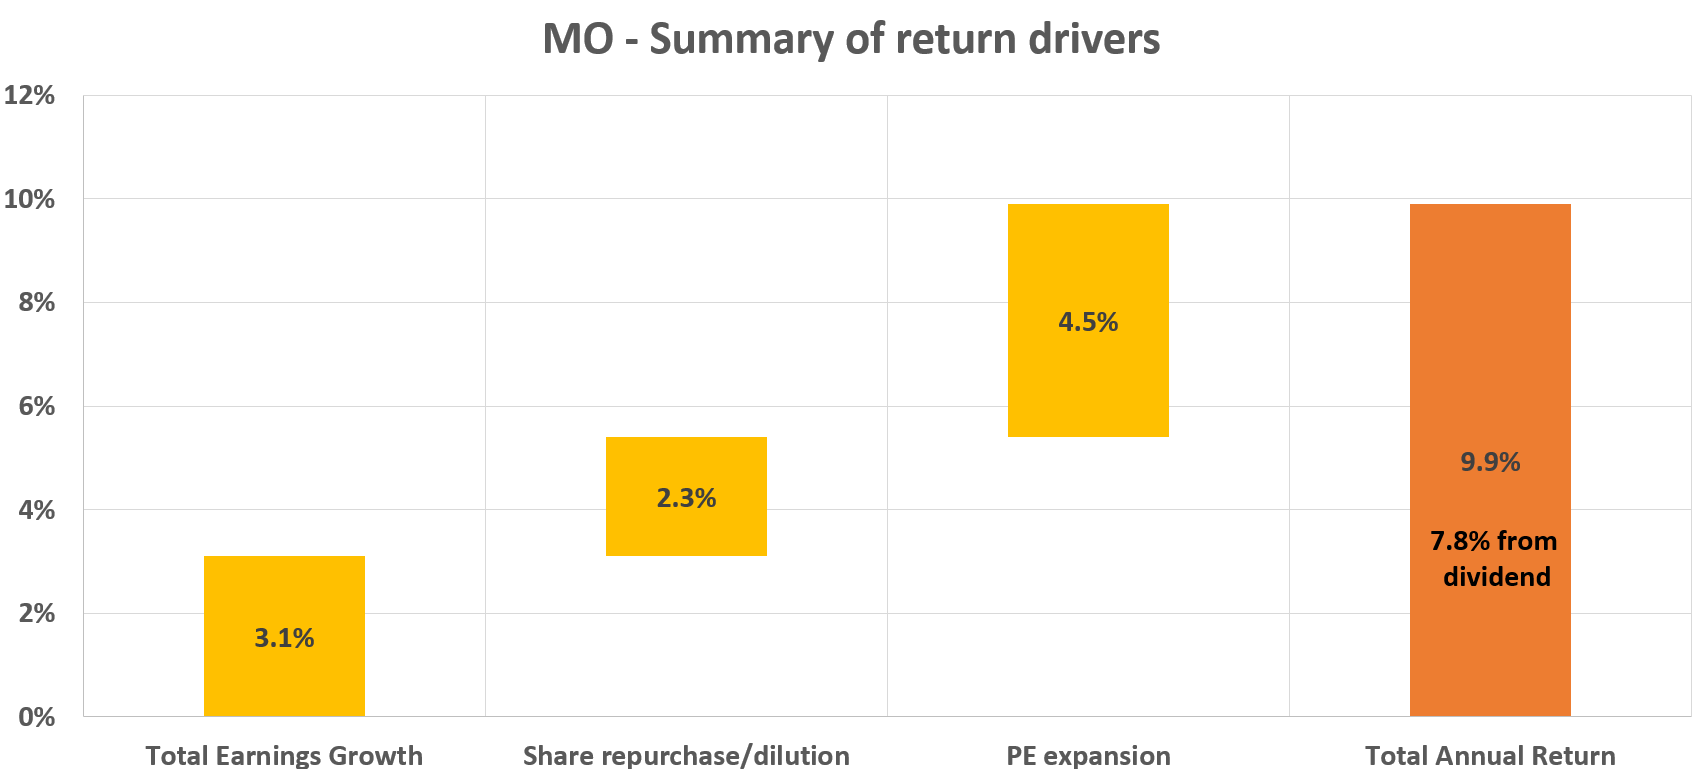

Risks and final thoughts
Besides the risks mentioned so far, both MO and PM face the secular decline of traditional combustible products. Their new categories, even though showing high growth, have been facing speedbumps along the way as aforementioned. Specific to MO, its risk profile is a bit higher due to its single-market exposure in the U.S. Also, as a U.S. company, MO faces currency headwinds if the dollar keeps gaining strength. While in contrast, as an international company, PM could benefit from the strengthening dollar as its CFO Emmanuel Babeau commented during the ER (abridged and emphases added by me):
I would also like to highlight that U.S. dollar strength has a positive impact on our net debt, given that more than 60% of our financing is in euros, including derivative overlays. This serves to offset the impact on our earnings and, combined with strong cash generation, contributed to a $1.5 billion reduction in our net debt since December 2021, which is now below 1.6 times adjusted EBITDA on a 12-month rolling basis. This delivery highlights our ability to maintain a strong balance sheet, pay down debt, and invest in the growth of our business.
To conclude, both PM and MO are attractive dividend stocks with generous yields (5.46% from PM and 7.8% from MO) and robust profitability. Although in the case of the MO, its valuation and extraordinary dividend yield imply the market’s concern about a dividend cut. And indeed, a casual look at the common earnings payout ratios and its setbacks with the development of alternative products seem to support such concern. This article, therefore, examines the dividend safety for both MO and PM in depth. And my conclusion is that both dividends are safe. And MO’s dividend safety is even stronger than PM in some aspects such as leverage ratio, higher ROCE, and lower maintenance and growth CAPEX requirements.
Be the first to comment