


gorodenkoff/iStock via Getty Images
Investment summary
Here at HB Insights we continue to uncover selective opportunities within the health care universe. We are neutral shares of Neuronetics, Inc. (NASDAQ:STIM) and note shares look fairly priced at the current market capitalization. Despite a high ROIC from STIM, further upside capture appears to be thin for the name, even allowing for adjustments to GAAP earnings. We rate STIM a hold with a $3.45 valuation.
Q2 earnings: growth remains key theme
STIM posted a solid set of numbers in Q2 FY22 with upsides relative to consensus at the top and bottom line. Growth was seen across all segments. Revenue of $16.3 million (“mm”) was up 15% YoY, with the NeuroStar segment posting a 70% YoY gain in sales to $4.4mm. This was also up 20% sequentially. It sold 59 systems during the quarter, on an average ~$75,000 per system. It therefore shows that STIM produced a 9.78% return on the COGS expenditure required to generate this revenue.
Exhibit 1. The NeuroStar segment exhibited a Q2 FY22 return on cost of 9.78% per system with a 70% YoY gain in revenue
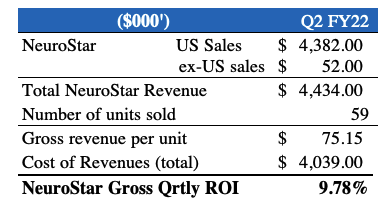
Note: Return calculated as NeuroStar revenue per system divided by Q2 COGS per system. (Image: HB Insights, Data: STIM 10-Q Q2 FY22)
Gross treatment session revenue was up 11% to $11.3mm underscored by more favourable customer utilization. This was seen as revenue per active site came in at $11,300 vs. $12,000 the year prior, as active sites reached 1,000 vs. 900 in FY21. Applying Q2 FY21 revenue to the latest quarter’s active sites, revenue per site decreases 440bps to $10,800. In addition, overall utilization increased ~700bps YoY, as per click utilization stretched up 15%.
Moving down the P&L, gross margin contracted ~600bps YoY due to the increase in capital expenditure towards NeuroStar, whereas GAAP operating expenses came in at $22.1mm for the quarter. Much of this stemmed from an increased sales and marketing (“S&M”) spend to $13.68mm and R&D expenditure of ~$2mm, down on the year. Meanwhile, it brought this down to a net loss of $10.4mm for the quarter and a loss of $0.39 per share, down from the Q2 FY21 loss per share of $0.29.
Quarterly return on investment
Several adjustments must be made to STIM’s GAAP earnings, however, in order to understand the total amount of investment it made and its cash earnings. We note the $2mm in R&D spend and c.$13.7mm in Sales & Marketing that is expensed on the income statement under GAAP accounting principles. However, these are arguably investments and should be treated as such. As much is reflected by the company itself – per STIM’s Q2 FY22:
“Sales and marketing expenses consist of market research and commercial activities related to the sale of our NeuroStar Advanced Therapy Systems and Treatment Sessions…Other significant sales and marketing costs include conferences and trade shows, promotional and marketing activities, including direct and online marketing, practice support programs and radio media campaigns, travel and training expenses.”
Regarding the quarterly increase in S&M:
“The increase was expected and primarily due to new marketing initiative related costs, including trade shows, digital paid media costs and market research, and sales personnel expenses…incurred in the current period versus the prior year quarter.”
Consequently, adjusting for these values gives us a clearer picture on how much the company invested and where. As seen in Exhibit 2, we capitalized 100% of R&D and 100% of the S&M expenditure as we argue these are investments allocated to create future economic value, versus maintenance SG&A. Moreover, under IFRS accounting rules, this process is encouraged. Doing so results in $15.7mm in OPEX removed from the income statement and treated as an intangible asset [we assume 5-year useful life with straight-line amortization]. Meanwhile, earnings adjust up in the black to $0.18 per share.
Exhibit 2. It is fair and reasonable to treat $15.7mm in OPEX from Sales & Marketing and R&D as an investment vs. expenditure, as the spend was made to derive future economic value vs. operations
This results in a substantial upturn in net income to nearly $4.9mm and produces cash earnings of $0.20 per share
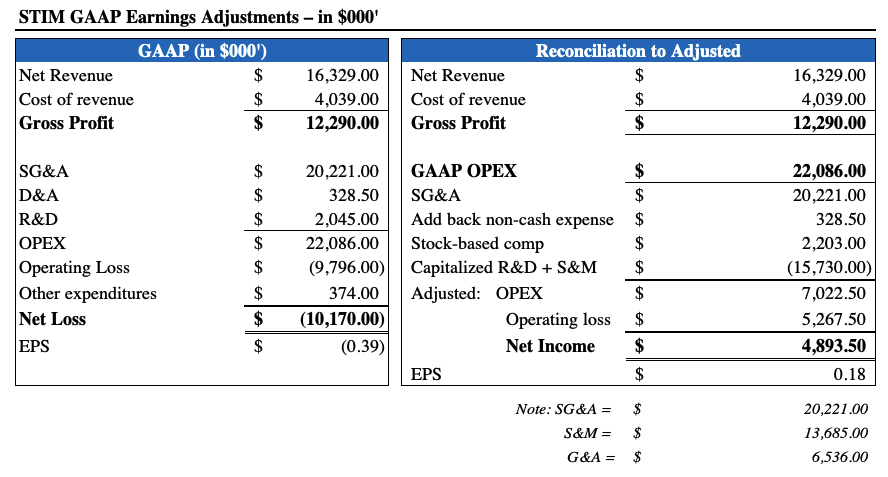
Data: HB Insights Estimates
Subsequently we estimate STIM invested total capital of $93.94mm during the quarter, versus a GAAP reported $78.2mm invested capital [20% increase]. With the corresponding earnings adjustments outlined above, we calculate the company generated quarterly [adjusted] NOPAT of $5.26mm, meaning it delivered a return on invested capital of ~560bps [24.2% annualized]. Free cash flow was a negative $88mm from these adjusted values, however, the negative FCF is desirable seeing the high annualized ROIC that comfortable surpasses STIM’s WACC of c.8%.
Valuation
As seen in Exhibit 3, shares are trading at 1.37x book value at the current market capitalization. The market has also priced SIM at ~1.5x forward sales, and on our FY22 revenue estimates of ~$61.5mm, this sets a price target of $3.45, in range with the current market price. Furthermore, following the adjustments outlined in the section above, we’d be paying an implied price of $4.28 per share at a 1.37x multiple. This is overpriced, particularly when forward-looking price targets are priced below this mark.
Exhibit 3. Following adjustments above, we’d be paying quite a premium to the current market price.
This is unsupported by forward-looking price targets, which suggest the market consensus may have priced STIM appropriately.
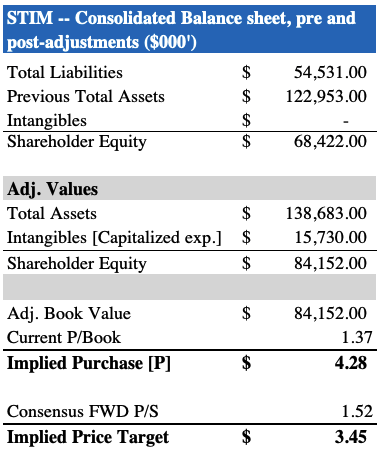
Data: HB Insights Estimates
Considering these points we believe that Neuronetics is appropriately priced at its current market price. We note the recent FDA approval of the company’s D-Tect MT Accessory product that’s intended to be used with NeuroStar, albeit in treating depression. However, the market’s response to this was mute, implying the upside has been adequately priced in. Shares are trading in range with our price target, supporting a neutral view. We rate STIM a hold with a $3.45 per share valuation.
Be the first to comment