

PM Images
I recently wrote an article reviewing Oxford Lane Capital (NASDAQ:OXLC). Although my conclusion was to be cautious on Oxford Lane, the article did prompt a lot of comments discussing the merits of OXLC’s high cash distribution and whether CLO Equity investments were really that risky. This prompted me to look into the space in more detail.
In this article, I will take a look at Eagle Point Credit Company (NYSE:ECC), another Closed End Fund (“CEF”) focused on CLO Equity investments. I will compare between ECC and OXCL. Finally, I will provide additional thoughts on CLO Equity investments in general.
My thoughts on Eagle Point mirrors my conclusions on Oxford Lane. While I think the current distribution yield is attractive, I am staying away from both ECC and OXLC as I believe we are in the early stages of a credit deterioration cycle. Also, an equivalent income stream can be created with low cost vanilla funds that may offer better return and risk characteristics than high yielding CEFs with NAV declines.
I would consider CLO Equity funds like OXLC and ECC as a credit recovery play if high yield spreads were to widen to 8% and the Federal Reserve has stopped tightening financial conditions.
ECC Fund Overview
As mentioned above, Eagle Point Credit Company is a CEF that primarily invests in the equity tranches of Collateralized Loan Obligations (“CLO”). ECC currently has an equity market cap of $515 million, a slight premium to the July 31’st NAV estimate of $485 million.
Strategy
Eagle Point’s strategy is to invest in a portfolio of CLO Equity tranches. A CLO is a collection of bank loans that have been packaged, securitized, and tranched (Figure 1). The securitization and tranching allows AAA-rated securities to be created from underlying loans that may not be AAA themselves. This gives risk-averse investors like banks and insurers a broader universe of highly rated securities to invest in, while risk-seeking investors can choose to invest in the riskier equity tranches. Investors who wish to learn more about CLOs are encouraged to do their research online, for example, here.
Figure 1 – CLO structure (corporatefinanceinstitute.com)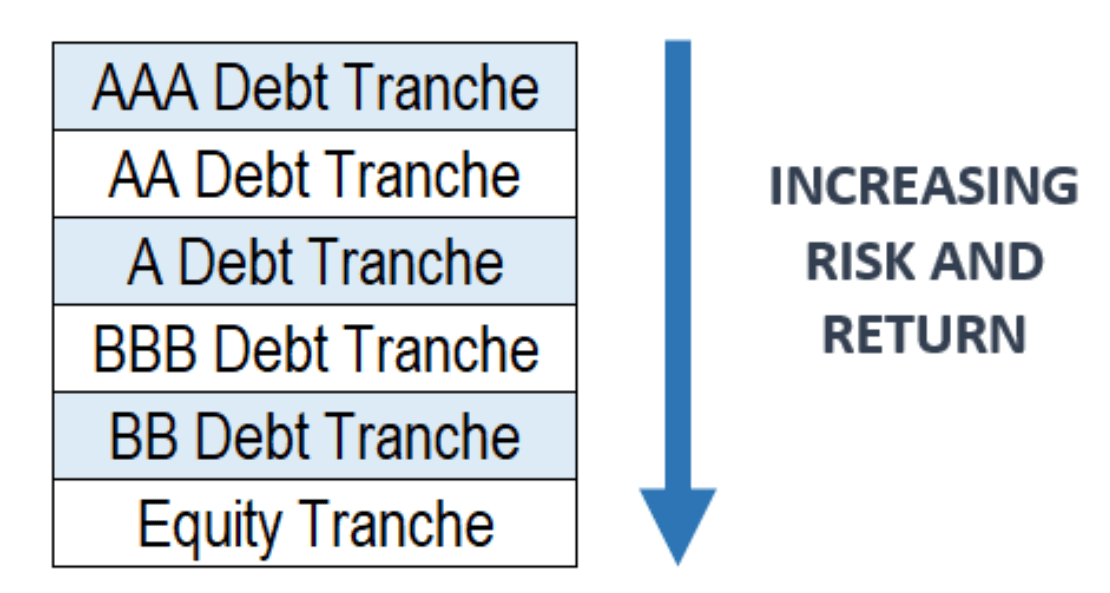
From a database of CLO 1.0 returns (CLOs issued from 2002 to 2011), ECC management notes that only 4% of CLOs have had negative equity returns (Figure 2). As the senior loans within the CLOs are floating rate, they also provide some degree of protection against inflation.
Figure 2 – CLO rationale (ECC investor presentation)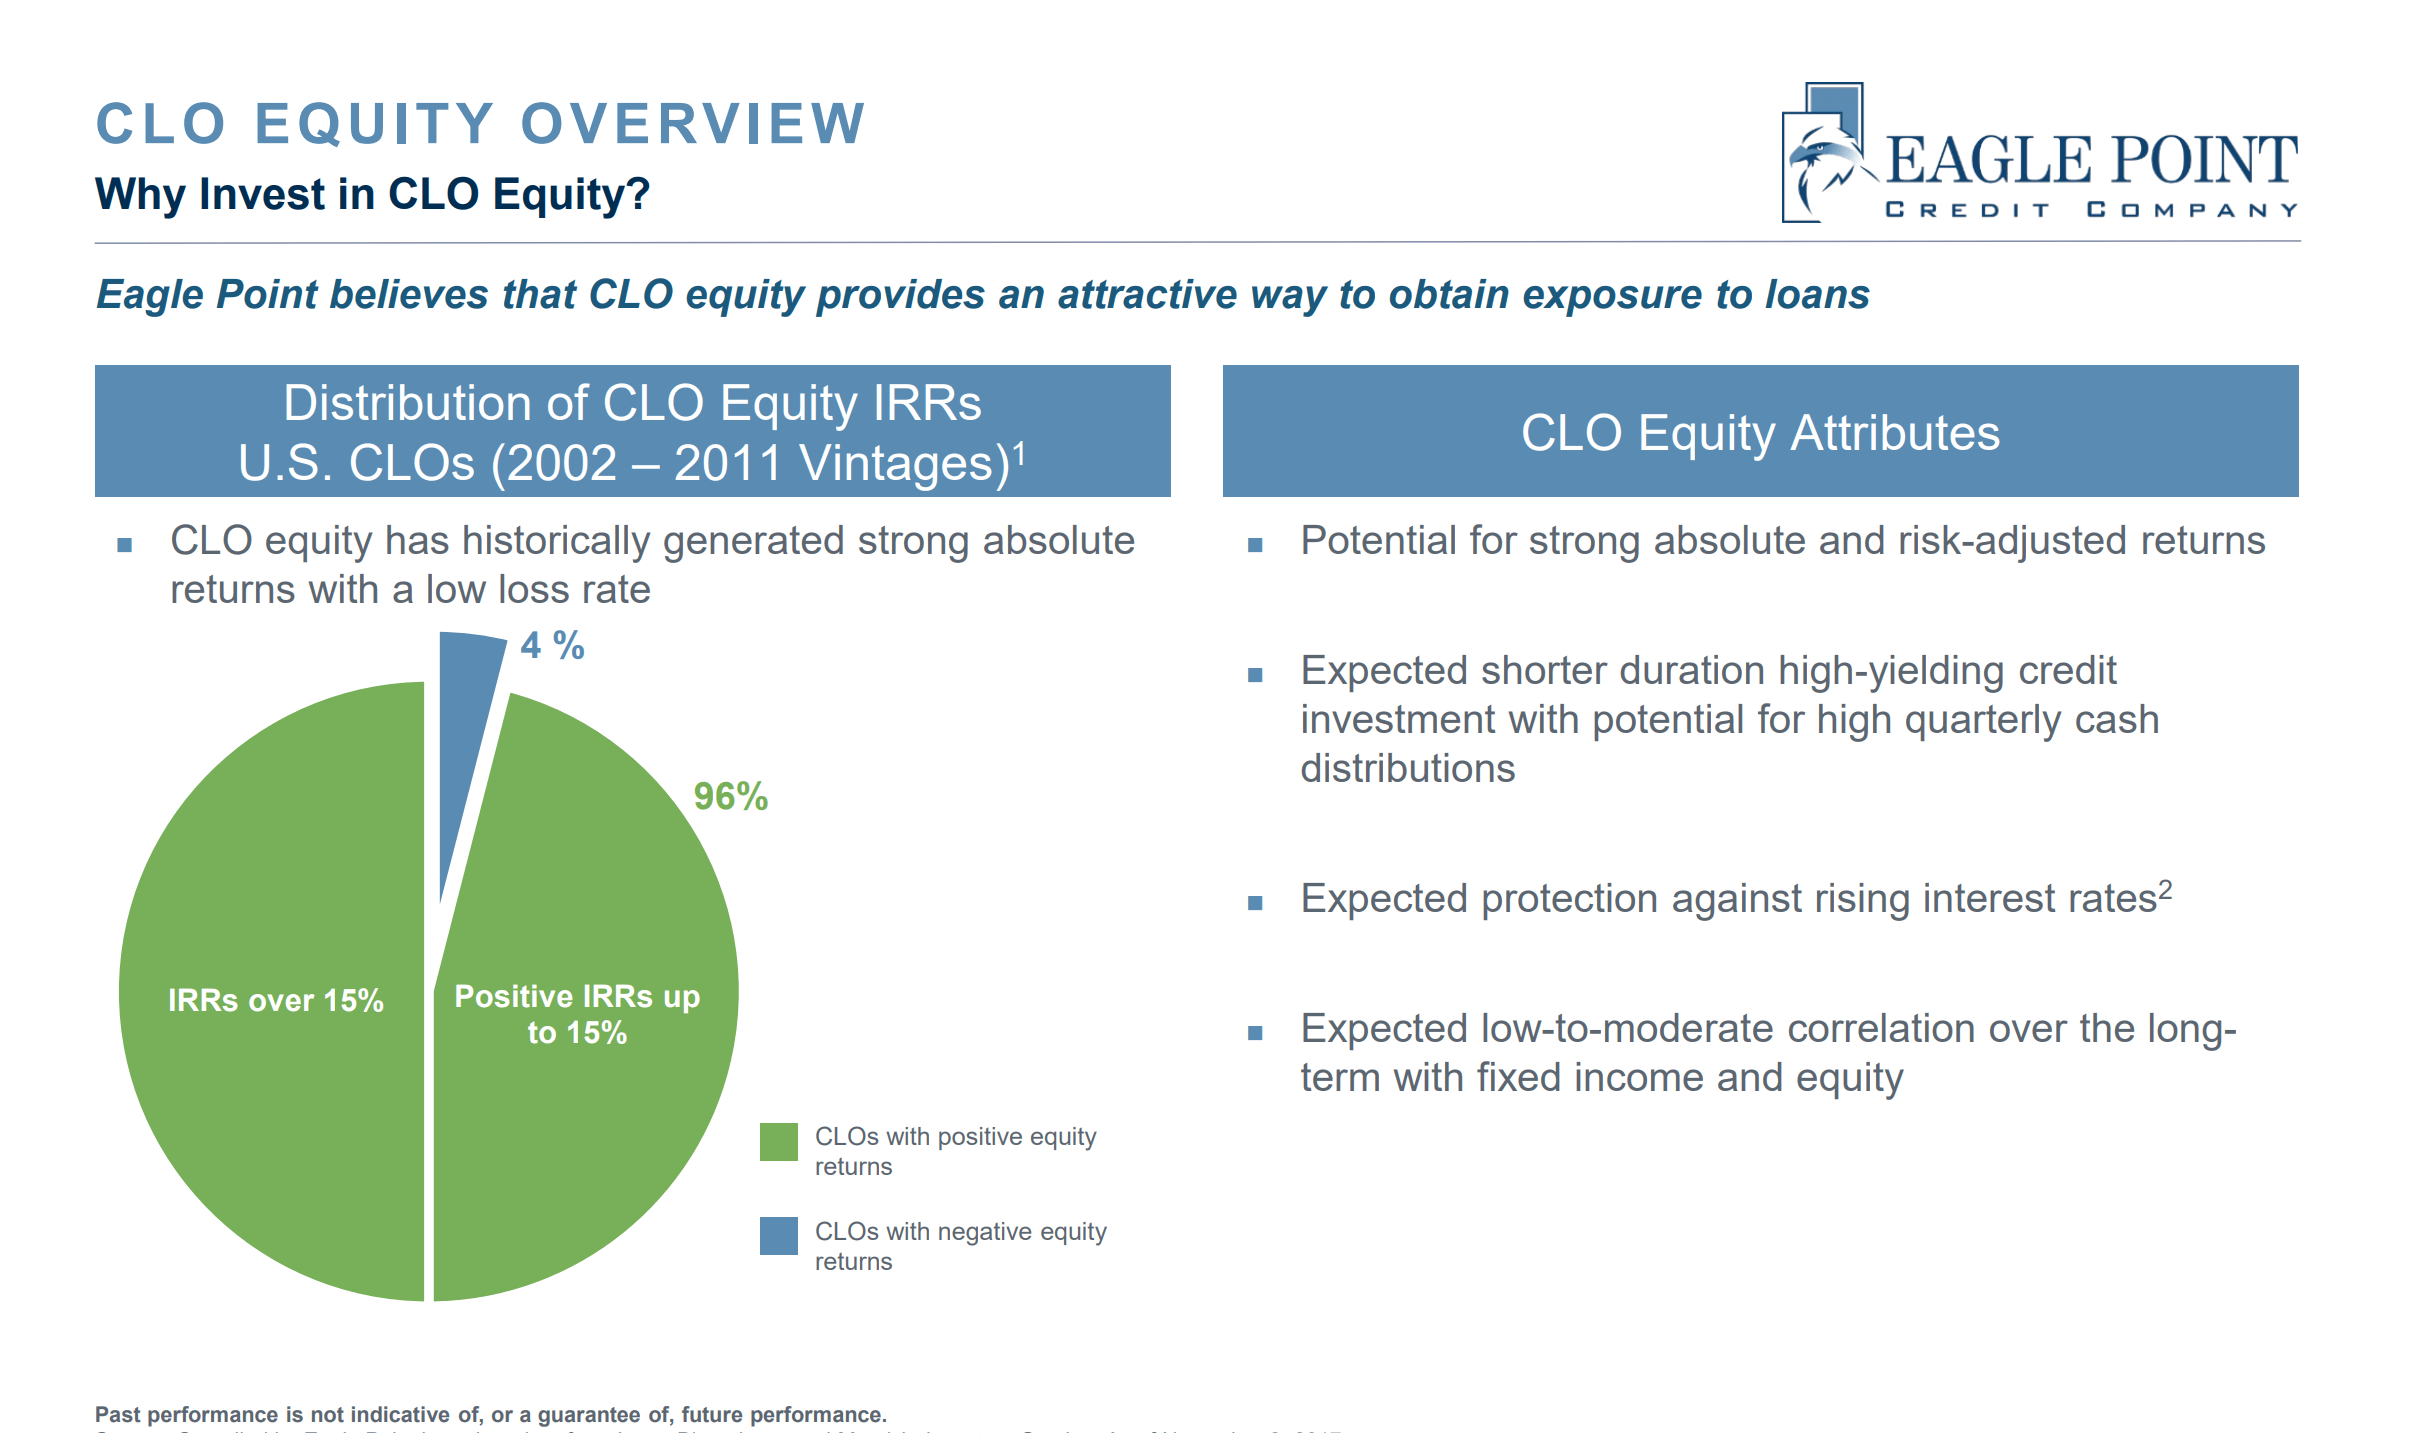
Strong historical returns and insatiable investor demand for the highly rated CLO tranches have created a massive market for CLOs. From less than $300 billion before the Great Financial Crisis (“GFC”), the U.S. CLO market is now almost $1 trillion in size (Figure 3).
Figure 3 – CLO Equity Overview (ECC investor presentation)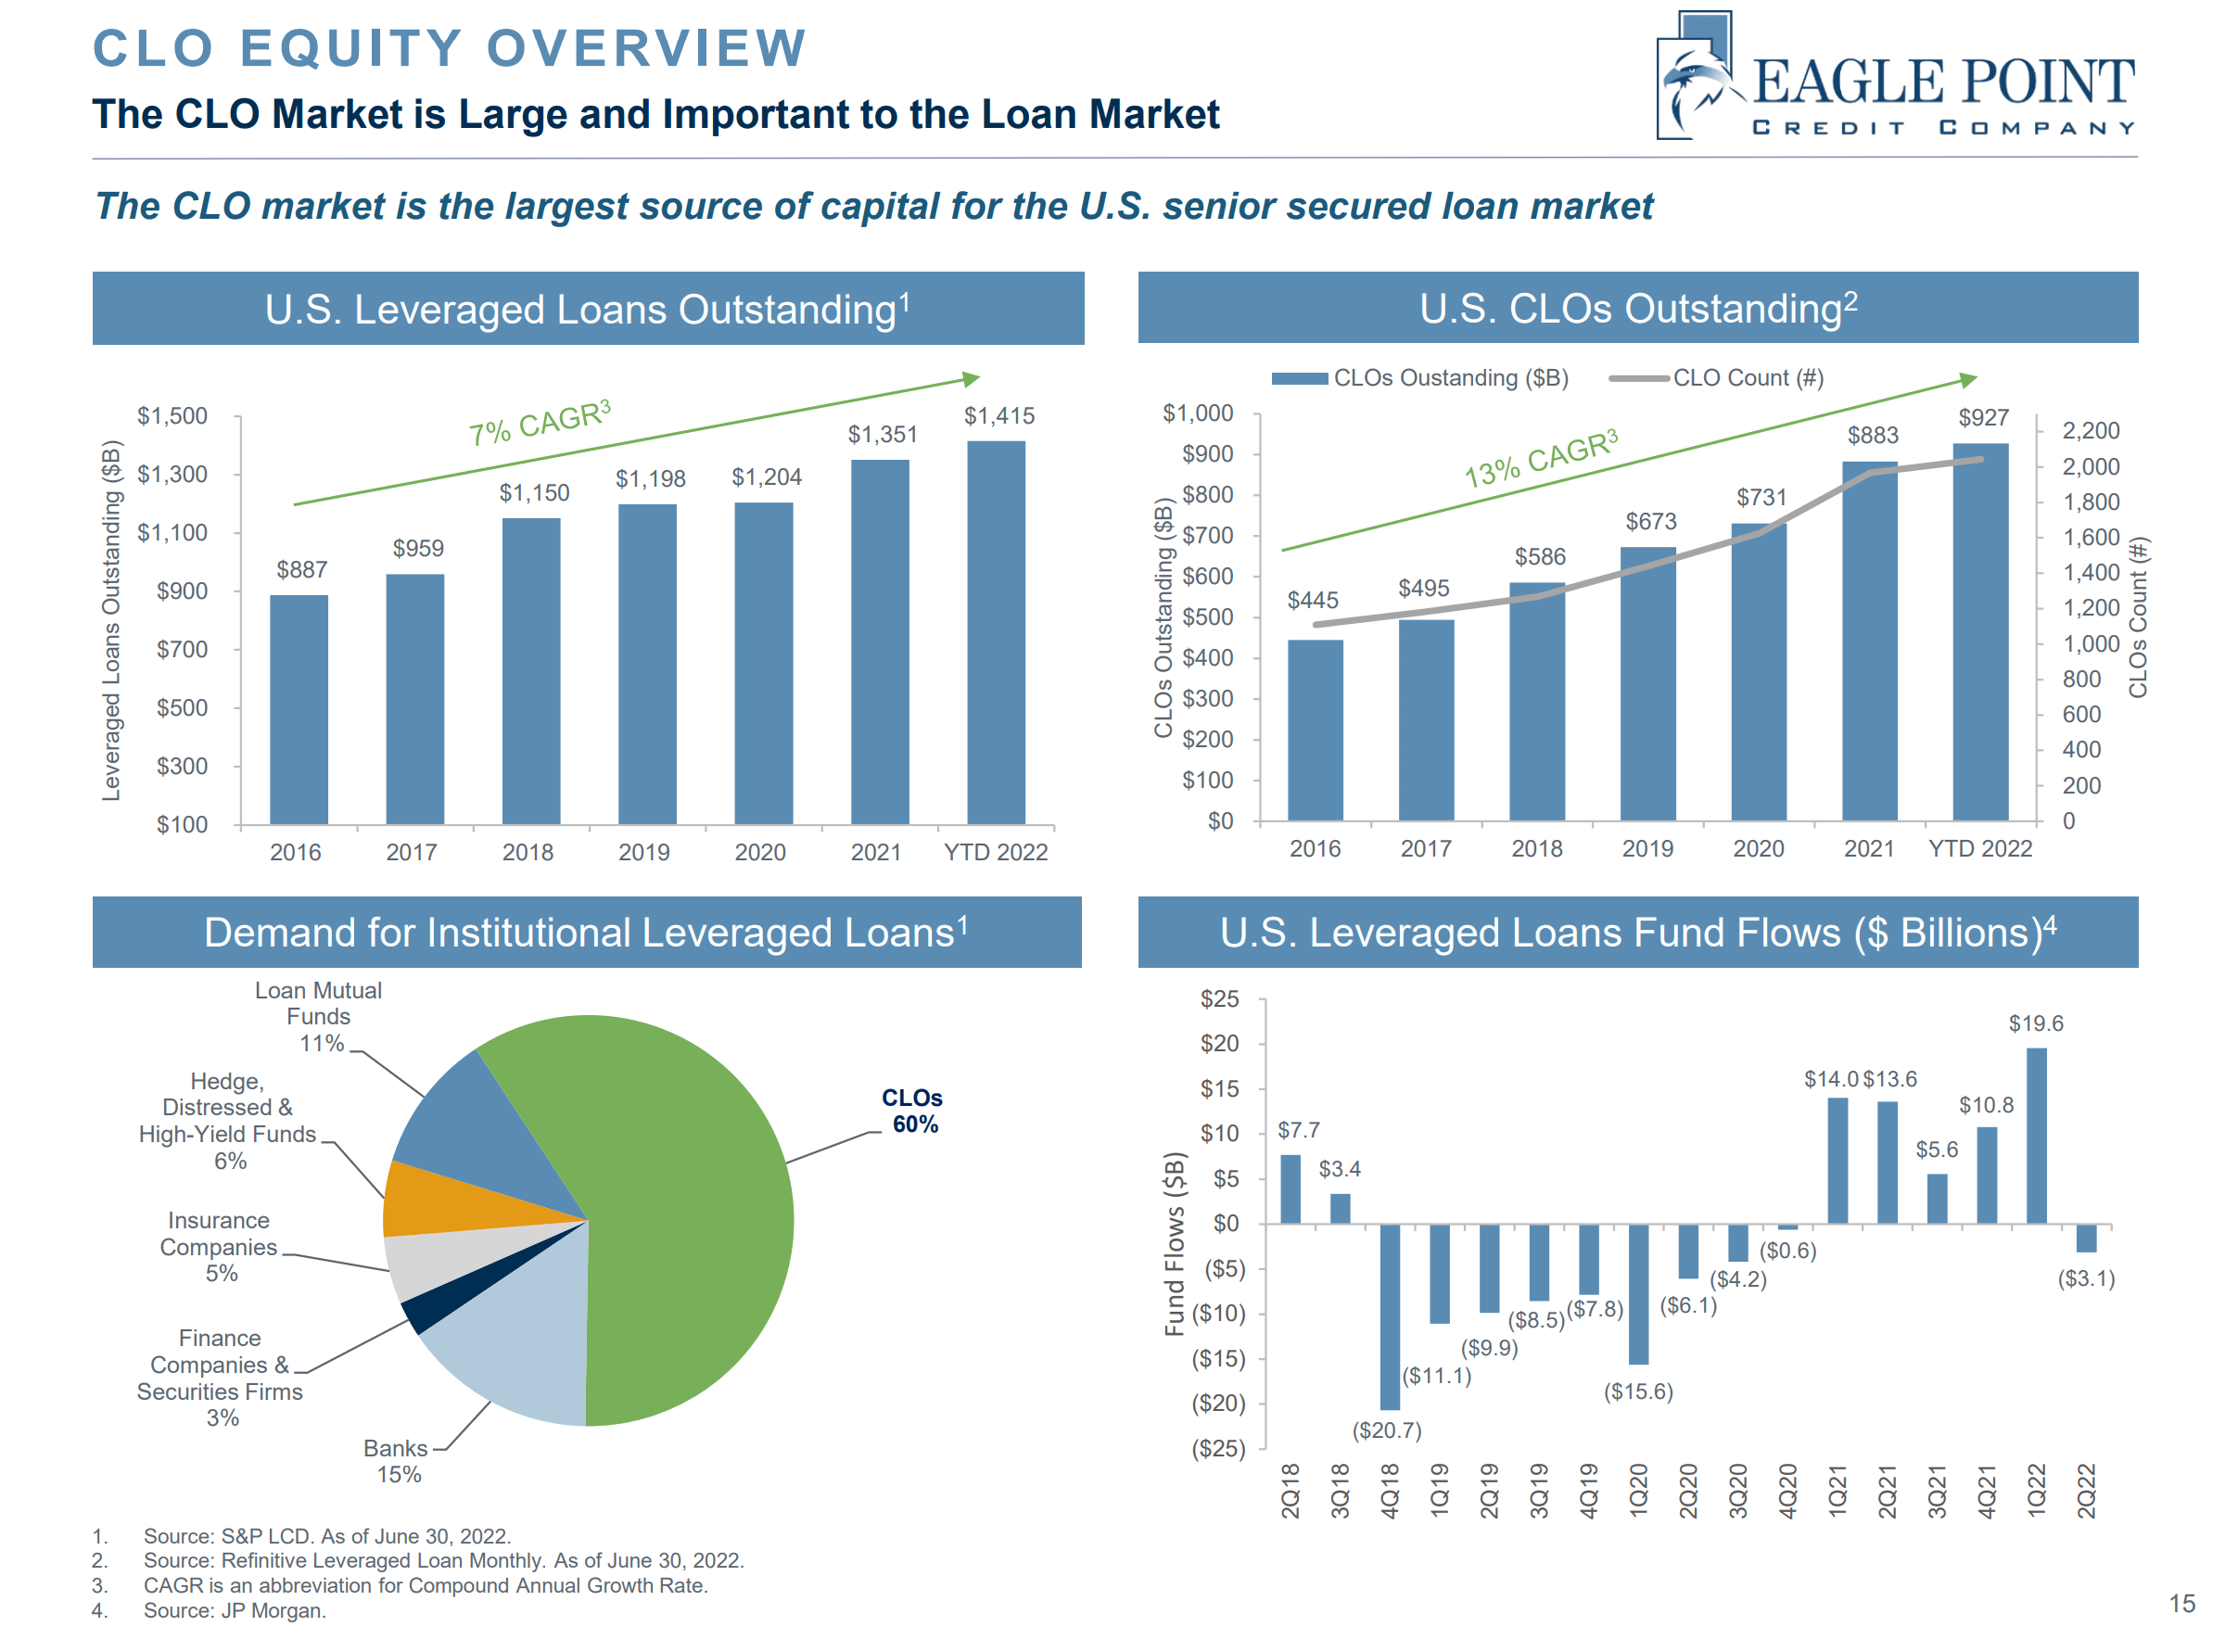
ECC Portfolio Holdings
CLOs are managed by external CLO managers, so it’s hard for investors of Eagle Point to gauge the actual underlying exposures. From the most recent quarterly presentation, we know that Eagle Point has investments in over 120 different CLO Equity tranches with total value of $566 million, and 22 CLO Debt tranches with total value of $48 million (Figure 4).
Figure 4 – ECC CLO portfolio (ECC investor presentation)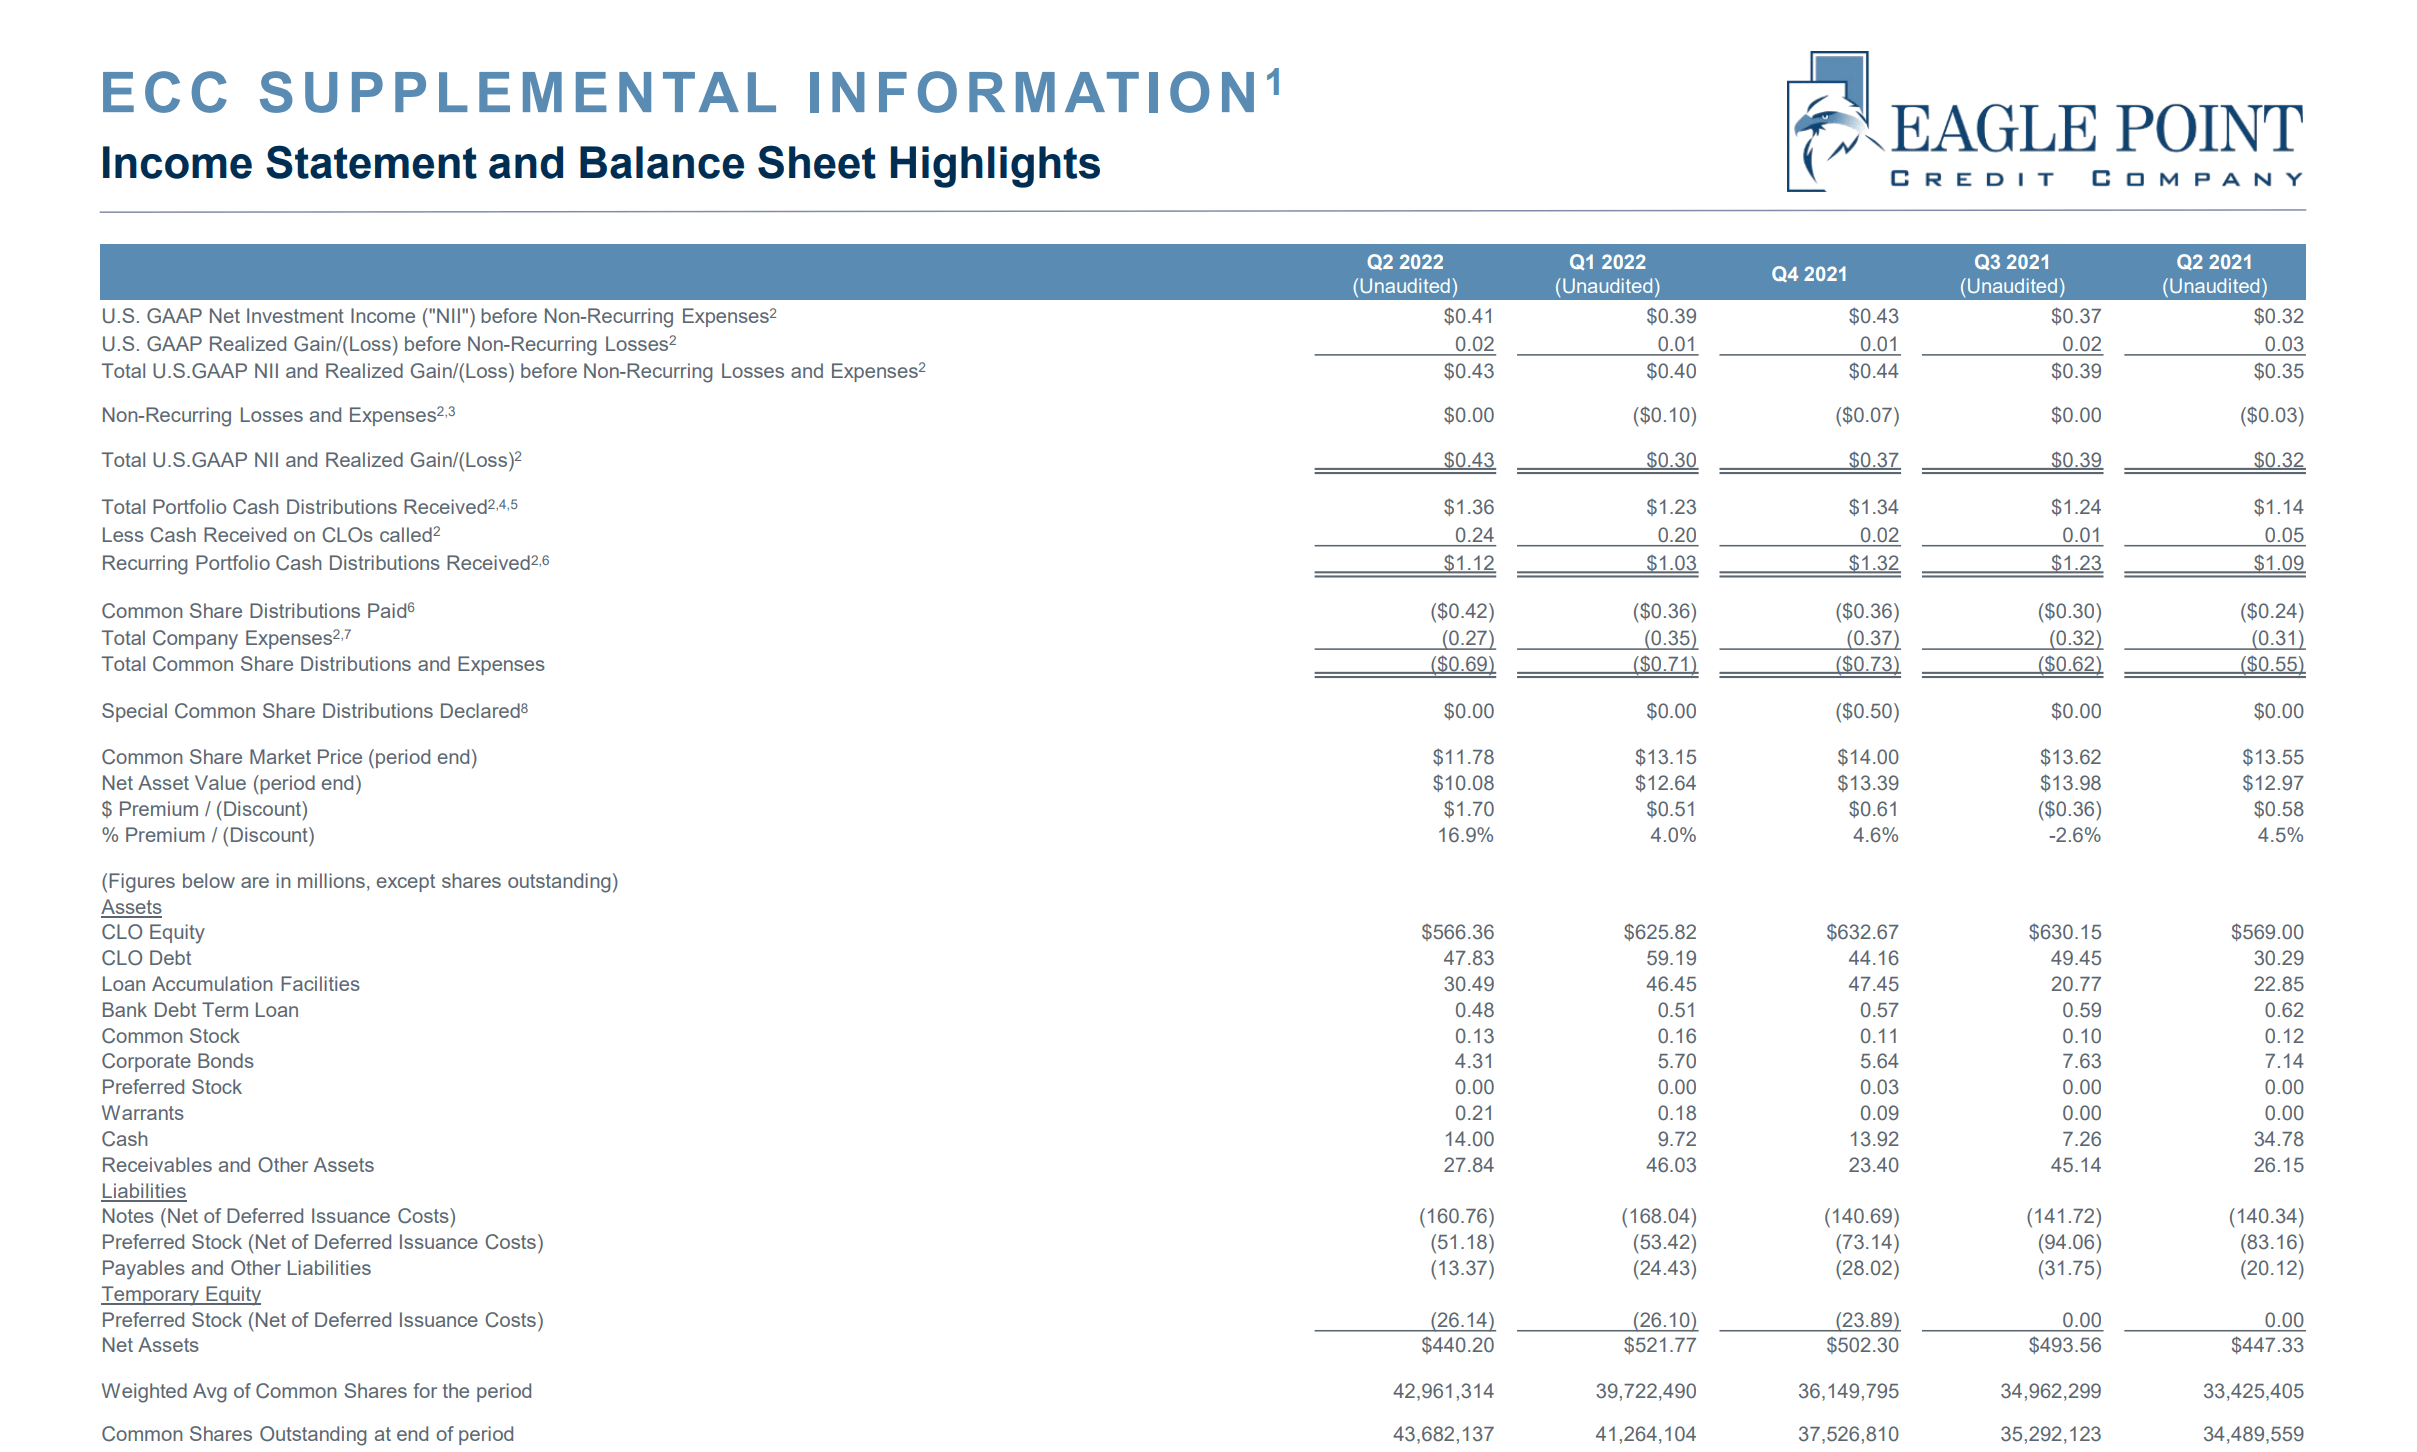
Additional portfolio metrics are shown in Figure 5 below. The Eagle Point portfolio is 86% invested in CLO Equity tranches, with over 1,800 unique underlying obligors and the largest individual obligor at 0.83% of the portfolio.
Figure 5 – ECC Portfolio statistics (ECC investor presentation)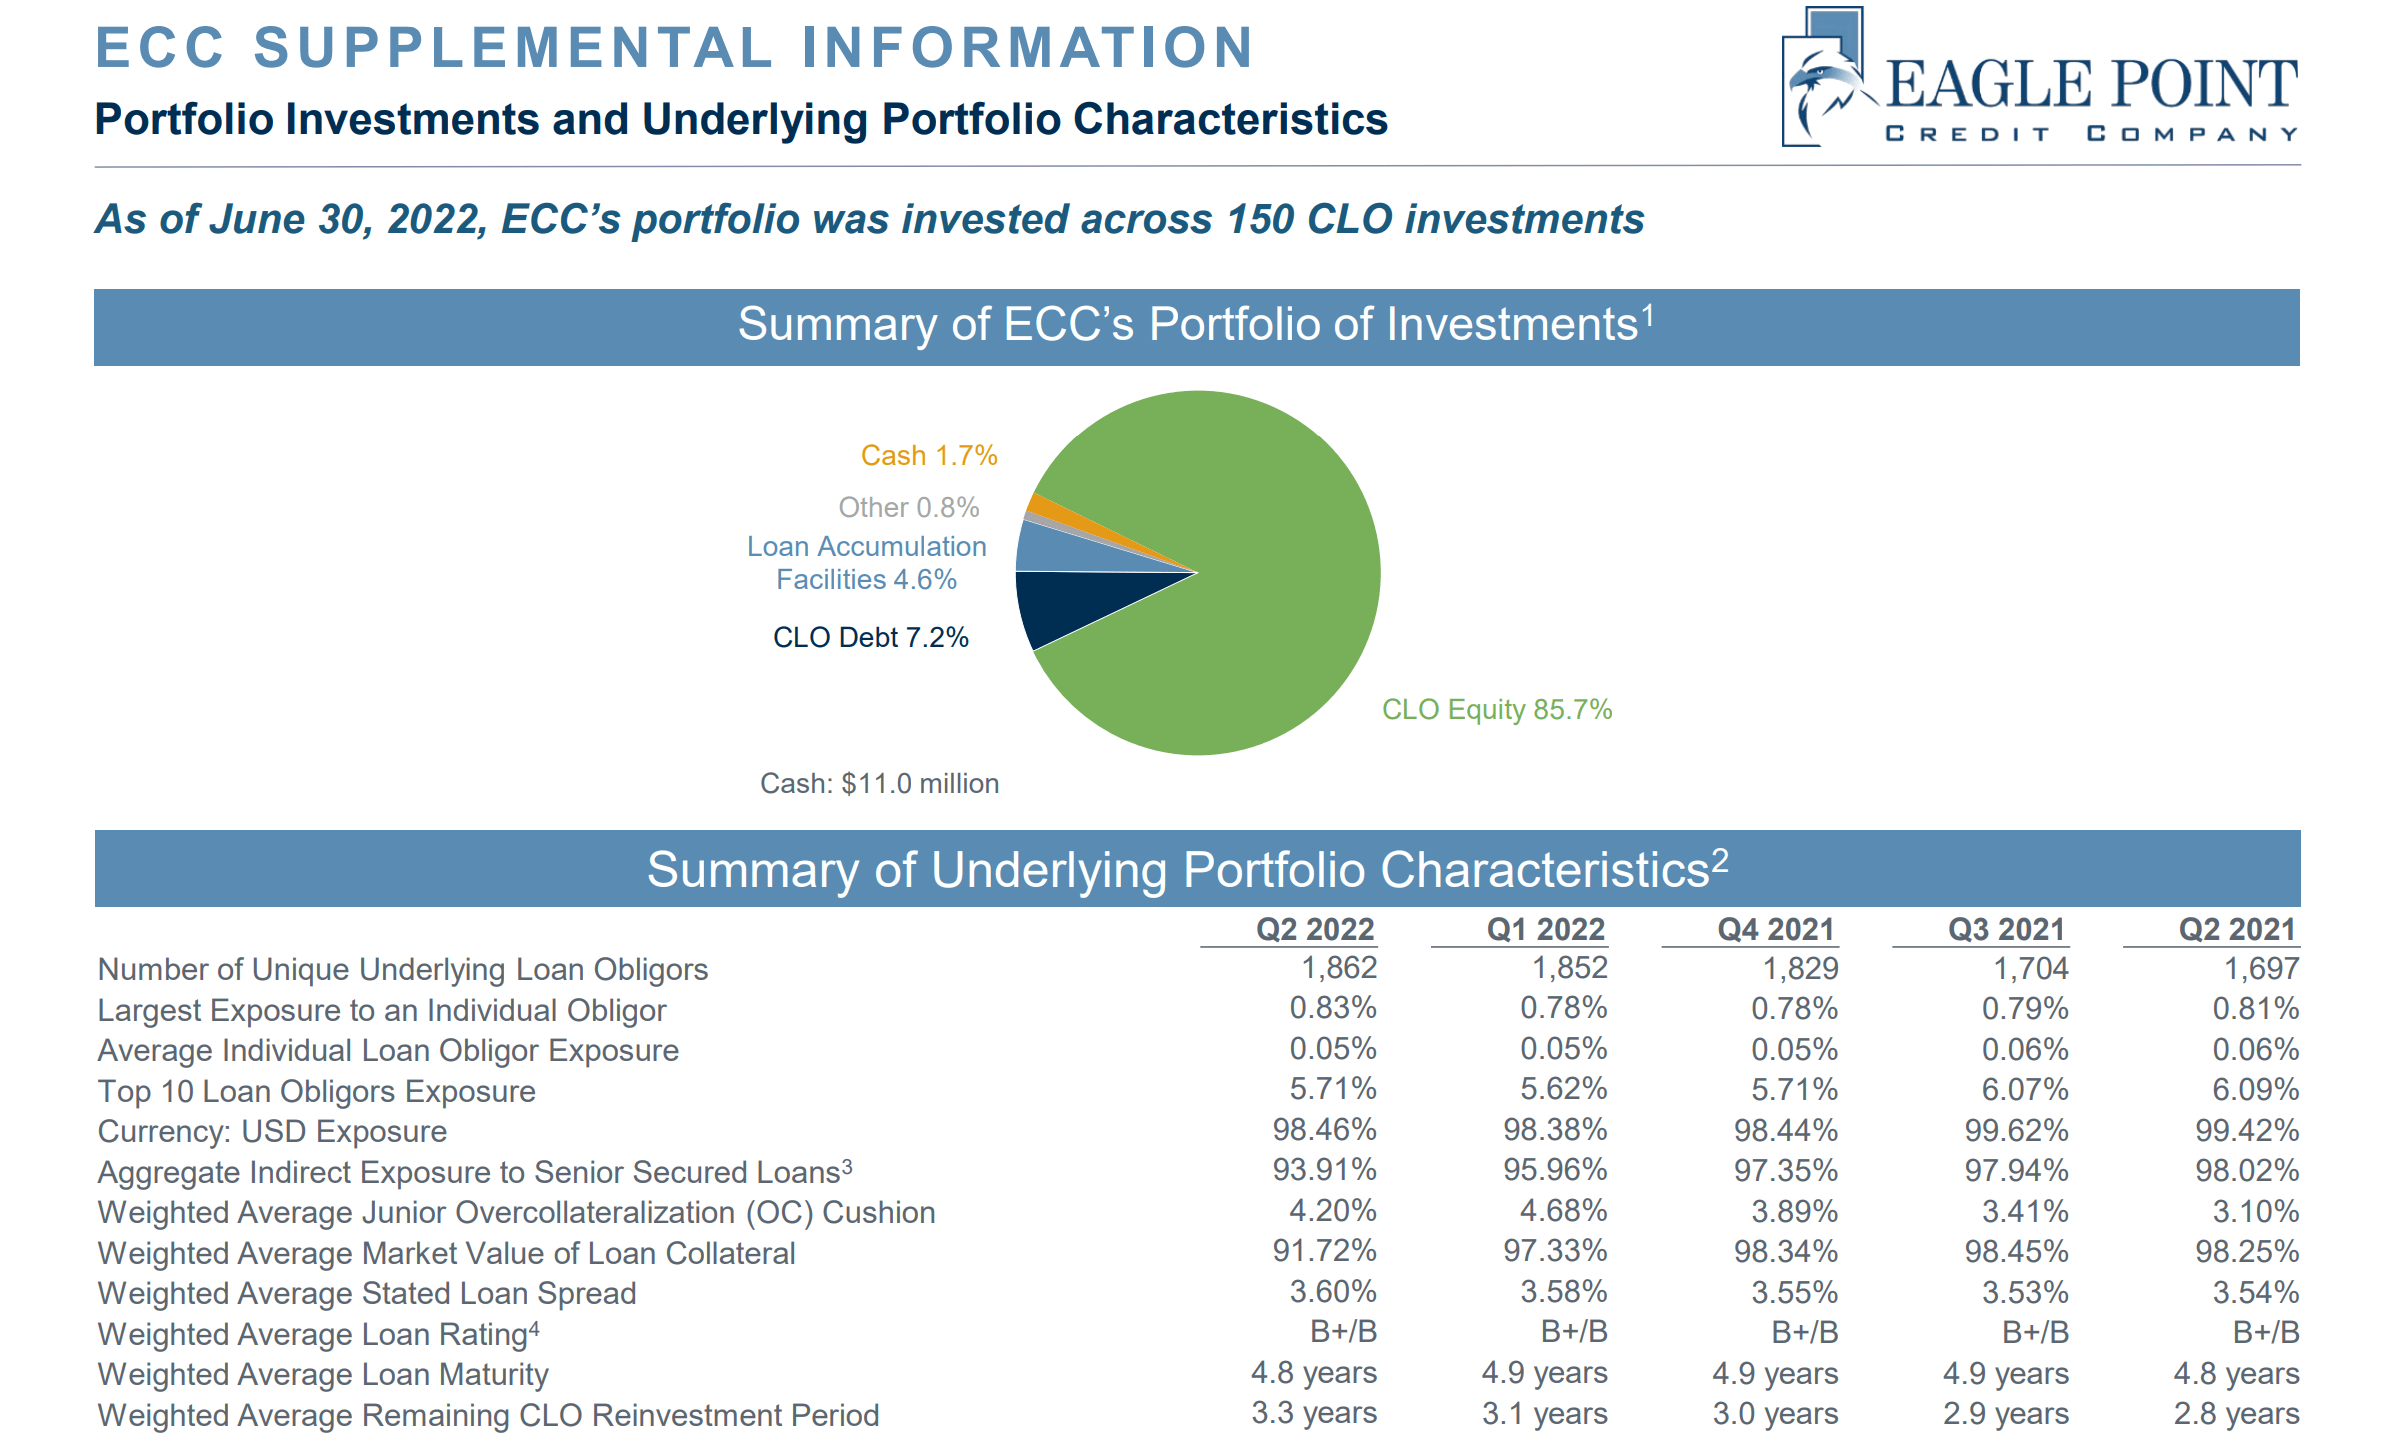
Figure 6 shows ECC’s top ten individual obligors and sector breakdown.
Figure 6 – ECC top 10 obligors and sectors (ECC investor presentation)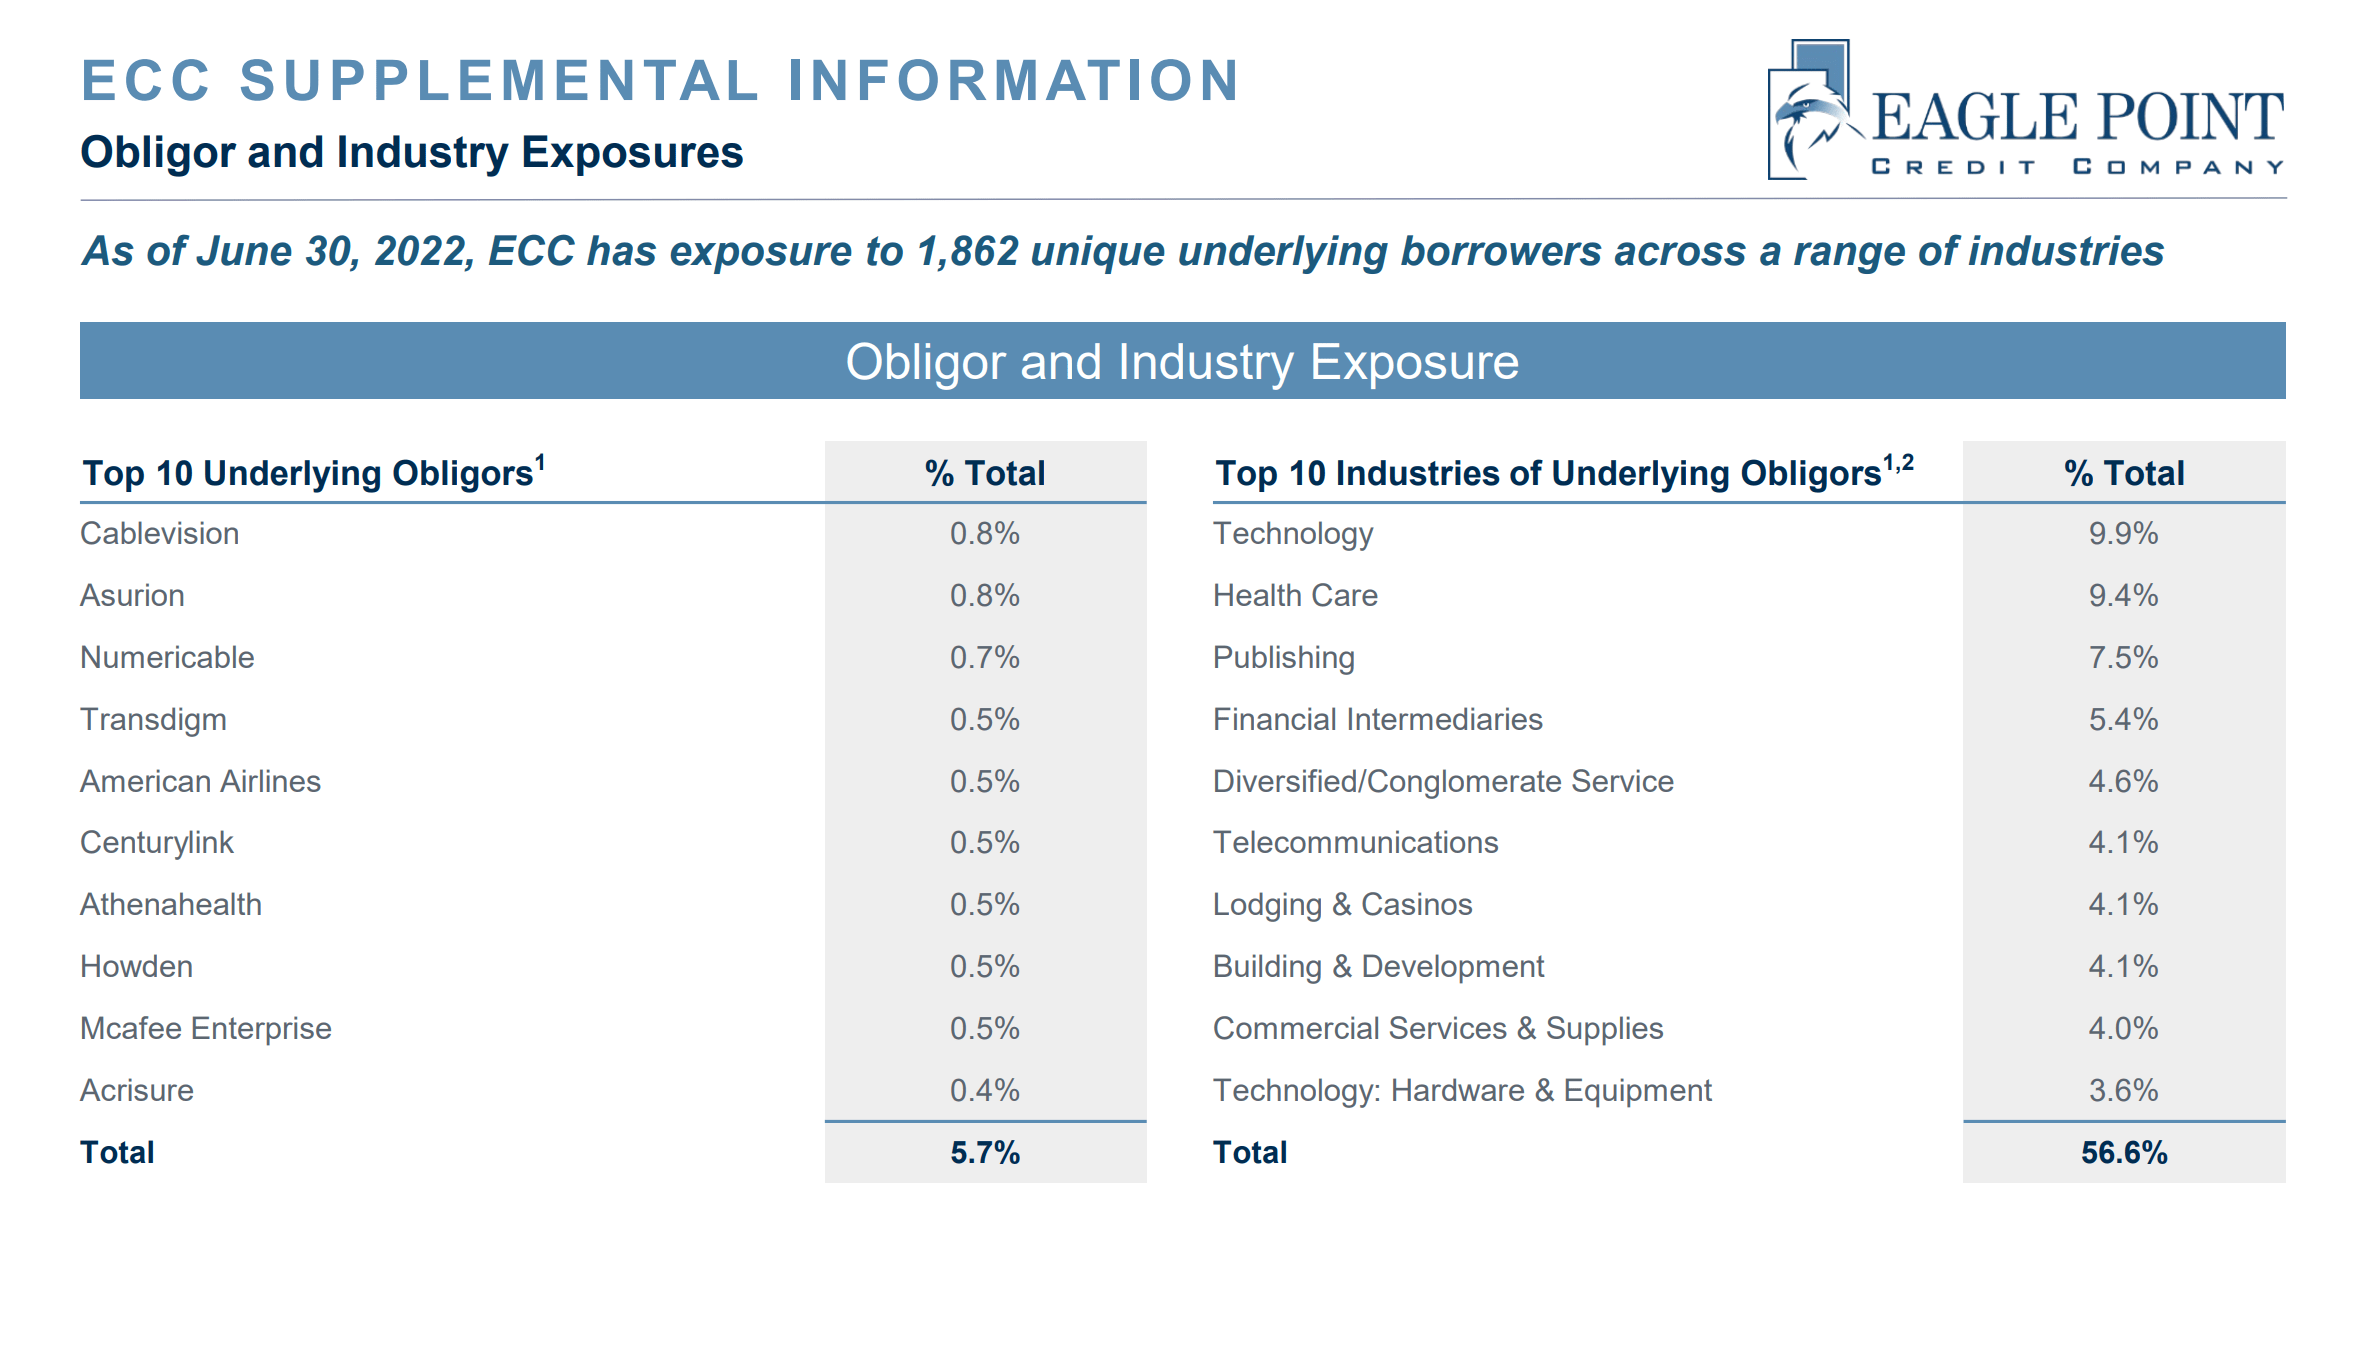
ECC Returns
Figure 7 is excerpted from ECC’s 2021 annual report. It shows ECC has generated 5-Yr annualized 11.1% returns, and 8.9% annualized returns since inception. Both numbers are better than the S&P BDC Index that ECC chooses to be compared to.
Figure 7 – ECC Historical returns (ECC 2021 annual report)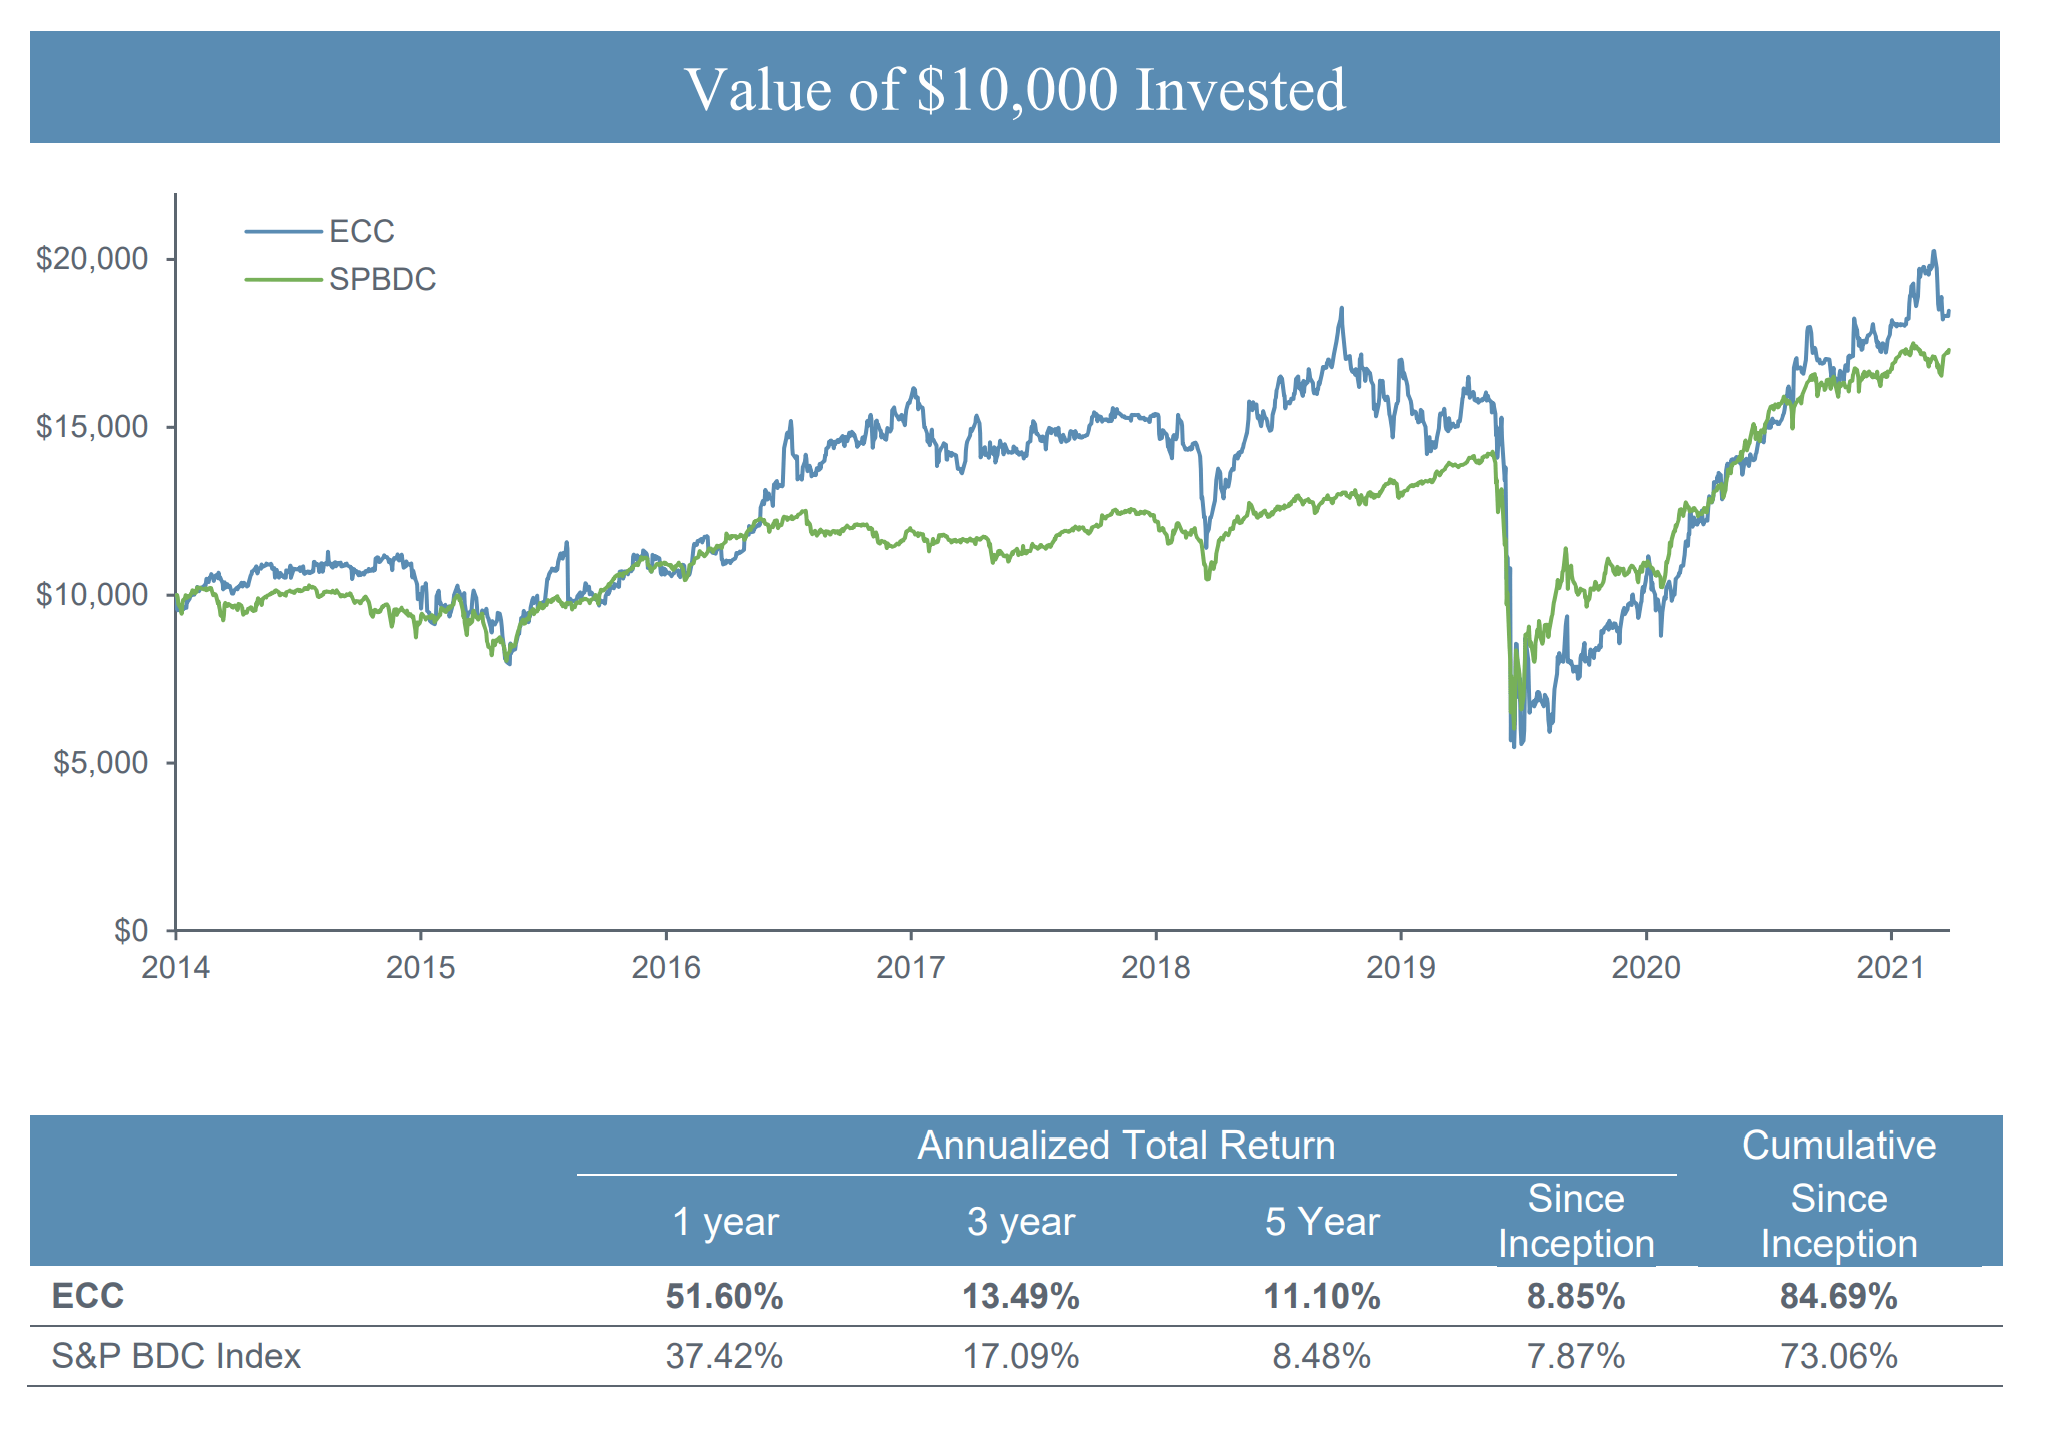
Similar to my comment on OXLC’s annual returns, ECC’s returns on a year-to-year basis can be quite lumpy. The fund did exceptionally well in 2016, 2020, and 2021, but poorly in 2015 and 2018. From Morningstar’s lens, we see ECC flips often between top quartile and bottom quartile in terms of returns versus the peer group (Figure 8).
Figure 8 – ECC vs. peers (morningstar.com)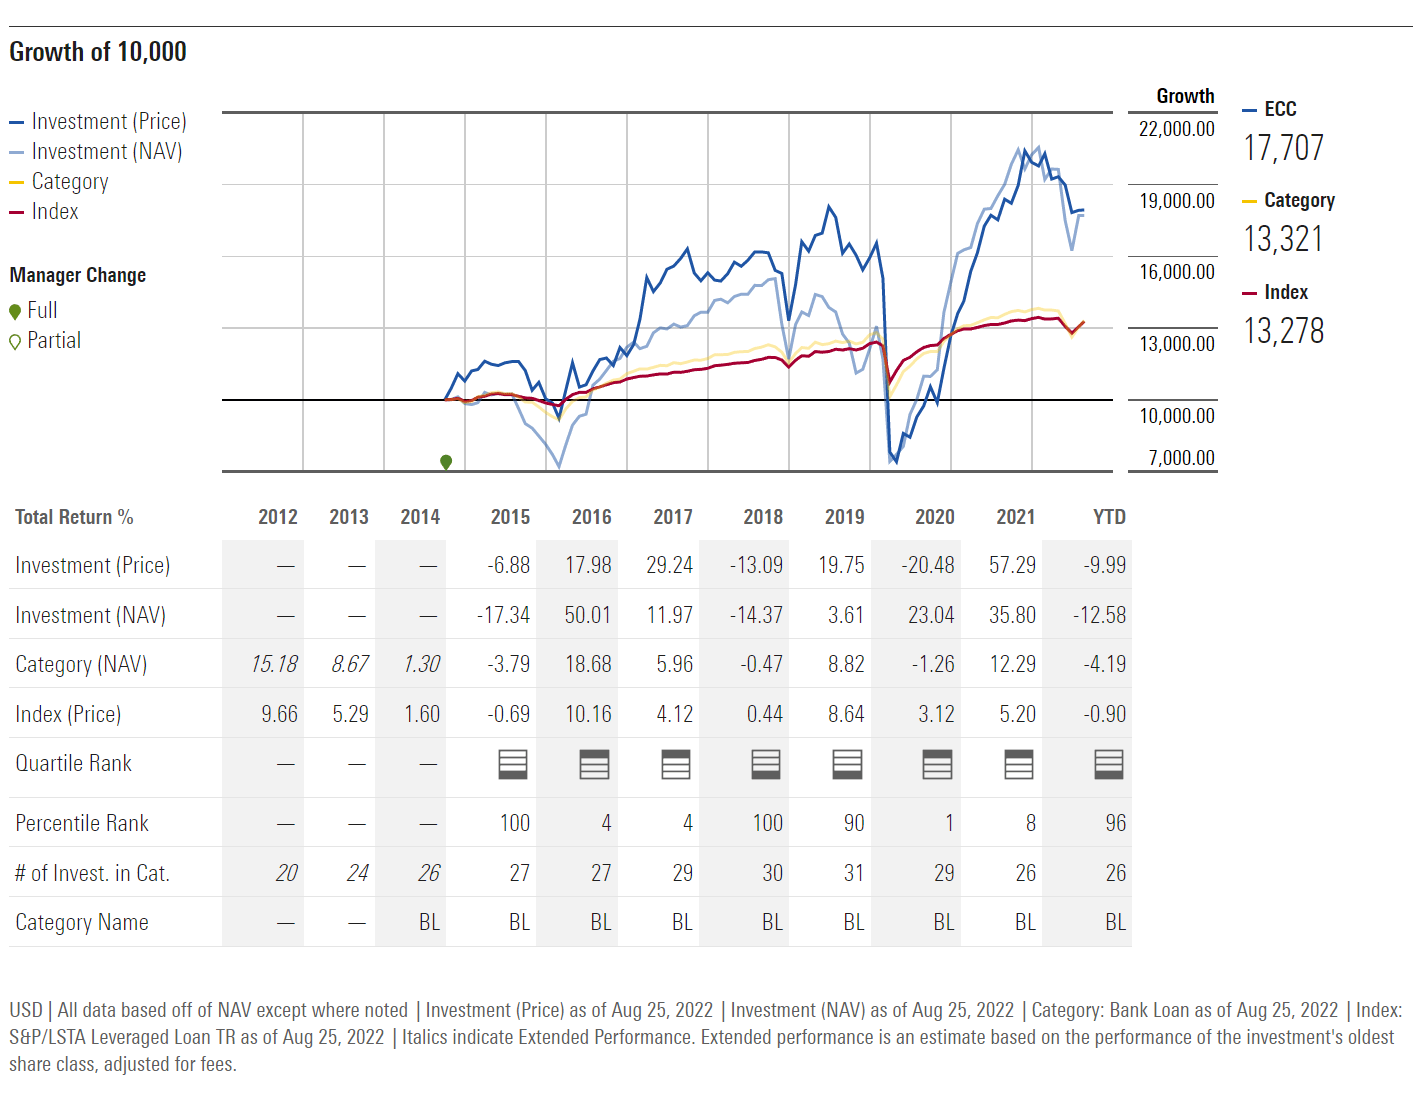
ECC Distribution & Yield
ECC is currently paying a $0.14 / month distribution, which works out to a 14.5% current yield. ECC also recently announced a special distribution of $0.25 to be paid on October 31, 2022 with an ex-dividend date of October 7th (Figure 9).
Figure 9 – ECC 2022 distributions (Eagle Point website)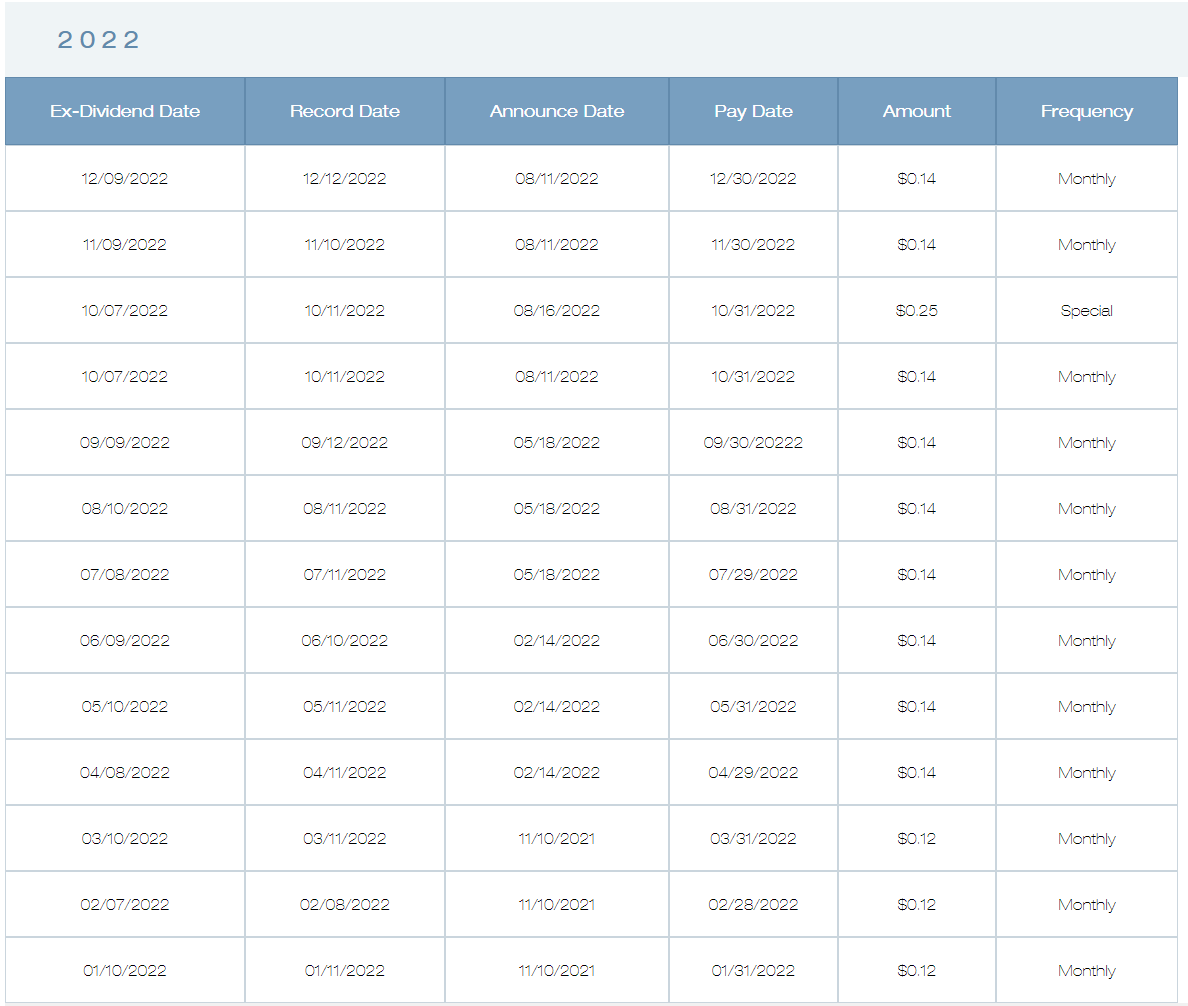
Historically, ECC has paid $15.76 in distributions to year-end 2021. Note, the monthly distribution was cut severely in 2020 from $0.20 to $0.08 as a result of the COVID-19 pandemic. It was later increased to $0.10 and $0.12 in 2021, along with a $0.50 special distribution at 2021 year-end. The monthly distribution was increased again to $0.14 earlier this year.
Figure 10 – ECC historical distributions (Seeking Alpha)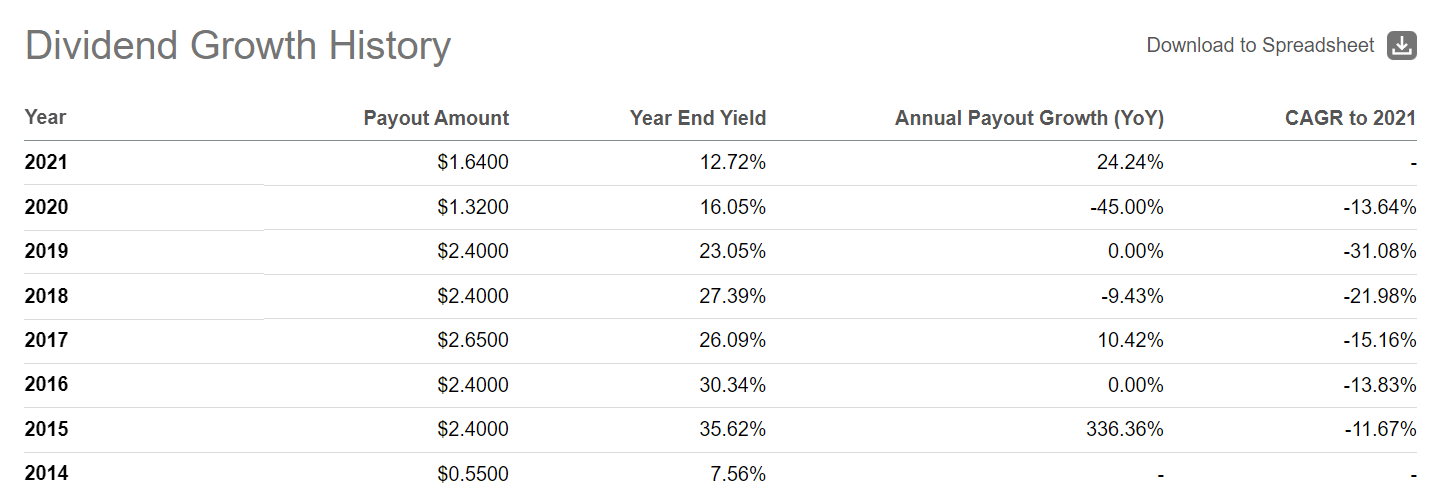
However, investors are cautioned about ECC’s distributions, as a lot of the distribution in recent years have been from ‘Return-of-Capital’ (“ROC”). Figure 11 shows summary financials from ECC’s 2021 annual report. It shows that ROC was $1.06, $1.00, $0.89 per share in 2020, 2019, and 2018 respectively.
Figure 11 – ECC Summary Financials (ECC 2021 annual report)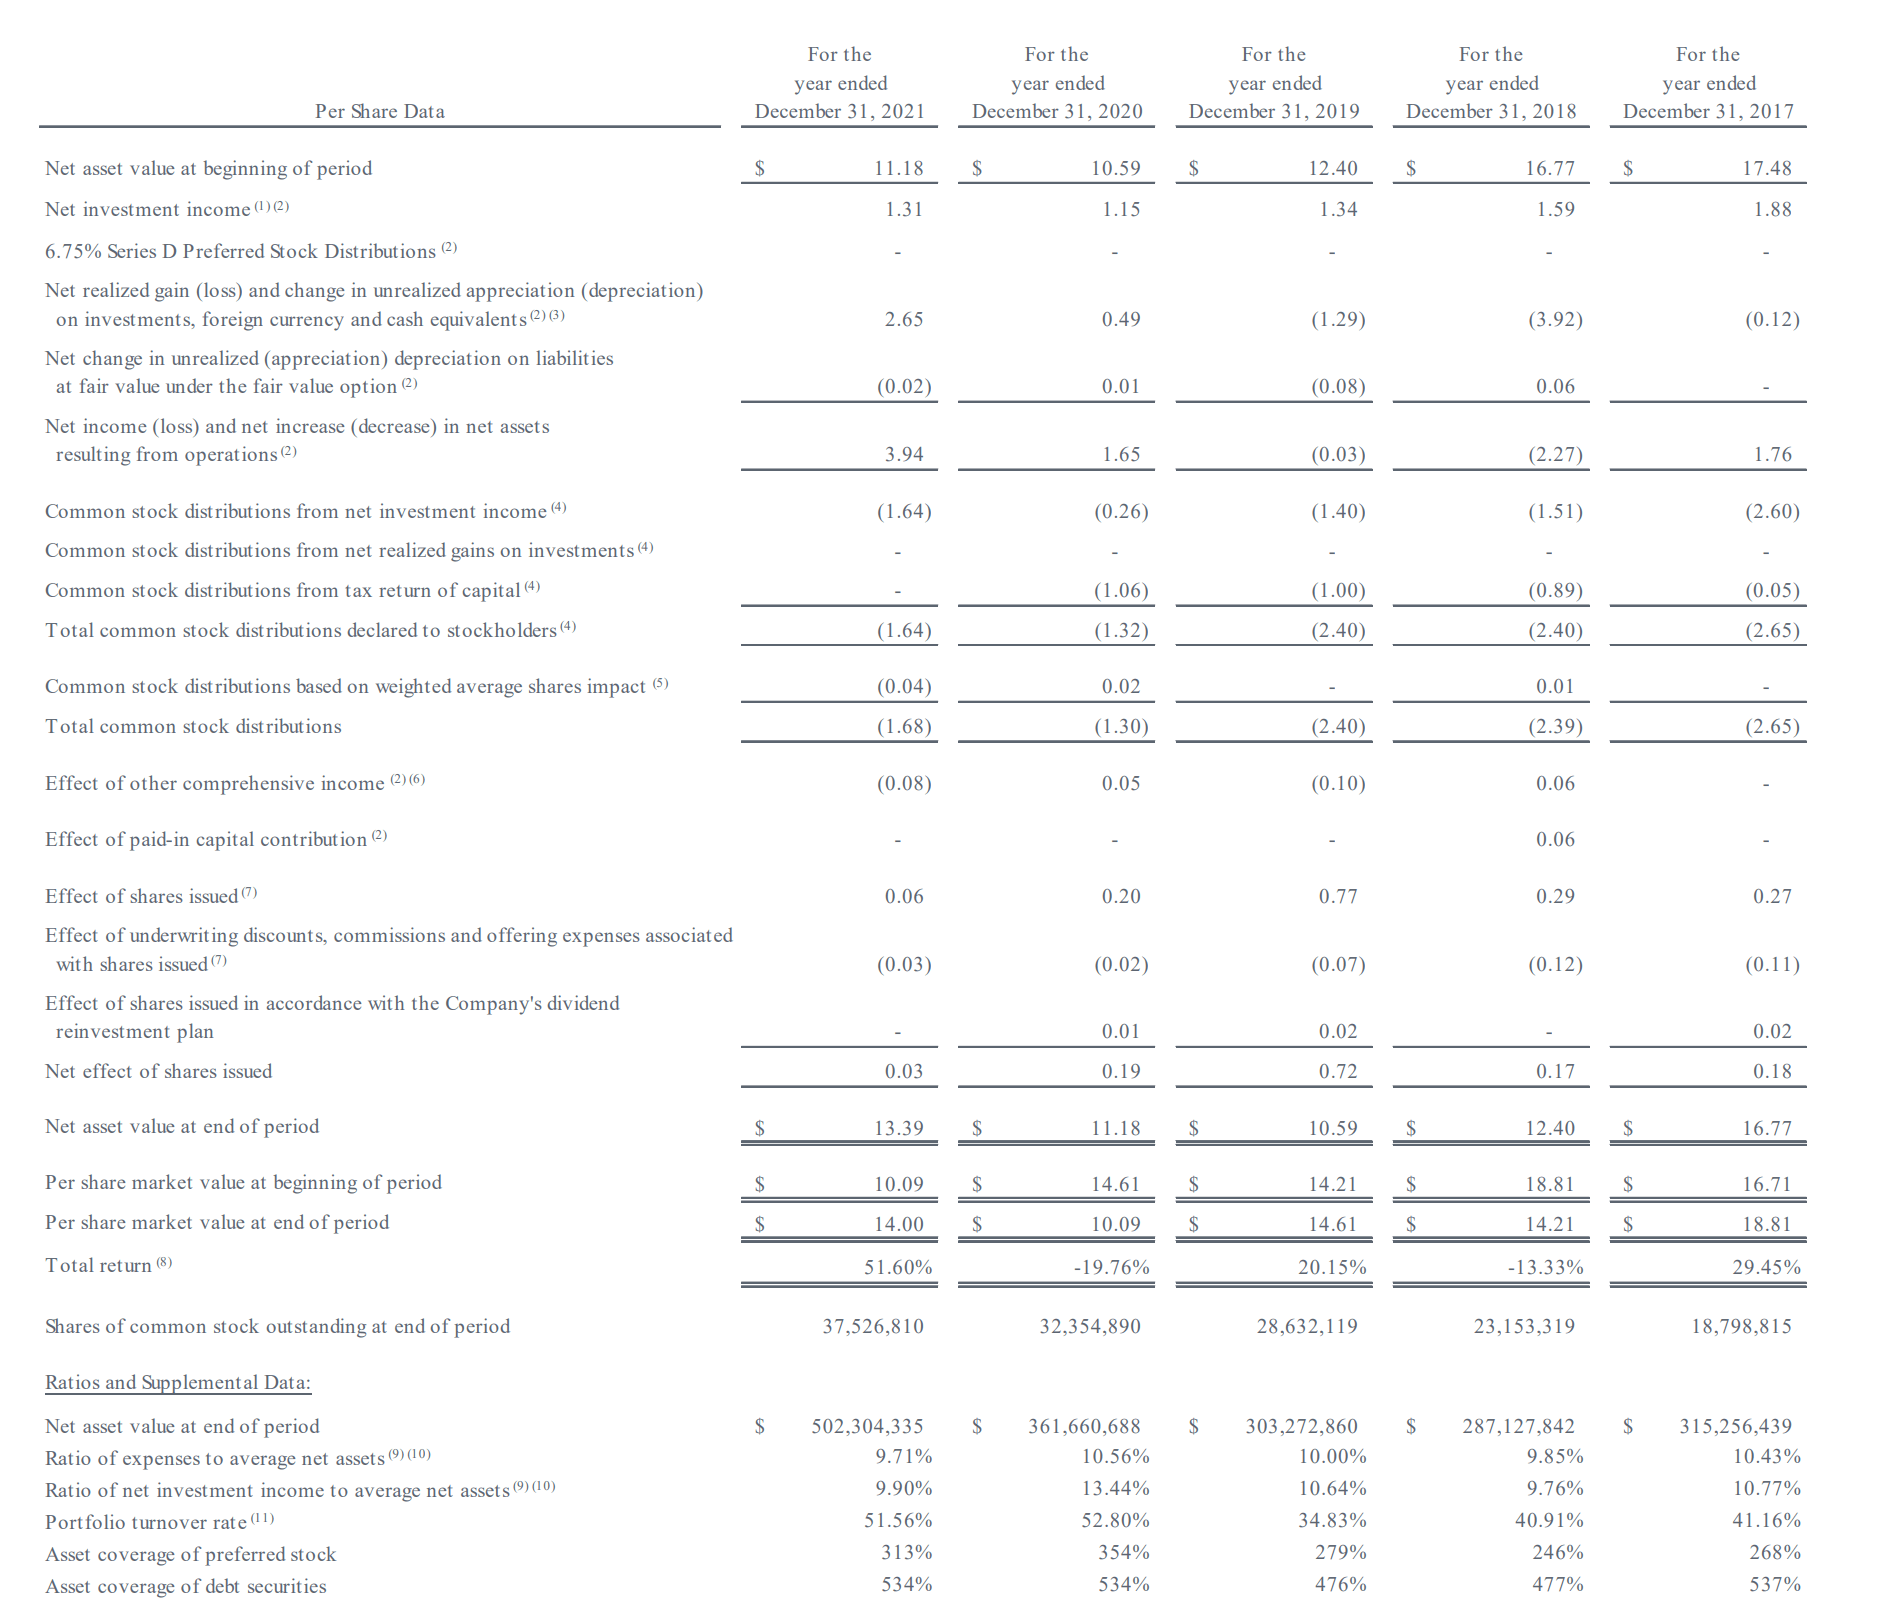
ECC Fees
Eagle Point is a high cost fund. For Fiscal 2021, total expenses was 8.75% of net assets (Figure 12). ECC charges a base management fee of 1.75% of total equity base (common + preferred equity), and a performance fee of 20% above a 2.0% Net Investment Income (“NII”) quarterly hurdle (8% annualized).
Figure 12 – ECC 2021 total fees (ECC 2021 annual report)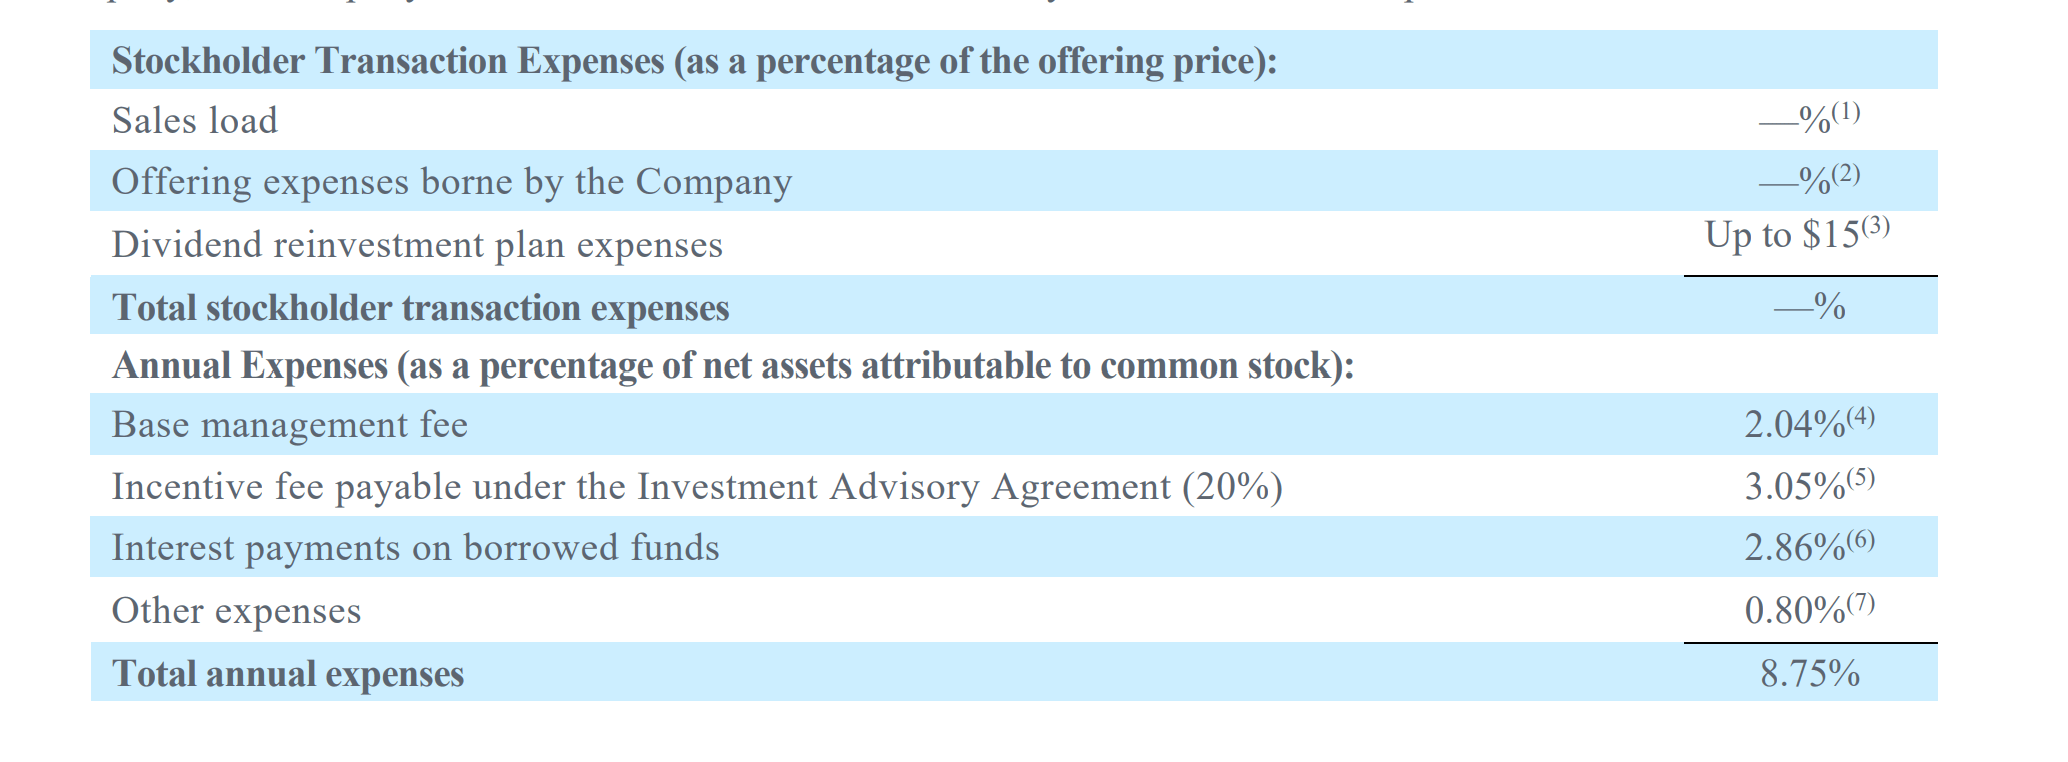
Like OXLC, ECC’s common shareholders are responsible for all expenses of the fund, including interest on borrowed funds and preferred dividends. Unlike OXLC, ECC does not disclose the indirect costs of CLO expenses. However, given how similar the fee structure is between the two funds, I suspect the total indirect costs would be similar to OXLC.
For reference, total fee expense for OXLC in Fiscal 2022 was 10.42%, and 30.69% including indirect CLO expenses.
Eagle Point Comparison To Oxford Lane
Using Portfolio Visualizer to compare between Eagle Point and Oxford Lane, we can see the two funds have very similar return profiles (this is to be expected, as both funds primarily invest in CLO Equity tranches). Figure 12 shows the simulation output. Note, this simulation does not take into account the Dividend Reinvestment Plan (“DRIP”) discounts. Both funds offer a 5% discount for DRIP and the advertised annual returns of both funds take the discount into account.
From Figure 12, we see OXLC has a higher returns CAGR of 7.2% vs. 6.6% in the time period analyzed (Nov 2014 to July 2022), but has higher volatility (34.0% St. Dev. vs. 26.4%). OXLC has a max drawdown of 60.6%, while ECC has a max drawdown of 59.3%.
Figure 12 – Portfolio Visualizer comparison between OXLC and ECC (Portfolio Visualizer)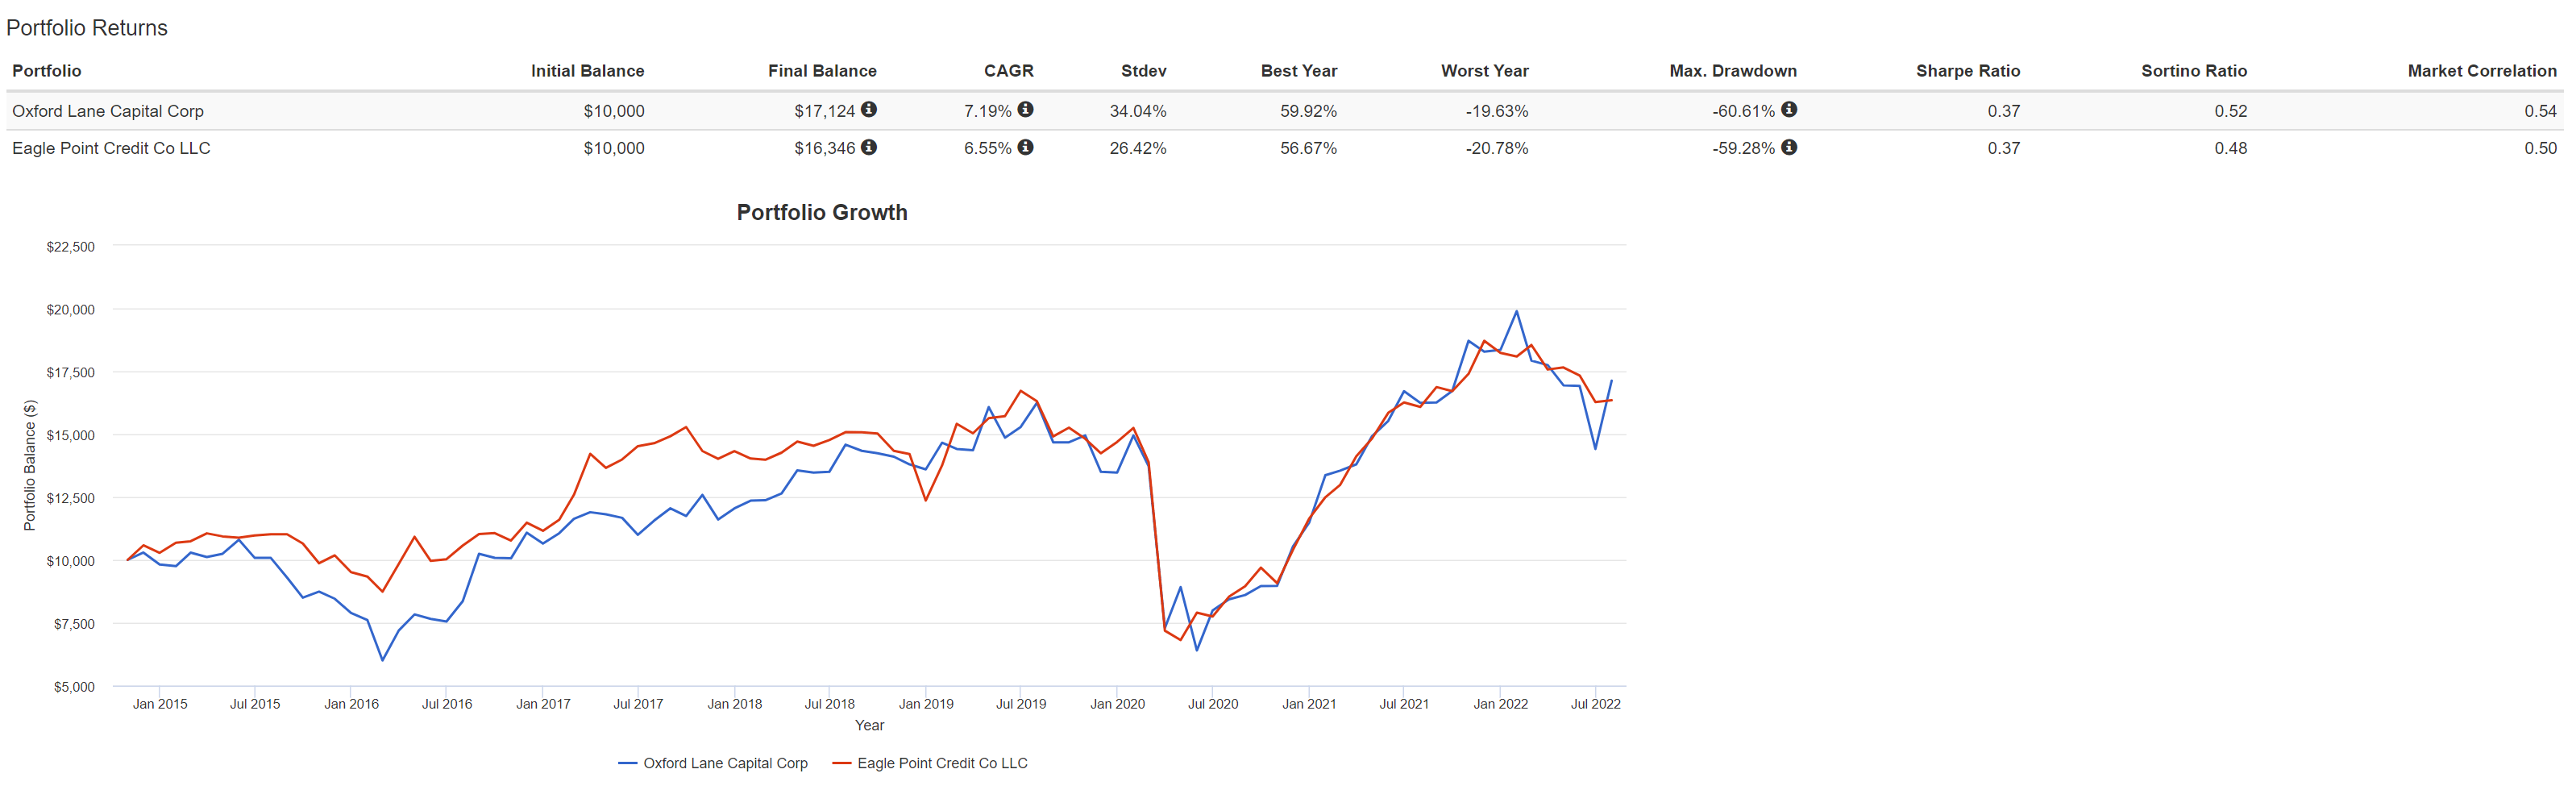
In terms of current distribution yield, the two are also very similar. OXLC has a current yield of 15.0% ($0.075 / month annualized), while ECC has 14.5% current yield. However, including the announced special distribution, ECC is yielding 16.9%.
In terms of fees, ECC seems to be slightly more shareholder friendly, as its total expenses for the last fiscal year was 8.75% compared to OXLC’s 10.42%. Importantly, ECC charges base management fee on total equity (common + preferreds), while OXLC charges base management fee on gross assets, which includes leverage from debt. ECC also has a higher NII hurdle rate for performance fees, at 2.0% per quarter vs. 1.75% for OXLC.
Revisiting Concerns About ECC and OXLC
In my prior article on OXLC, I was primarily concerned about the constant declines in OXLC’s NAV and perpetual issuance of shares. When distributions are cut due to economic concerns, like they were in 2020, long term investors are left with a capital haircut and decreased distributions. The subsequent credit recovery is further diluted as a lot of shares were issued in the meantime to maintain AUM.
ECC shares the same issue, though to a lesser degree than OXLC has it has been in operation for fewer years. ECC IPO’d in October 2014 at $20 / share NAV, and the most recent July NAV per share $10.84 / share. Although Day 1 investors have received a cumulative $16.68 in distributions to July 2022, they would have lost $9.16 in NAV value.
Some commentators on my OXLC article have suggested that the proper way to utilize high yielding CEFs like OXLC and ECC is to take all distributions and re-invest them at the DRIP discount window, and only withdraw amounts where necessary. By reinvesting all the distributions and only withdrawing a smaller amount per month, investors can achieve investment returns closer to the advertised annualized returns.
This is indeed an interesting concept I had not thought about, so kudos to those investors applying this ingenious DRIP investment methodology.
However, my next question is, it appears in applying the DRIP method, investors are trying to maximize total returns. If that is the case, wouldn’t investors be better served investing in a low-cost asset that increases in NAV, like the Vanguard S&P 500 ETF (VOO), and withdraw the monthly amount required?
For example, in Figure 13, I have set up a comparison analysis between OXLC, ECC, and VOO, with initial invested capital of $100,000 in November 2014. Each month, $500 is withdrawn, so it provides a 6% initial capital yield (not adjusted for inflation).
Figure 13 – OXLC, ECC, vs. VOO comparison (Author created using Portfolio Visualizer)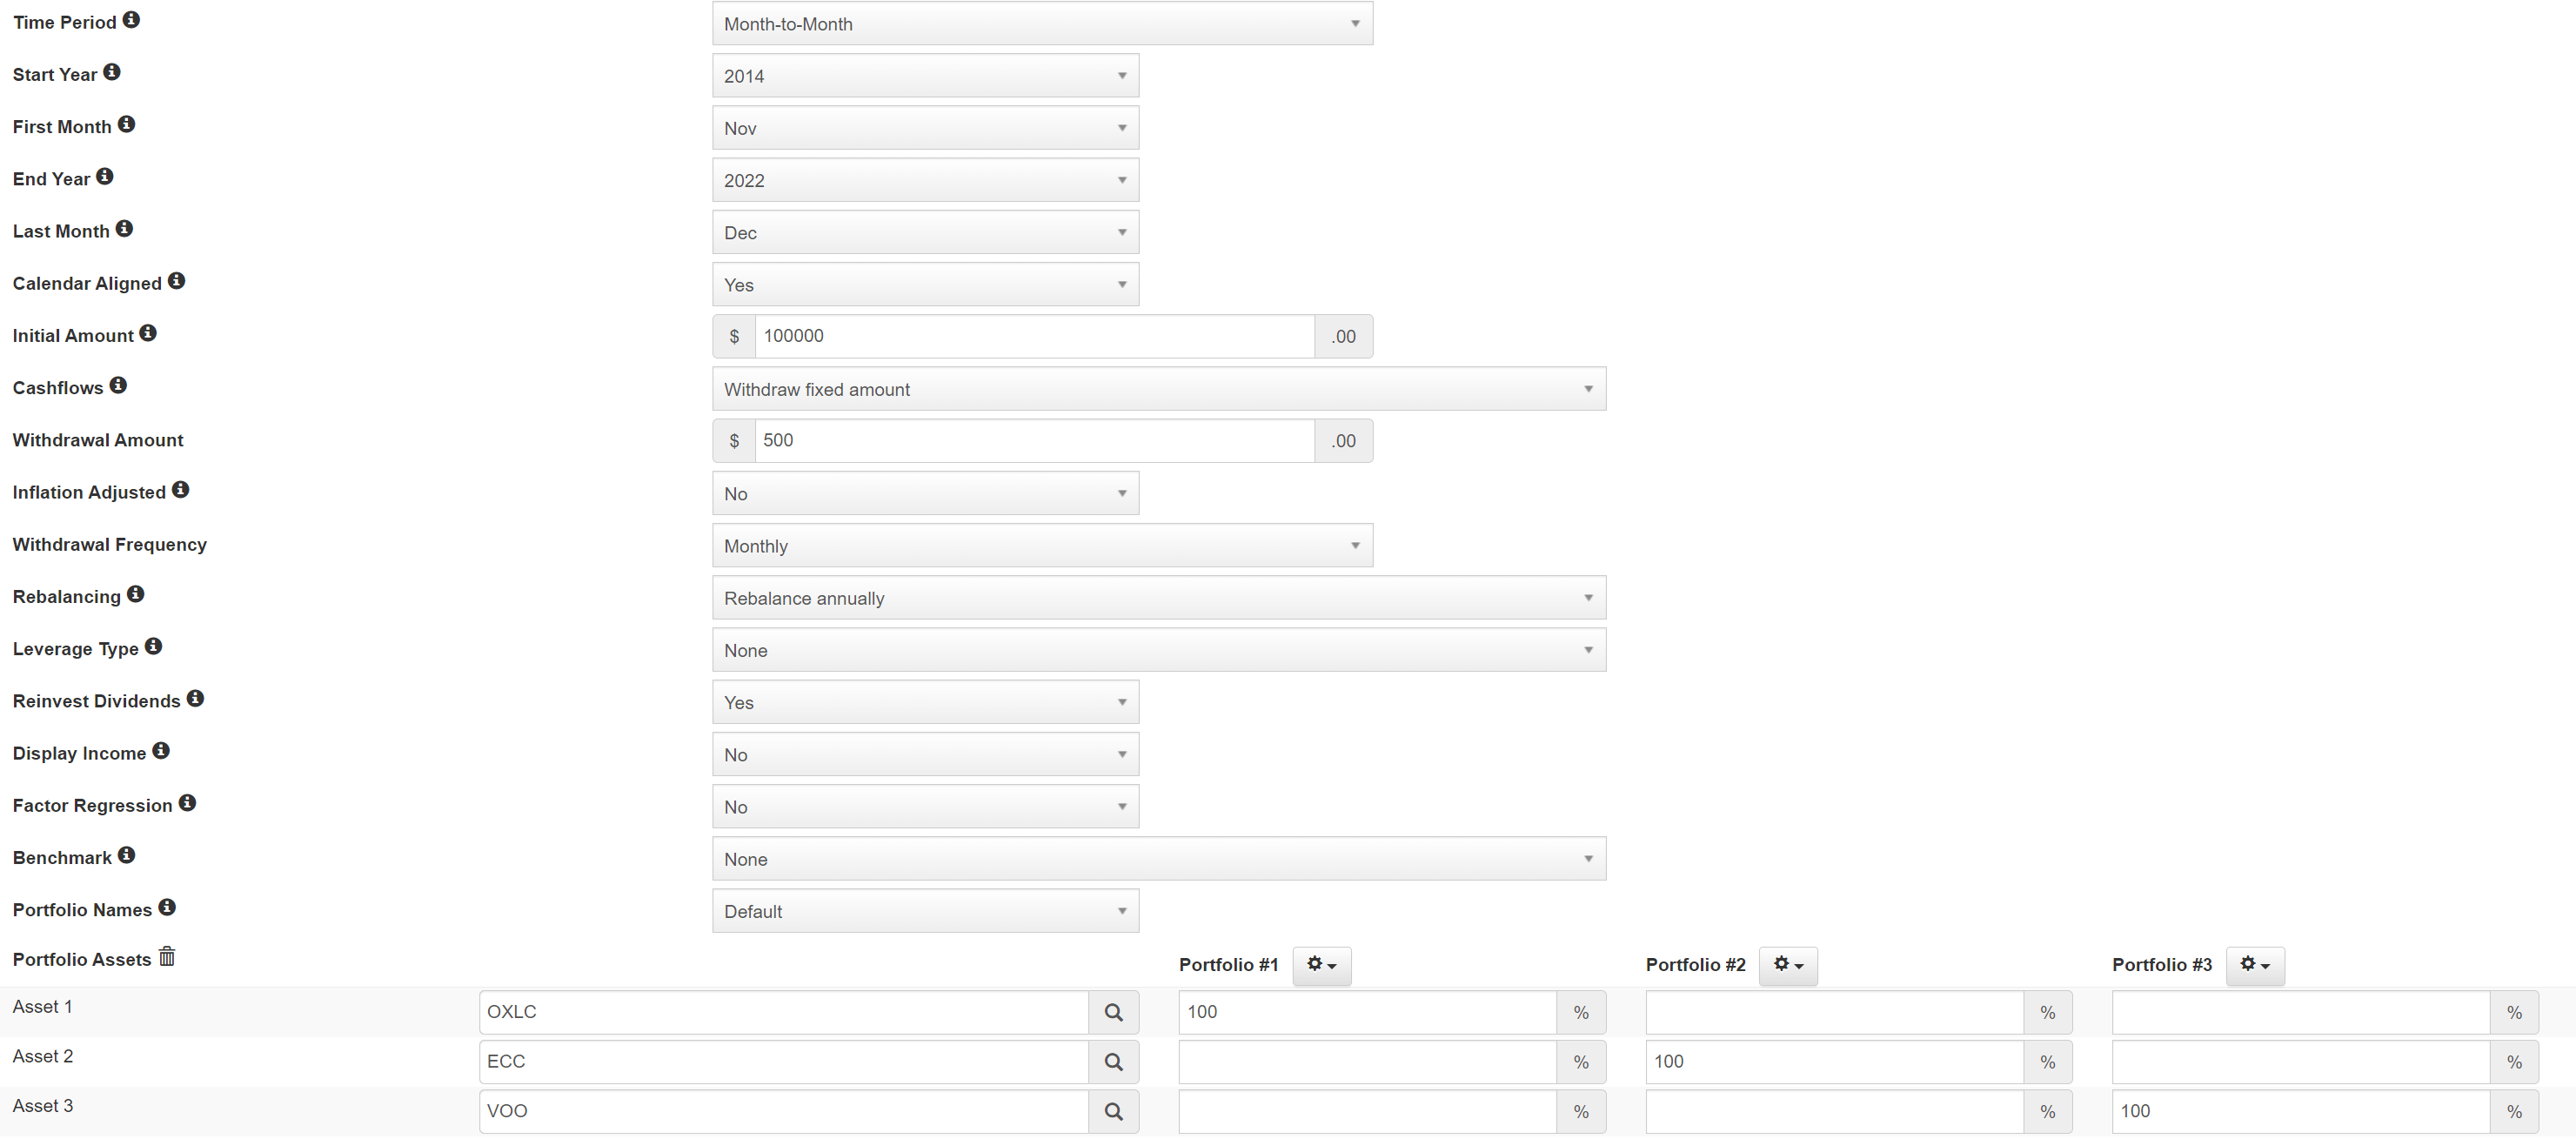
The end result is that the OXLC portfolio has an ending balance of $102K, the ECC portfolio has an ending balance of $103k, and VOO has an ending balance of $161K (Figure 14). i.e., you still end up ahead investing in conventional low cost assets like VOO. Granted, this portfolio visualizer analysis does not take into account the DRIP discount, but I am not sure if a 5% DRIP discount can make up for a 6% difference in the CAGR returns. Also, risk metrics such as Standard Deviation of returns and max drawdowns are much lower with the VOO portfolio and Sharpe ratios are much higher.
Figure 14 – OXLC vs. ECC vs. VOO returns (Author created using Portfolio Visualizer)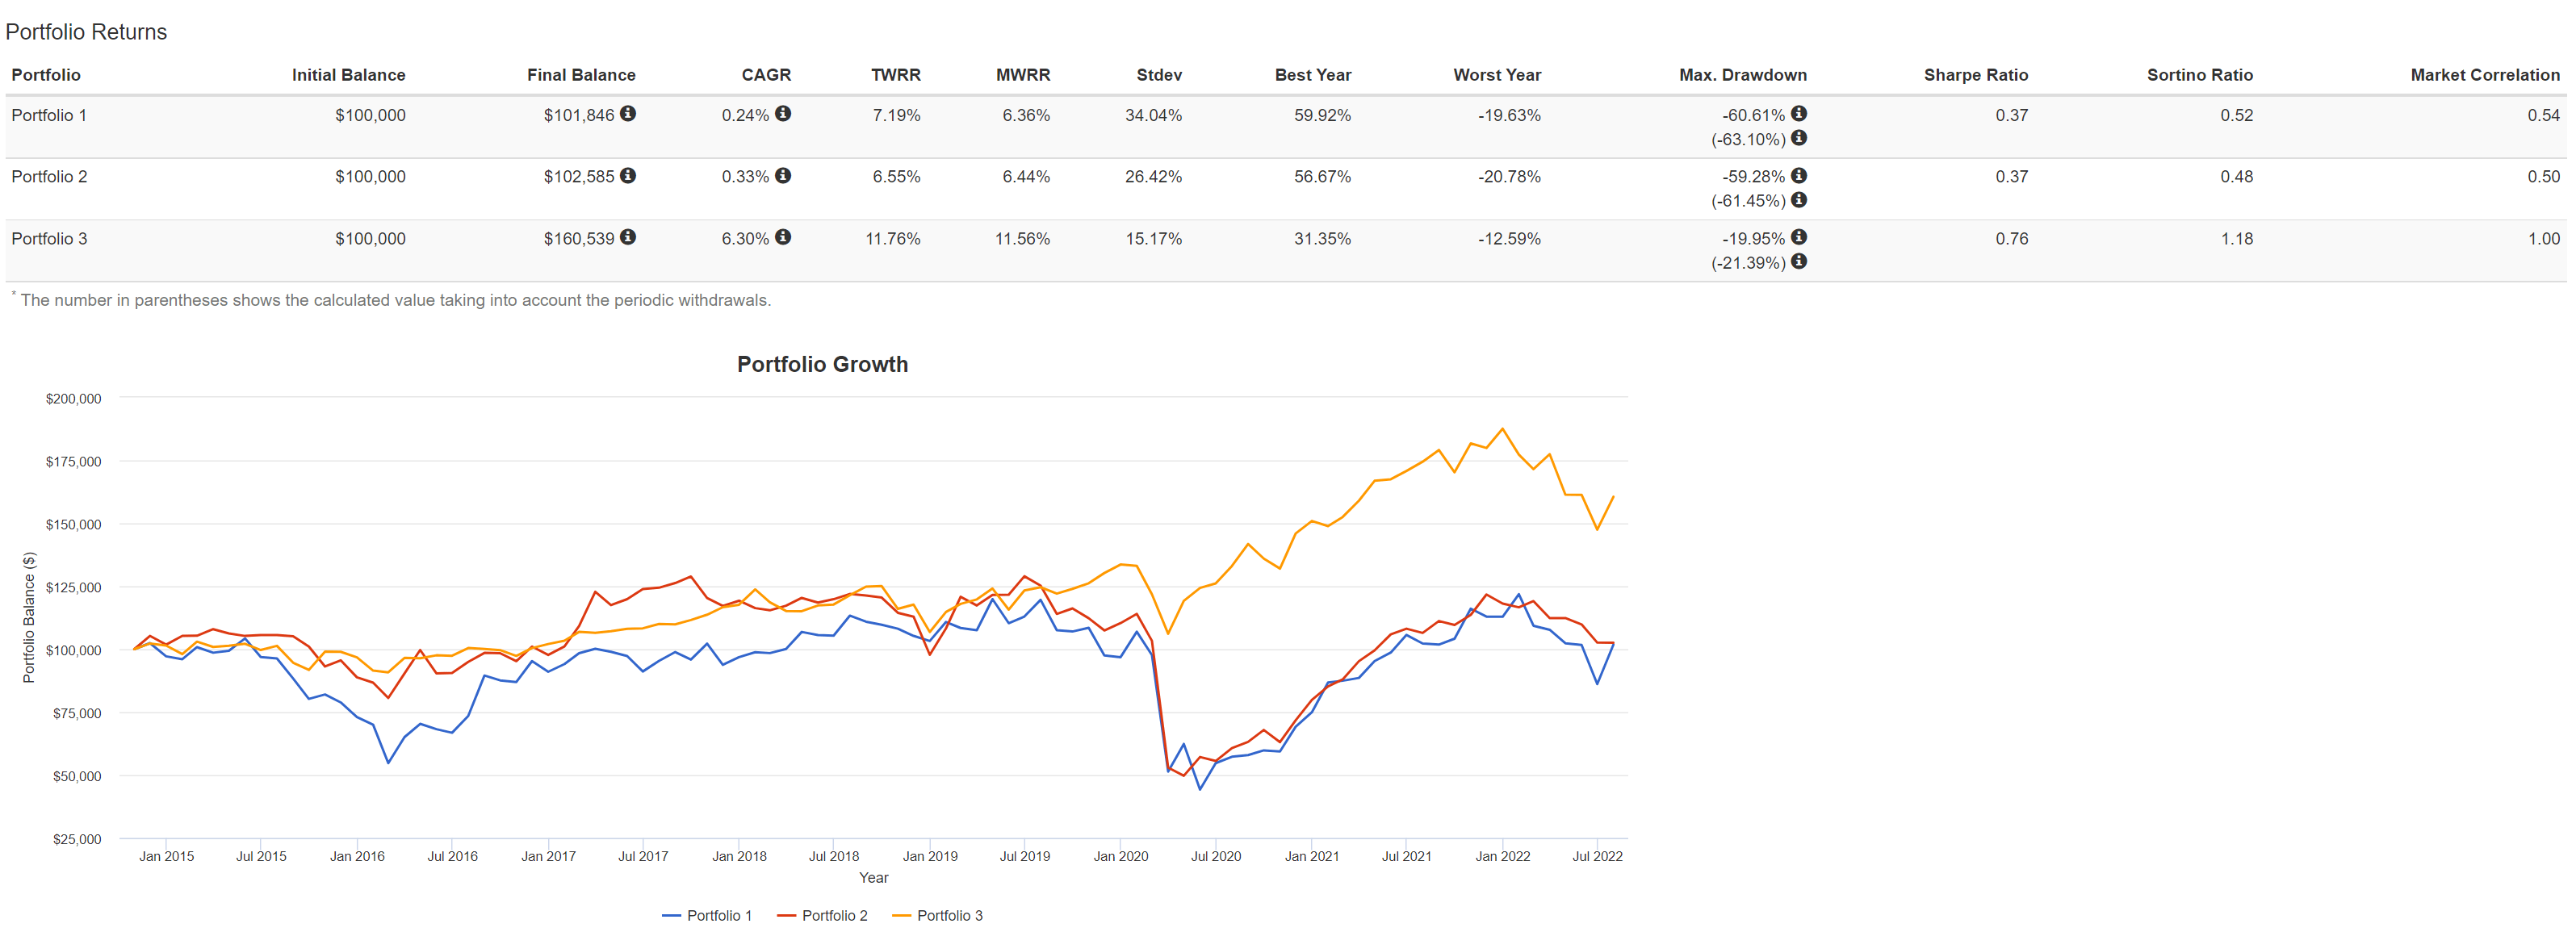
CLOs Probably Won’t Cause Next Financial Crisis
After reading more research on historical leveraged loan performance and CLO default rates, I agree with most commentators that CLOs are not the ticking time bombs some analysts believe them to be. This is because, unlike CDOs that caused the great financial crisis in 2008, the underlying raw building blocks in CLOs are leveraged loans across diverse businesses in the economy. Most CLOs have strict loan diversification rules (no sector can be greater than 15% of the CLO; no obligor greater than 2%, etc.), are overcollateralized, and have automatic guardrails that force the structure to delever once some credit events are triggered. According to Wharton finance professor Michael Roberts:
If lenders were to recover $0.40 on the dollar for loans in default, then 60% of the loans in CLO portfolios would have to default before the AAA-rated tranches would even begin to lose money. To put that number in context, the cumulative default rate for risky debt during the worst three years of the Great Depression (1931-1933) was 31%.
But CLO Equity Tranches Can Still Lose Money
However, that does not mean junior holders of CLOs, like CLO Equity tranches, will not suffer losses. The CLO structure contains overcollateralization (“OC”), Interest Coverage (“IC”) and Interest Diversion tests to protect the senior tranche holders. In the OC test, if the underlying loan collateral is less than the CLO debt tranches, then the CLO is paid down from the most senior tranche downward until the test goes back into compliance. Similarly, interest is paid to the most senior tranches first. In effect, these tests protect the senior CLO debt holders from losses. CLO Equity, by definition, is there to protect the senior tranches from default.
In ECC’s portfolio, shown in Figure 15, we see there are holdings where the ‘Junior OC Cushion’ is negative and thus the CLO Equity tranche receives no cash distribution (Harborview VII for example). So even if the AAA tranche of Harborview VII does not default, the Equity tranche could be wiped out.
Figure 15 – ECC CLO level details (ECC investor presentation)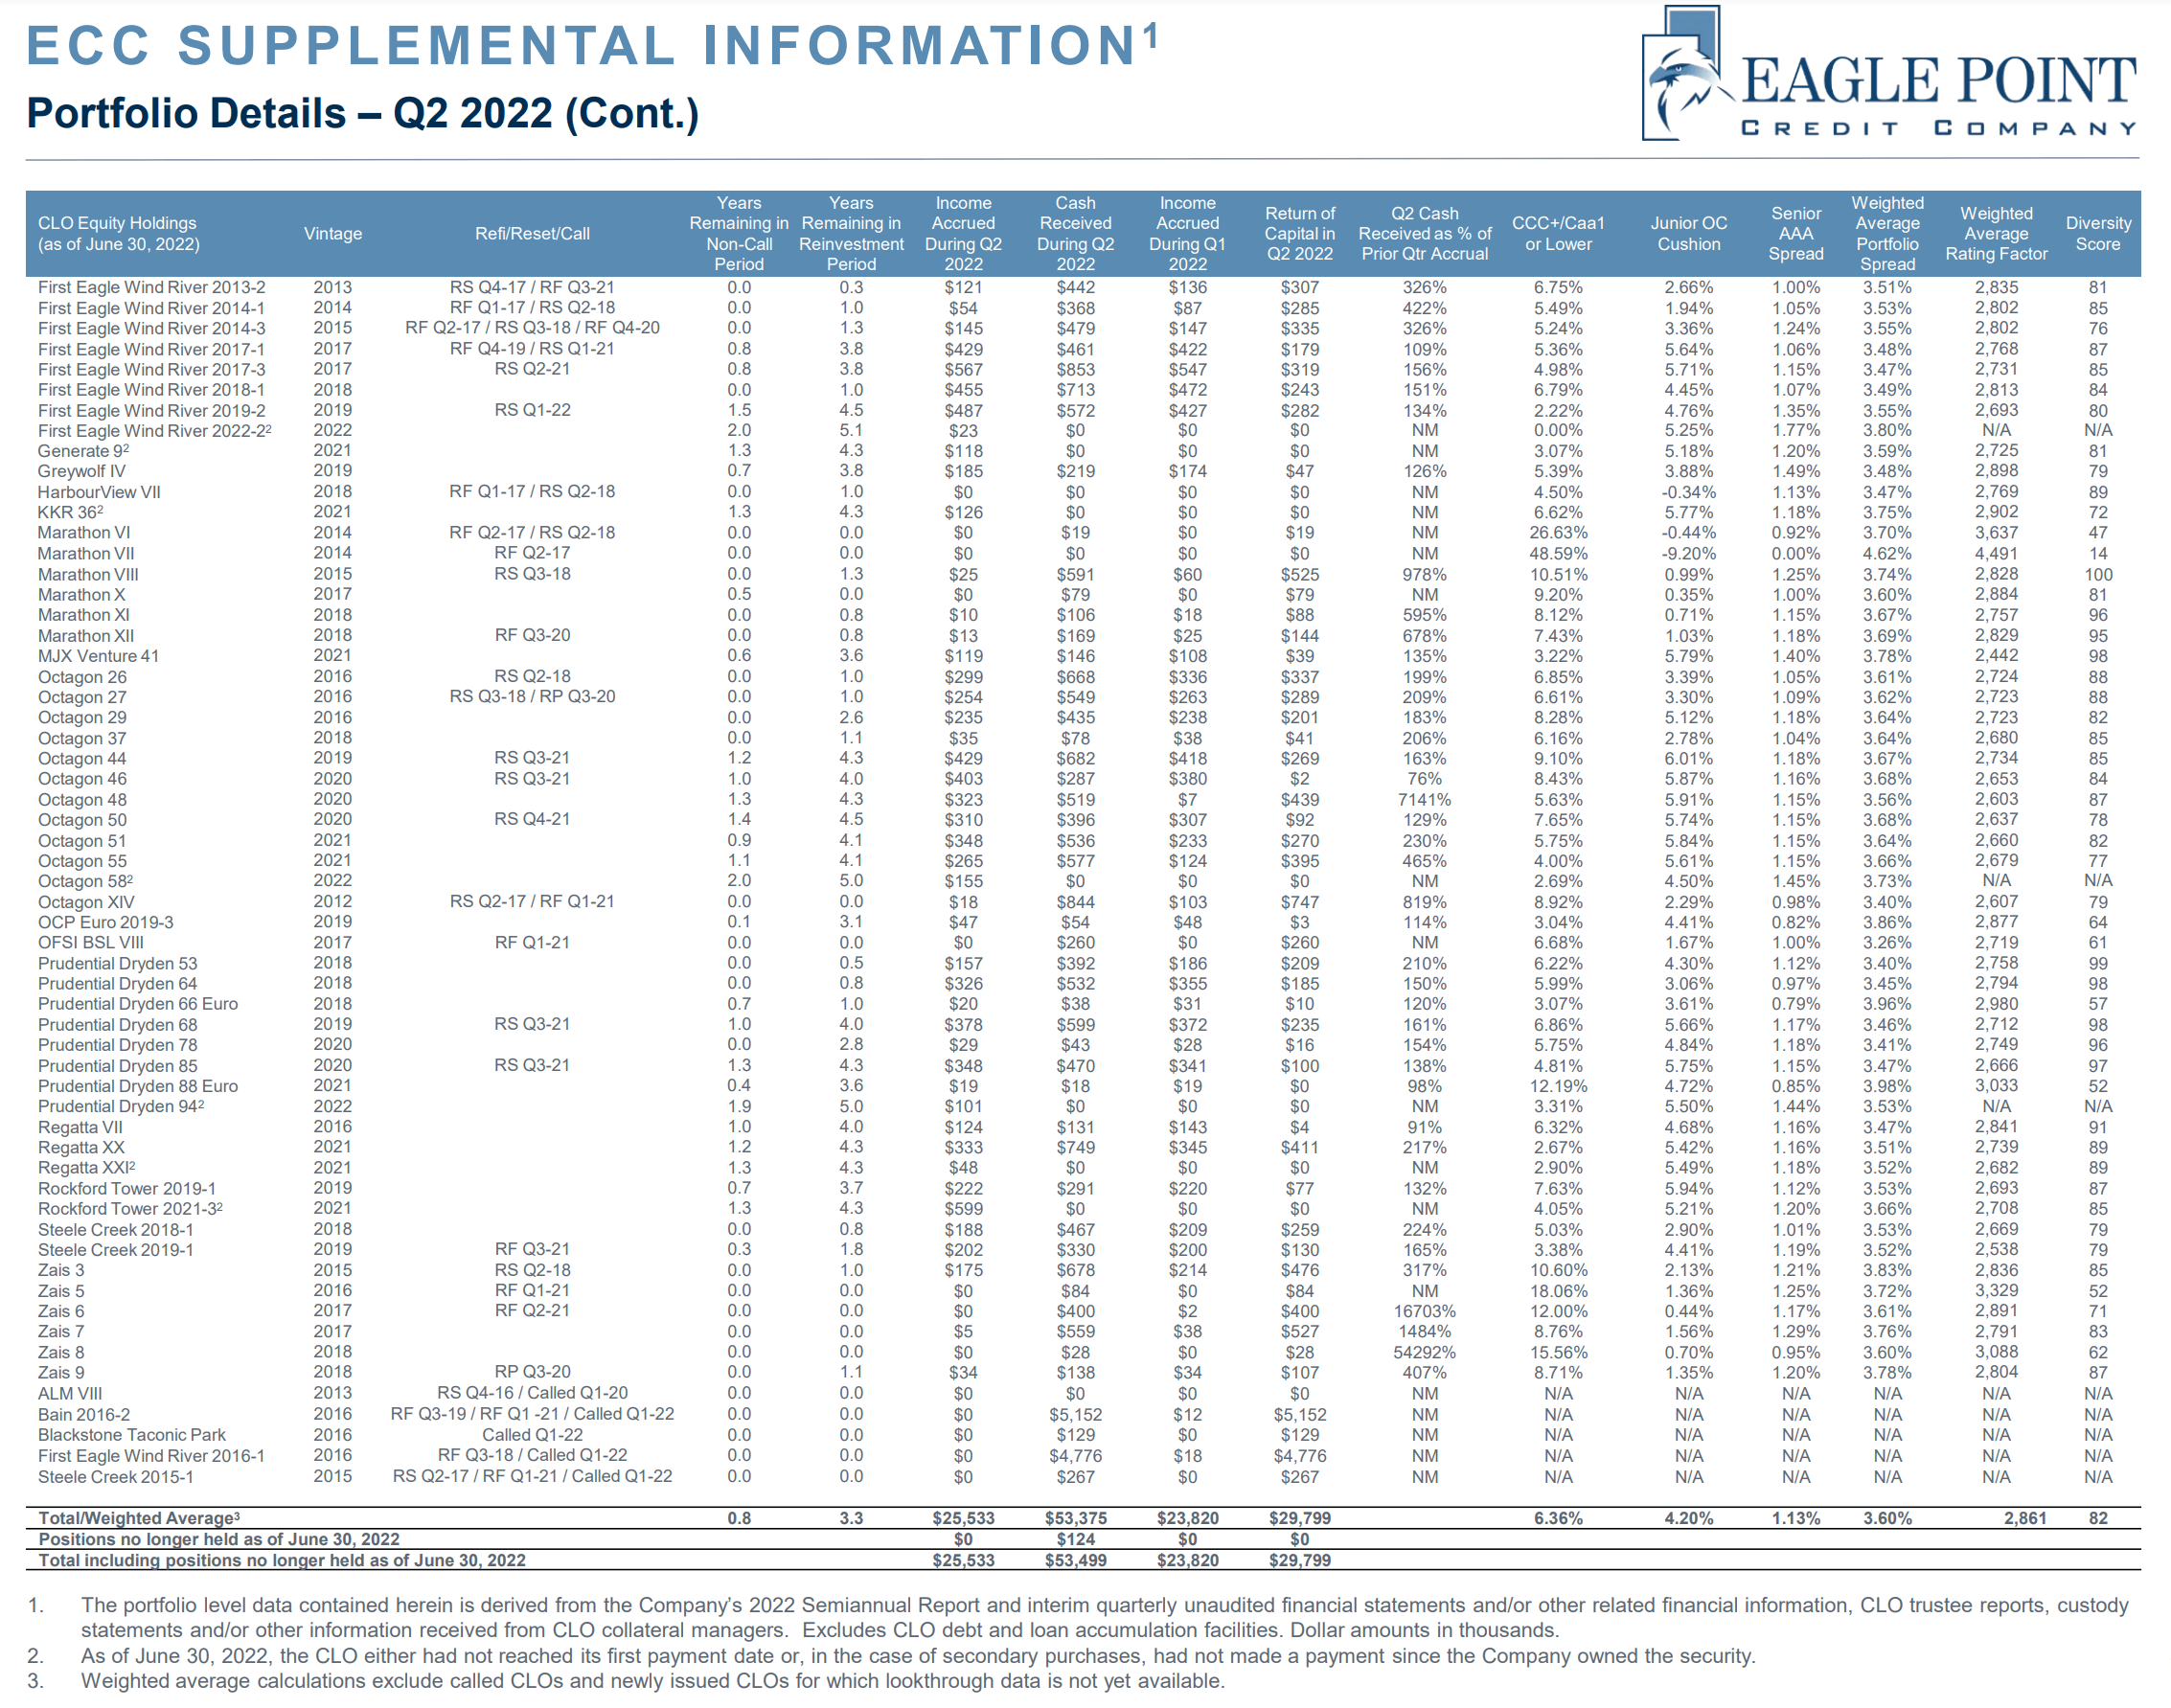
Similarly, OXLC shows some CLOs with negative ‘Junior Tranche Overcollateralization Cushion’ (Figure 16), presumably indicating these do not generate cash yields.
Figure 16 – OXLC CLO level details (OXLC investor presentation)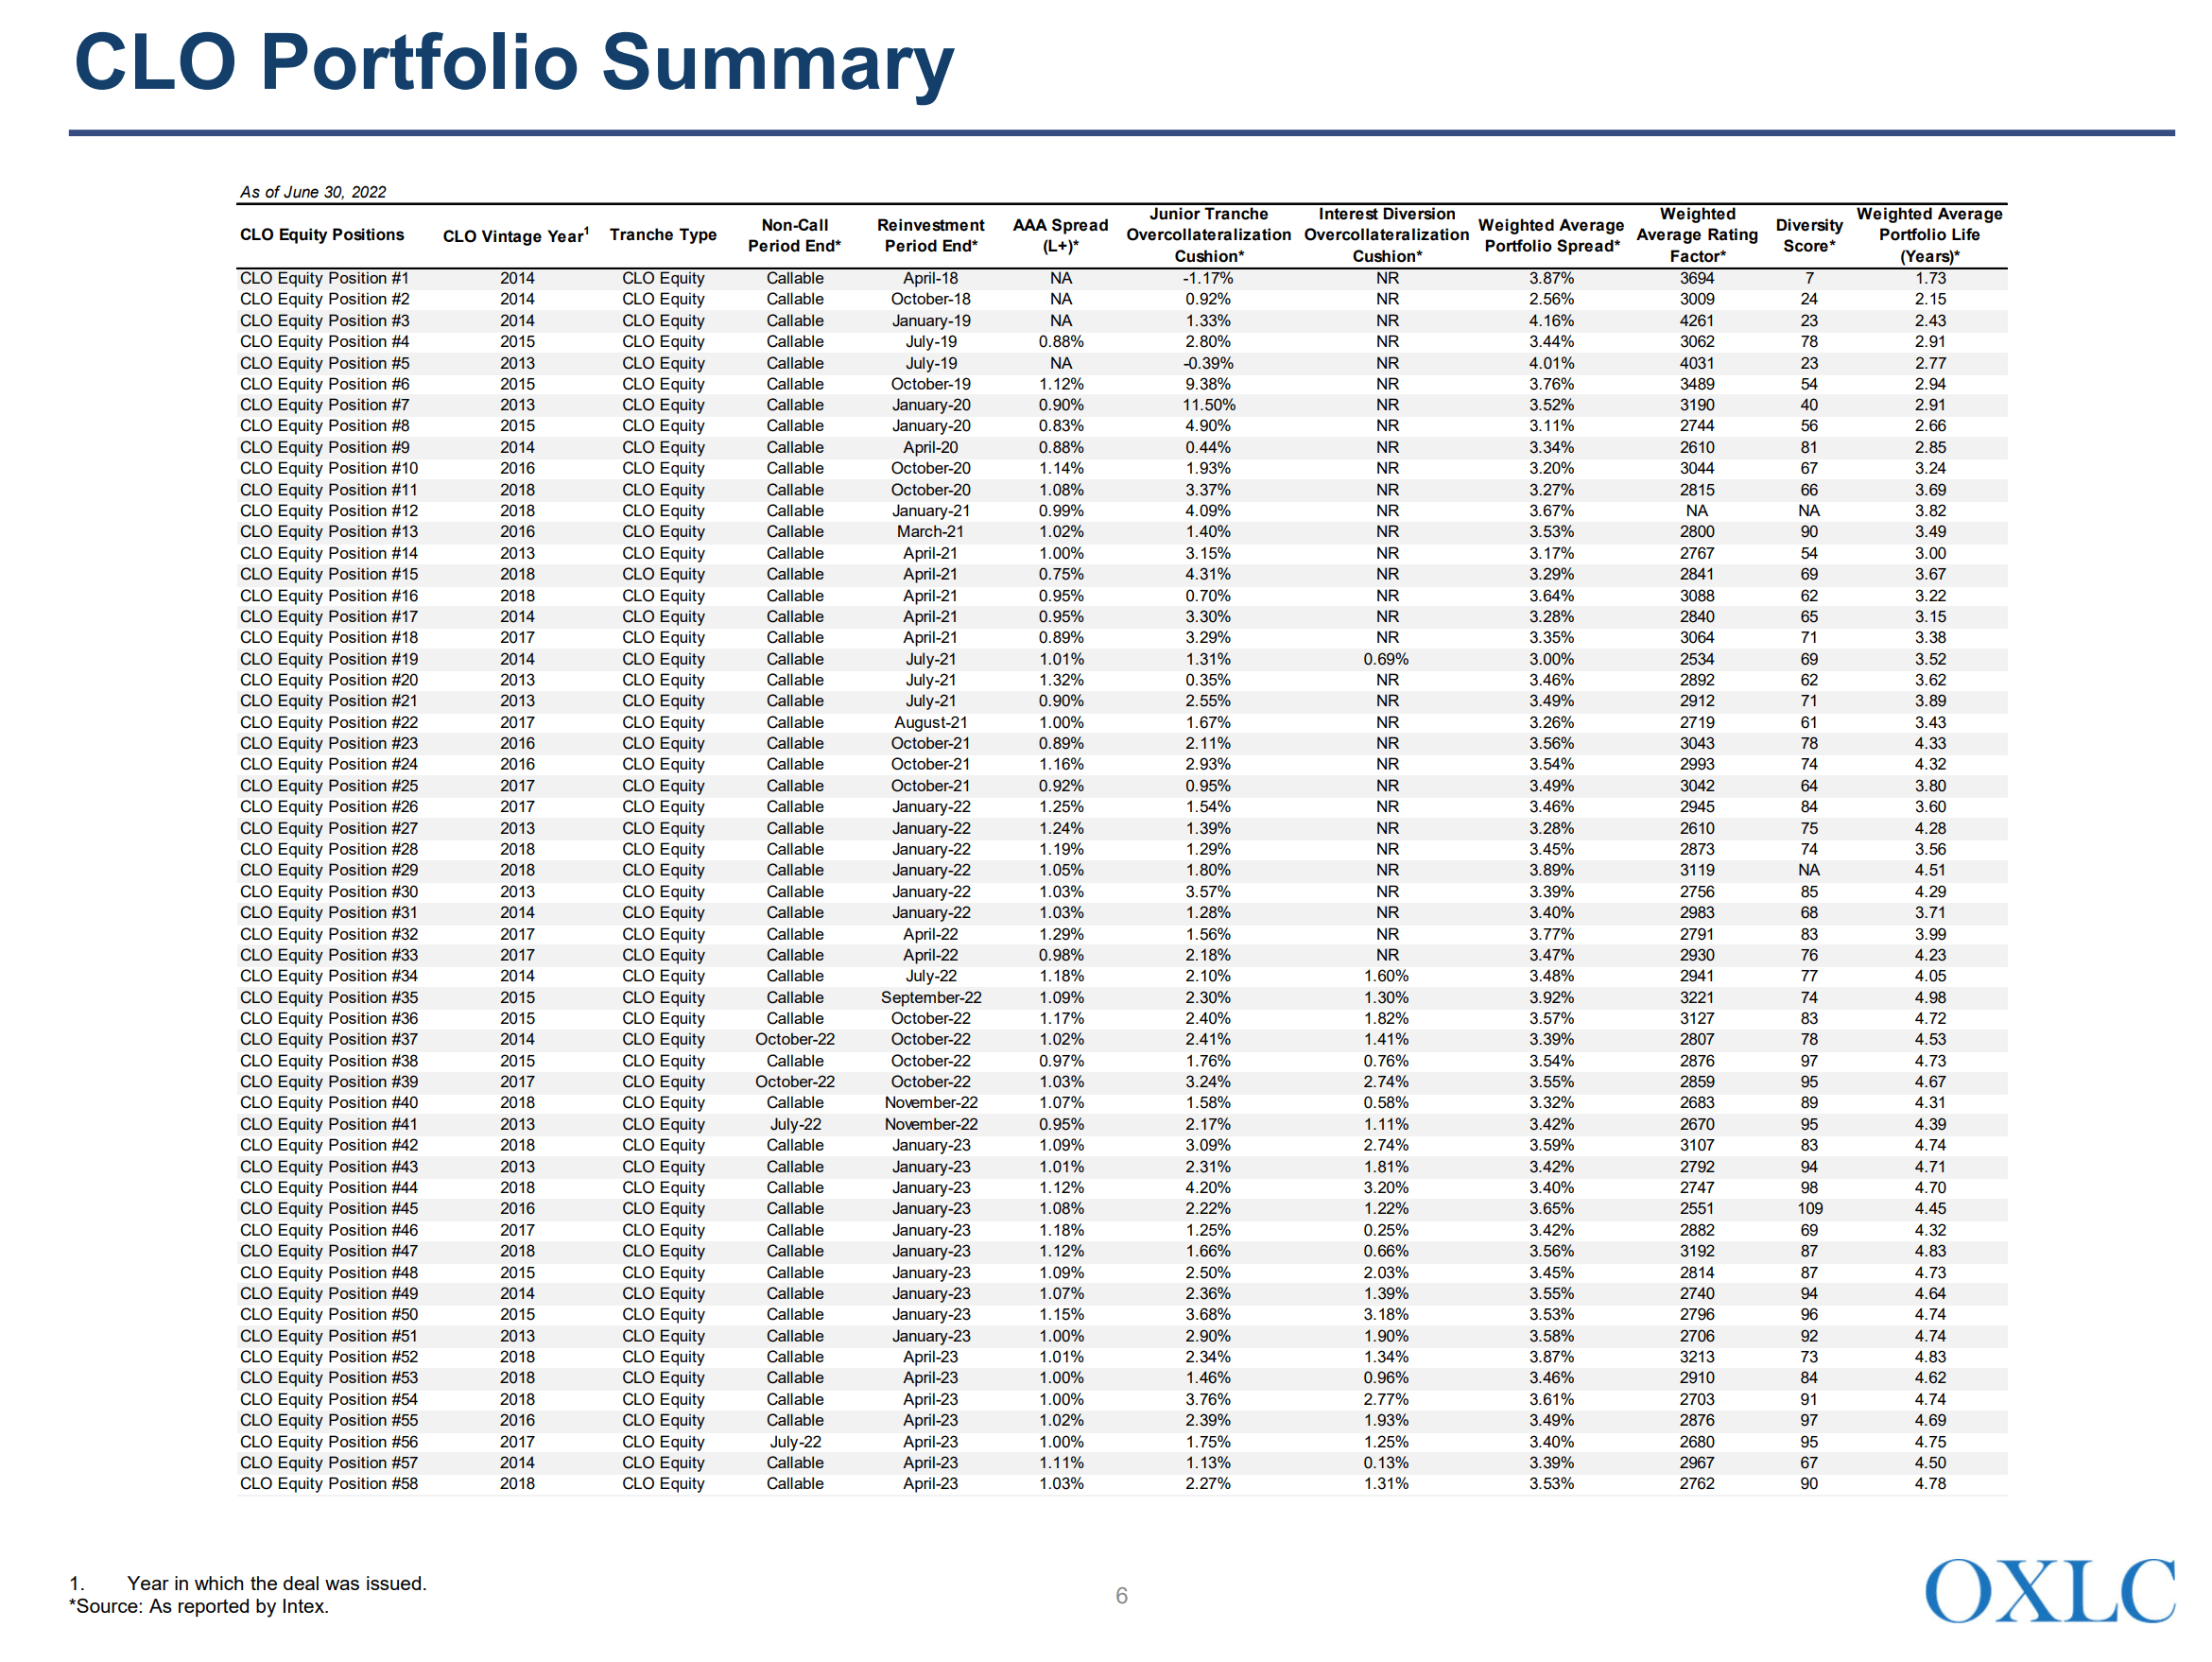
Investors in ECC and OXLC are highly encouraged to monitor the important metrics such as ‘% of portfolio rated CCC or lower’ and ‘Junior tranche overcollateralization’ in order to assess the health of the underlying CLO Equity tranches.
2020 Was A Near Death Experience
In 2020 when the COVID-19 pandemic shut down most of the world economy, the CLO market had a near-death experience as many leveraged loans were downgraded to junk status. As CLOs are contractually obligated to hold no more than 7.5% of CCC or worse loans, this caused mass selling of the lower rated leveraged loans and CLO Equity tranches were massively marked down. Both ECC and OXLC saw their NAVs plunge as a result.
If the Federal Reserve had not stepped in with their credit backstop, undoubtedly, many leveraged loans would have defaulted and CLO Equity investments would have been wiped out.
Although credit markets have staged a tremendous recovery in 2020 and 2021, we are now facing a Federal Reserve intent on tightening financial conditions and reducing aggregate demand to fight inflation. Already, almost a quarter of the loans held in CLOs are barely above junk status (Figure 17). If the economy deteriorates and rating agencies downgrade these loans, we may see another rush by CLOs to sell lowly rated loans and NAV destruction for CLO Equity holders.
Figure 17 – CLOs are stuffed with low rated loans (Bloomberg)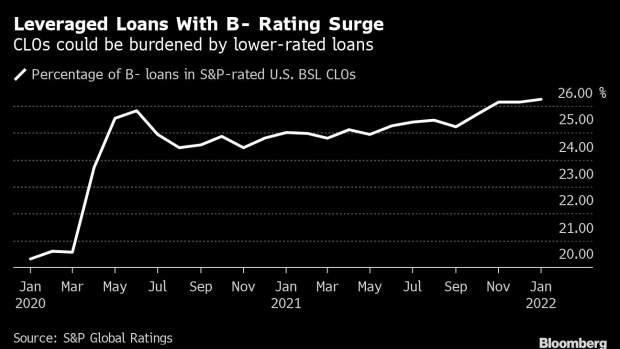
As I had mentioned in the comments of my OXLC article, investors should closely monitor the high yield credit spread, as it is often correlated with the leveraged loan market (Figure 18).
Figure 18 – Leveraged loans correlated with high yield spreads (Guggenheim investments)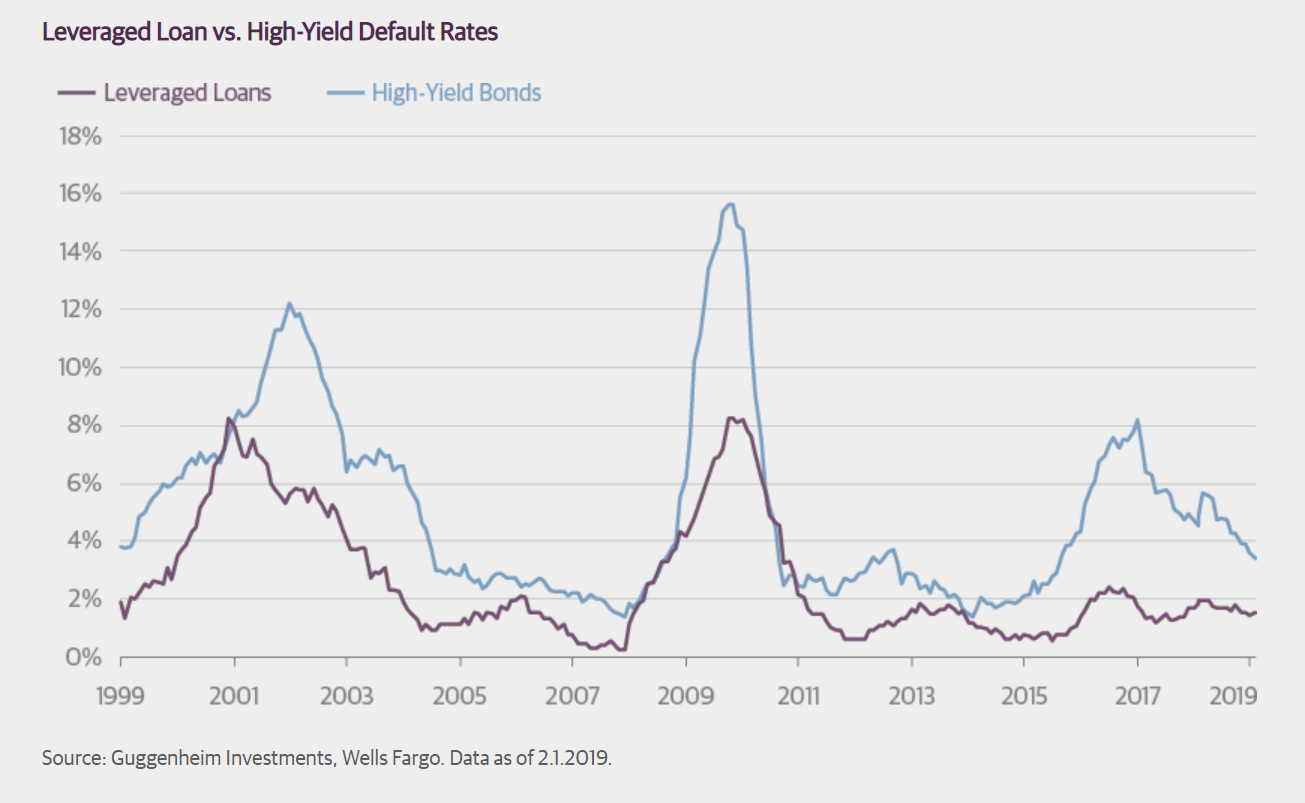
Currently, high yield spreads are still very benign at only 4.6% (Figure 19). If the Federal Reserve is serious about tightening financial conditions, expect this spread to head higher in the coming quarters.
Figure 19 – High Yield Spread (St. Louis Fed)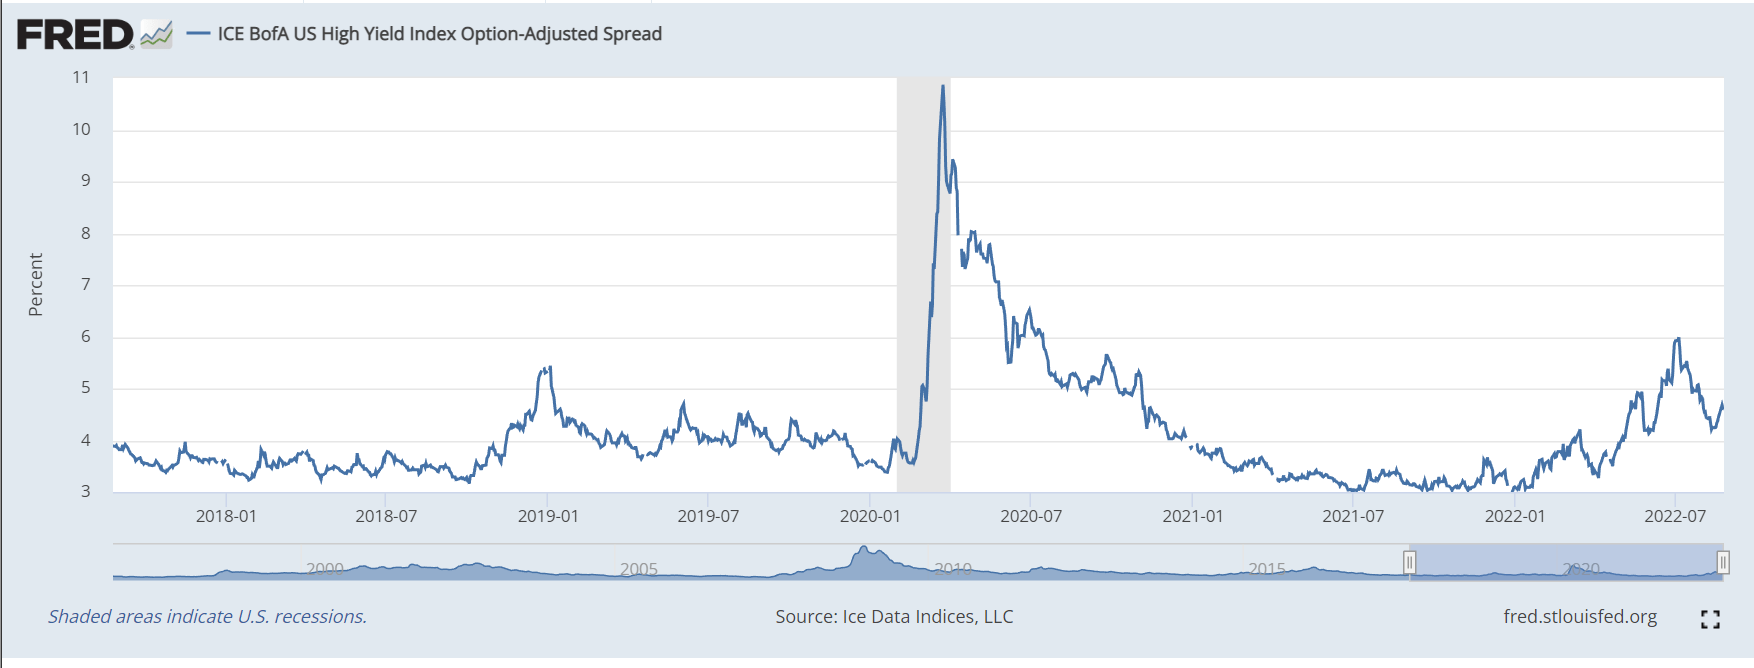
Conclusion
In summary, my thoughts on Eagle Point mirrors my conclusions on Oxford Lane. While I think the current distribution yield is attractive for both ECC and OXLC, I am staying away from both funds as I believe we are in the early stages of a credit deterioration cycle. Also, an equivalent income stream can be created with low cost vanilla funds that may offer better return and risk characteristics than high yielding CEFs with perpetual NAV declines.
I would consider CLO Equity funds like OXLC and ECC as a credit recovery play if high yield spreads were to widen to 8% or more and the Federal Reserve has stopped tightening financial conditions.
Be the first to comment