


piranka
Author’s note: This article was released to CEF/ETF Income Laboratory members on August 19th, 2022. Please check latest data before investing.
“Quality” Closed-End Fund Report
Quantitative screens help to rapidly narrow down attractive candidates from the database of 500-plus closed-end funds for further due diligence and investigation.
Income Lab
Based on feedback from members, it seems that a very many number of investors, understandably, place a great emphasis on coverage and return of capital. While I’m not going to rehash the entire ROC argument here (it is suffice to say that the issue is much more complicated than “ROC = bad”), some investors may consider a fund with over 100% coverage to be attractive simply because they know that the distributions are being covered by earnings. Such a fund may be at lower risk of a distribution cut, which can cause devastating impacts to a fund’s market price and may even afford to raise its distribution in the future.
What does the “quality” label indicate? Simply put, it means that the distribution coverage is greater than 100%. However, please note these caveats: Firstly, coverage ratios are calculated using earnings data from CEFConnect. Although there are sometimes discrepancies with CEFConnect’s data, this allows us to automate the calculation process for the entire universe, and we consider it to be sufficient for a preliminary screen anyway. Before buying or selling any fund, it’s recommended to independently verify the coverage ratios from the individual fund annual/semi-annual reports themselves. Secondly, having a coverage ratio >100% does not guarantee that the fund’s distribution is secure. Many funds reduce their distributions periodically in line with market conditions in order to maintain good coverage. Thirdly, a coverage cut off ratio of 100% is, ultimately, an arbitrary number. A fund with 99.9% coverage will be excluded from the rankings, whereas funds with 100.1% coverage will be considered, even though only a sliver of coverage separates the two.
The coverage ratio is calculated by dividing the earnings/share number provided by CEFConnect on the “distributions” tab by the distribution/share. CEFdata also provides earning coverage numbers as well.
I hope that these rankings of quality CEFs will provide fertile ground for further exploration.
Key to table headings:
P/D = premium/discount
Z = 1-year z-score
Lev = leverage
BE = baseline expense
Cov = coverage
Data were taken from the close of August 18th, 2022.
1. Top 10 widest quality discounts
The following data show the 10 CEFs with the highest discounts and coverage >100%. Yields, z-scores and leverage are shown for comparison.
| CEF | Category | P/D | Yield | Z | Lev | BE | Cov |
| (HFRO) | Senior Loans | -23.89% | 7.72% | -0.6 | 11% | 1.61% | 116% |
| (NUO) | Single-state Munis | -12.28% | 3.46% | -0.4 | 38% | 0.98% | 123% |
| (WIW) | Investment Grade | -12.27% | 6.21% | -1.1 | 35% | 0.76% | 212% |
| (BFZ) | California Munis | -11.08% | 4.41% | -0.1 | 44% | 1.05% | 106% |
| (NBO) | New York Munis | -11.04% | 4.48% | -0.1 | 43% | 1.94% | 134% |
| (CXH) | National Munis | -10.93% | 4.23% | -0.3 | 37% | 1.17% | 109% |
| (EMD) | Emerging Market Income | -10.50% | 10.24% | -0.5 | 35% | 1.30% | 101% |
| (DHF) | High Yield | -10.33% | 9.15% | -0.8 | 33% | 1.28% | 103% |
| (WIA) | Investment Grade | -10.31% | 5.18% | -0.7 | 38% | 0.75% | 249% |
| (EVM) | California Munis | -10.21% | 4.46% | -0.3 | 44% | 1.11% | 107% |
Income Lab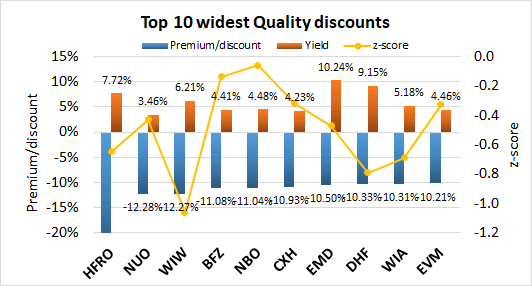
2. Top 10 best quality z-scores
CEFs with the best (most negative) z-scores are potential buy candidates. The following data show the 10 CEFs with the lowest z-scores. Premium/discount, yields and leverage are shown for comparison. Only funds with coverage >100% are considered.
| CEF | Category | Z | P/D | Yield | Lev | BE | Cov |
| (MHN) | New York Munis | -1.2 | -9.34% | 4.79% | 43% | 1.01% | 108% |
| (DFP) | Preferreds | -1.2 | -0.70% | 7.99% | 37% | 1.06% | 115% |
| (BSL) | Senior Loans | -1.1 | -8.05% | 6.38% | 34% | 1.77% | 108% |
| (MYN) | New York Munis | -1.1 | -9.36% | 4.53% | 40% | 1.29% | 111% |
| (WIW) | Investment Grade | -1.1 | -12.27% | 6.21% | 35% | 0.76% | 212% |
| (BFK) | National Munis | -1.0 | -5.71% | 4.98% | 42% | 1.02% | 107% |
| (OXLC) | Senior Loans | -1.0 | 0.98% | 14.53% | 26% | 8.22% | 104% |
| (EFL) | Senior Loans | -1.0 | -1.39% | 4.24% | 35% | 1.23% | 105% |
| (PFD) | Preferreds | -0.9 | 1.12% | 7.43% | 36% | 1.26% | 115% |
| (PHD) | Senior Loans | -0.8 | 9.43% | 7.58% | 33% | 1.88% | 107% |
Income Lab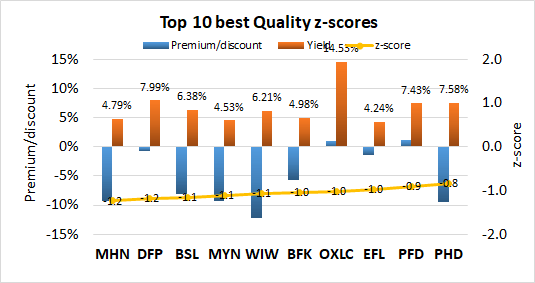
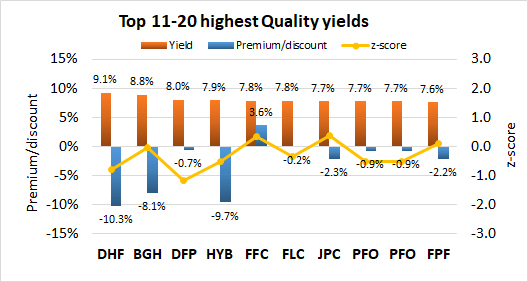
3. Top 20 highest quality yields
Some readers are mostly interested in obtaining income from their CEFs, so the following data presents the top 20 highest yielding CEFs. I’ve also included the premium/discount and z-score data for reference. Before going out and buying all 10 funds from the list, some words of caution: [i] higher yields generally indicate higher risk, and [ii] some of these funds trade at a premium, meaning you will be buying them at a price higher than the intrinsic value of the assets (which is why I’ve included the premium/discount and z-score data for consideration). Only funds with coverage >100% are considered. To make the charts more manageable, I’ve split the funds into two groups of 10.
| CEF | Category | Yield | P/D | Z | Lev | BE | Cov |
| (OXLC) | Senior Loans | 14.53% | 0.98% | -1.0 | 26% | 8.22% | 104% |
| (RSF) | High Yield | 10.79% | 2.32% | 2.5 | 37% | 6.53% | 172% |
| (EHI) | High Yield | 10.48% | -7.25% | -0.5 | 35% | 1.50% | 103% |
| (DSL) | Global Income | 10.35% | -4.63% | 0.5 | 32% | 1.50% | 116% |
| (EMD) | Emerging Market Income | 10.24% | -10.50% | -0.5 | 35% | 1.30% | 101% |
| (PHT) | High Yield | 10.21% | -8.47% | -0.7 | 33% | 1.14% | 107% |
| (TEI) | Emerging Market Income | 10.13% | -3.51% | 0.9 | 12% | 1.22% | 105% |
| (PGP) | Global Allocation | 10.06% | 5.24% | 0.7 | 41% | 1.66% | 104% |
| (KIO) | High Yield | 9.80% | -8.33% | -0.6 | 41% | 2.12% | 106% |
| (ARDC) | Senior Loans | 9.22% | -9.43% | -0.7 | 26% | 2.08% | 112% |
| (DHF) | High Yield | 9.15% | -10.33% | -0.8 | 33% | 1.28% | 103% |
| (BGH) | High Yield | 8.82% | -8.11% | -0.1 | 30% | 1.62% | 122% |
| (DFP) | Preferreds | 7.99% | -0.70% | -1.2 | 37% | 1.06% | 115% |
| (HYB) | High Yield | 7.94% | -9.68% | -0.5 | 30% | 1.13% | 104% |
| (FFC) | Preferreds | 7.82% | 3.63% | 0.4 | 37% | 0.86% | 112% |
| (FLC) | Preferreds | 7.80% | -0.21% | -0.3 | 38% | 0.83% | 111% |
| (JPC) | Preferreds | 7.74% | -2.26% | 0.4 | 38% | 1.32% | 102% |
| (PFO) | Preferreds | 7.72% | -0.88% | -0.5 | 37% | 1.29% | 111% |
| (HFRO) | Senior Loans | 7.72% | -23.89% | -0.6 | 11% | 1.61% | 116% |
| (FPF) | Preferreds | 7.58% | -2.18% | 0.1 | 33% | 1.33% | 100% |
Income Lab Income Lab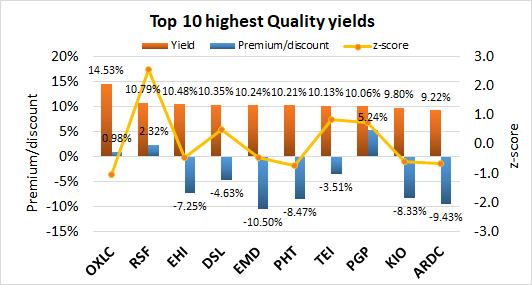
4. Top 10 best combination of quality yield and discount
For possible buy candidates, it’s probably a good idea to consider both yield and discount. Buying a CEF with both a high yield and discount not only gives you the opportunity to capitalize from discount contraction, but you also get “free” alpha every time the distribution is paid out. This is because paying out a distribution is effectively the same as liquidating the fund at NAV and returning the capital to the unitholders. I considered several ways to rank CEFs by a composite metric of both yield and discount. The simplest would be yield + discount. However, I disregarded this because yields and discounts may have different ranges of absolute values and a sum would be biased toward the larger set of values. I finally settled on the multiplicative product, yield x discount. This is because I consider a CEF with 7% yield and 7% discount to be more desirable than a fund with 2% yield and 12% discount, or 12% yield and 2% discount, even though each pair of quantities sum to 14%. Multiplying yield and discount together biases toward funds with both high yield and discount. Since discount is negative and yield is positive, the more negative the “DxY” metric, the better. Only funds with >100% coverage are considered. The DxY score is scaled by 100.
| CEF | Category | P/D | Yield | Z | DxY | Lev | BE | Cov |
| (HFRO) | Senior Loans | -23.89% | 7.72% | -0.6 | -1.8 | 11% | 1.61% | 116% |
| (EMD) | Emerging Market Income | -10.50% | 10.24% | -0.5 | -1.1 | 35% | 1.30% | 101% |
| (DHF) | High Yield | -10.33% | 9.15% | -0.8 | -0.9 | 33% | 1.28% | 103% |
| (ARDC) | Senior Loans | -9.43% | 9.22% | -0.7 | -0.9 | 26% | 2.08% | 112% |
| (PHT) | High Yield | -8.47% | 10.21% | -0.7 | -0.9 | 33% | 1.14% | 107% |
| (KIO) | High Yield | -8.33% | 9.80% | -0.6 | -0.8 | 41% | 2.12% | 106% |
| (HYB) | High Yield | -9.68% | 7.94% | -0.5 | -0.8 | 30% | 1.13% | 104% |
| (WIW) | Investment Grade | -12.27% | 6.21% | -1.1 | -0.8 | 35% | 0.76% | 212% |
| (BGX) | Senior Loans | -10.09% | 7.55% | -0.7 | -0.8 | 40% | 2.06% | 112% |
| (EHI) | High Yield | -7.25% | 10.48% | -0.5 | -0.8 | 35% | 1.50% | 103% |
Income Lab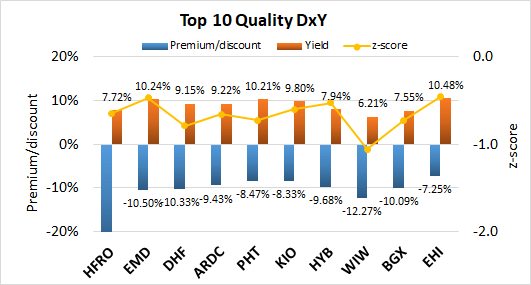
5. Top 10 best combination of quality yield, discount and z-score
This is my favorite metric because it takes into account all three factors that I always consider when buying or selling CEFs: Yield, discount and z-score. The composite metric simply multiplies the three quantities together. A screen is applied to only include CEFs with a negative one-year z-score. As both discount and z-score are negative while yield is positive, the more positive the “DxYxZ” metric, the better. Only funds with >100% coverage are considered. The DxYxZ score is scaled by 100.
| CEF | Category | P/D | Yield | Z | DxYxZ | Lev | BE | Cov |
| (HFRO) | Senior Loans | -23.89% | 7.72% | -0.6 | 1.2 | 11% | 1.61% | 116% |
| (WIW) | Investment Grade | -12.27% | 6.21% | -1.1 | 0.8 | 35% | 0.76% | 212% |
| (DHF) | High Yield | -10.33% | 9.15% | -0.8 | 0.7 | 33% | 1.28% | 103% |
| (PHT) | High Yield | -8.47% | 10.21% | -0.7 | 0.6 | 33% | 1.14% | 107% |
| (PHD) | Senior Loans | -9.43% | 7.58% | -0.8 | 0.6 | 33% | 1.88% | 107% |
| (BSL) | Senior Loans | -8.05% | 6.38% | -1.1 | 0.6 | 34% | 1.77% | 108% |
| (ARDC) | Senior Loans | -9.43% | 9.22% | -0.7 | 0.6 | 26% | 2.08% | 112% |
| (BGX) | Senior Loans | -10.09% | 7.55% | -0.7 | 0.6 | 40% | 2.06% | 112% |
| (MHN) | New York Munis | -9.34% | 4.79% | -1.2 | 0.6 | 43% | 1.01% | 108% |
| (BGB) | Senior Loans | -9.81% | 6.69% | -0.8 | 0.5 | 38% | 2.17% | 108% |
Income Lab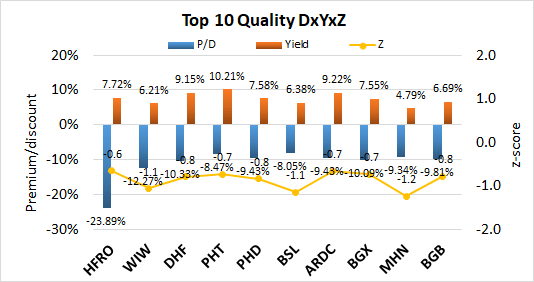
Be the first to comment