

piranka
The Saba Closed-End Funds ETF (BATS:CEFS) is an actively-managed CEF fund of funds, investing in dozens of bond and equity CEFs. CEFS is actively-managed, and aims to boost returns, through investments in heavily discounted, high-quality, high-yield CEFs, as well as through activist campaigns aimed at narrowing CEF discounts. CEFS also attempts to reduce risk, through interest rate hedging and similar activities. The fund’s strategy has been a resounding success in the past, with the fund significantly outperforming its peers since inception, and for most relevant time periods.
CEFS’s diversified holdings, strong 8.9% forward dividend yield, and industry-beating returns make the fund a buy. The fund’s strong yield make it a particularly compelling opportunity for income investors and retirees.
CEFS – Holdings Analysis
CEFS is an actively-managed CEF fund of funds, investing in dozens of bond and equity CEFs. CEFS holdings are incredibly diversified, with exposure to most relevant asset classes, over 70 CEFs, and thousands of underlying securities.
CEFS’s asset class exposure is incredibly broad, with investments in:
- Global equity funds, including the Voya Global Equity Dividend and Premium Opportunity Fund (IGD)
- Emerging market equity funds, including the Voya Emerging Markets High Income Dividend Equity (IHD)
- MLPs, including the Center Coast Brookfield MLP & Energy Infrastructure Fund (CEN)
- High yield bonds, including the Delaware Ivy High Income Opportunities Fund (IVH)
- Municipal bonds, including the Delaware Investments National Municipal Income Fund (VFL)
- Emerging market debt, including the Morgan Stanley Emerging Markets Debt Fund (MSD) and more.
As should be clear from the above, CEFS holdings are incredibly well-diversified. Each of the fund’s underlying holdings is a diversified fund with exposure to at least dozen, generally hundreds, of securities, including bonds, equities, and similar.
CEFS generally focuses on bonds and other fixed income assets, as most CEFs do likewise. Current asset allocations are as follows.
CEFS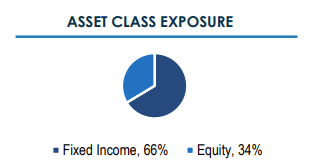
The fund’s ten largest holdings are as follows.
CEFS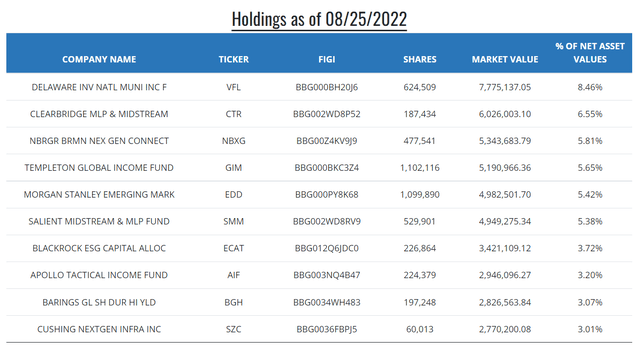
Asset class weights and security selections are partly an active management decision, meant to increase returns while minimizing risks. As an example, the fund is currently overweight MLPs, with these accounting for between 15%-20% the value of the fund, almost certainly because CEFS managers believe said asset class will outperform in the future. MLPs have outperformed YTD, so this seems like a reasonable, effective decision, so far at least.
CEFS’s asset class exposure is not completely exhaustive or balanced. There are few / none U.S. equity, developed market, investment-grade bond, or BDC funds, for instance. On the other hand, CEFS does invest in some broader CEFS, with some exposure to these securities. Some asset classes are significantly overweight, including MLPs and emerging markets. Still, CEFS is an incredibly well-diversified, balanced, fund, and could function as a core portfolio holding.
CEFS’s diversification is significantly higher than average, as the average fund or index focuses on a single asset class. Diversification is slightly lower compared to other fund of funds, including the Invesco CEF Income Composite Portfolio ETF (PCEF), as these tend to follow broader indexes, and as CEFS lacks significant exposure to some sub-asset classes.
In any case, CEFS is an incredibly well-diversified fund. Diversification reduces portfolio risk and volatility, and is a significant benefit for the fund and its shareholders. CEFS is also diversified enough that significant over-performance or underperformance are both incredibly unlikely: there are simply too many different asset classes and holdings for that.
CEFS – Dividend Analysis
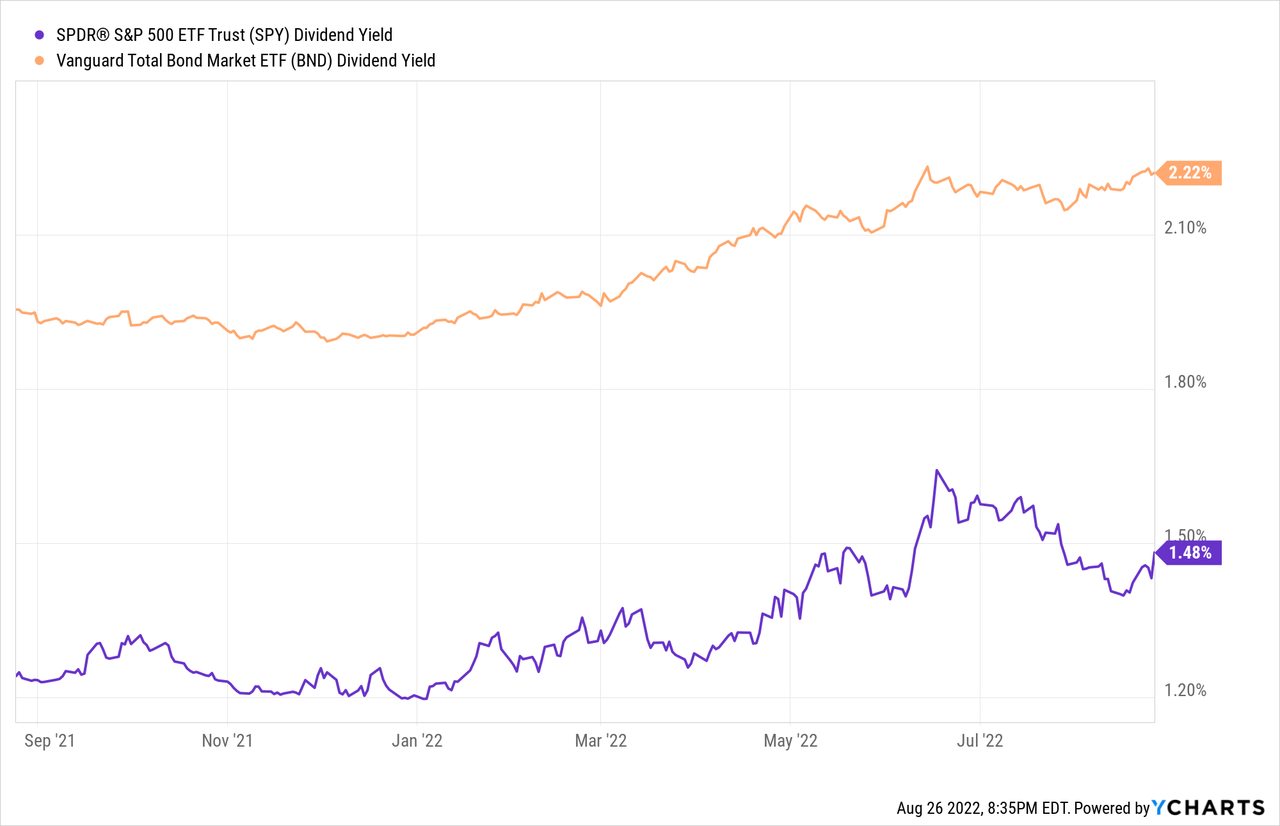
CEFS currently yields 8.9%, after excluding a special distribution in December 2021. It is an incredibly strong yield, significantly higher than that of most asset and sub-asset classes, including equities and bonds.
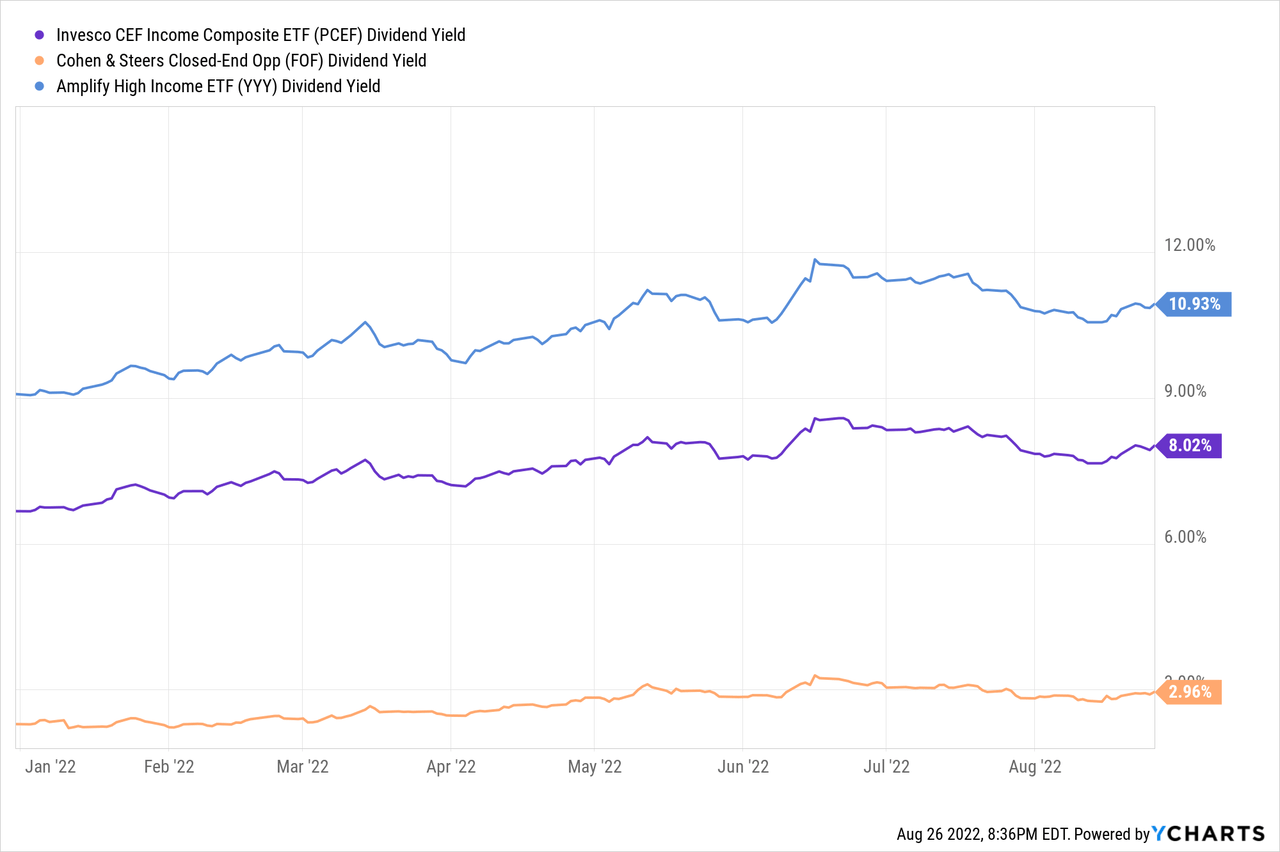
It is also slightly higher than two other good fund of CEFS, the Invesco CEF Income Composite Portfolio ETF (PCEF), and the Cohen & Steers Closed-End Opportunity Fund (FOF). It is moderately lower than the 10.9% yield offered by the Amplify High Income ETF (YYY), but YYY tracks a subpar, ineffective index, which causes many significant issues for the fund and its shareholders. CEFS yields less than YYY, but is a much stronger overall fund, in my opinion at least.
CEFS’s yield has remained more or less stable since inception, although there was a tiny bit of growth soon after inception, and the fund paid the aforementioned special distribution in late 2021. Dividend stability is prized by many income investors and retirees, and CEFS does offer that.
CEFS’s yield is mostly covered by underlying generation of income, but not completely. As per the most recent tax sheet and fact sheet, the fund’s dividend coverage ratio oscillates between 70% and 80%. It is not a terrible coverage ratio, but higher would have definitely been ideal.
CEFS relies on capital gains, asset appreciation, trading gains, and the like to fund the remainder of its dividends (20% to 30%). Insofar as the fund is able to generate sufficient capital gains, dividends should be stable and sustainable, and the fund will not be forced to engage in destructive return of capital distributions and the like.
CEFS has generated more or less sufficient capital gains to cover its dividends since inception, as evidenced by its (mostly) stable share price since inception. There has been a small drop in the past few months, in part due to recent market weakness, and in part due to the aforementioned special distribution in 2021.
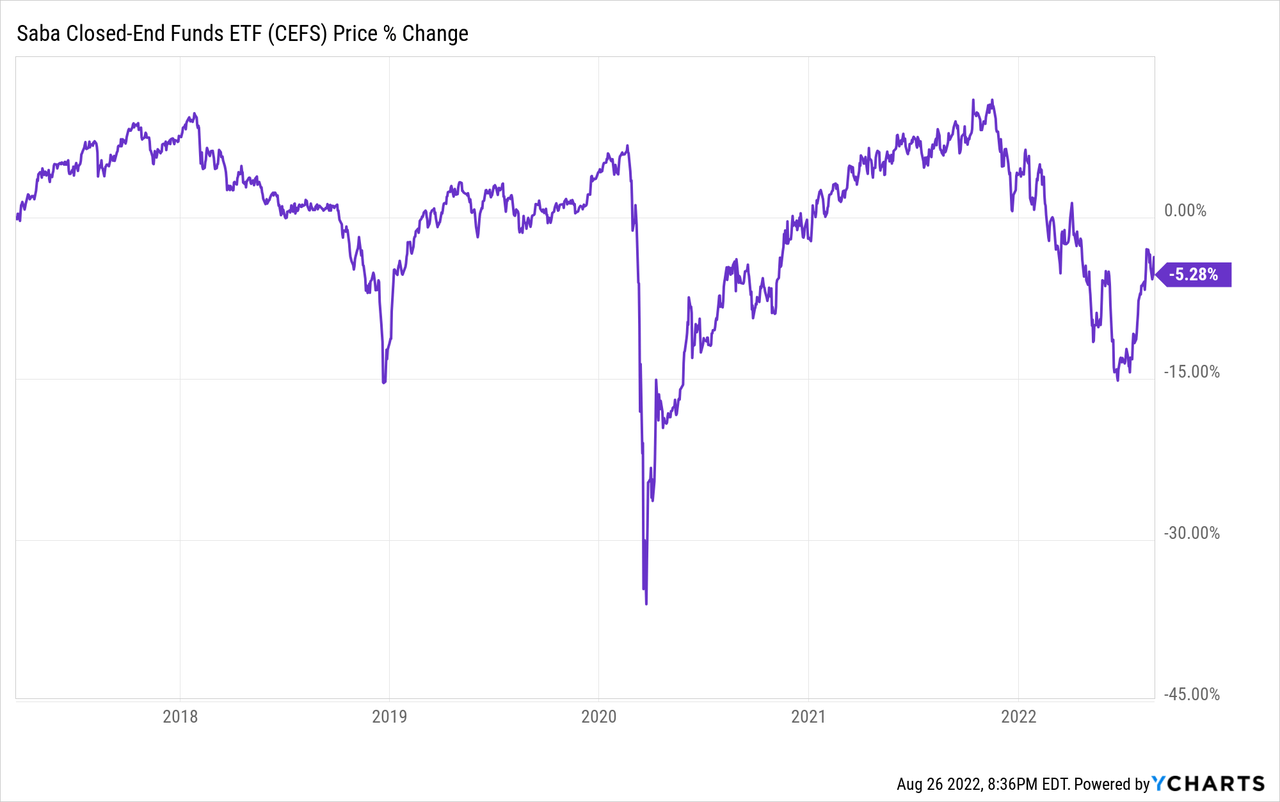
CEFS has paid the same dividend and maintained stable capital levels since inception. In my opinion, this is strong evidence of a stable, long-term sustainable dividend, and one which will likely be sustained in the future. Few funds offer strong, sustainable +8.9% dividend yields, but CEFS does, a significant benefit for the fund and its shareholders.
CEFS – Performance Analysis
CEFS’s diversified holdings and strong 8.9% dividend yield are both important benefits, but relatively common too. Several funds, including PCEF, FOF, and YYY, have similar value propositions, for instance. CEFS’s key advantage and differentiator relative to these other funds is its strong performance track-record.
CEFS consistently outperforms relatively to PCEF, its closest peers and industry benchmark, and usually by a healthy margin. CEFS’s performance relative to YYY is even stronger, as the latter’s investment strategy consistently leads to subpar performance. CEFS’s performance relative to FOF is a bit more mixed, and more dependent on discounts, premiums, asset class weights, and the like. In general terms, FOF is stronger than CEFS if bought at a discount, in my opinion at least. FOF currently trades with a small 3% premium, and so is currently a materially weaker investment proposition relative to CEFS. I last covered FOF here.
Seeking Alpha – Chart by author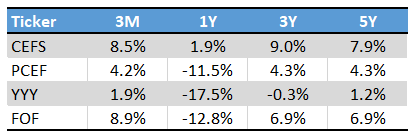
CEFS’s strong performance track-record is the result of an effective investment strategy, and consistent generation of alpha. CEFS consistently focuses on the right industries, picks the right funds, and implements effective investment strategies. Three examples stand out.
First, CEFS largest position for a couple of years has been a short position in U.S. treasuries, which functions as an interest rate hedge. If interest rates increase, treasury prices go down, and the fund’s short treasury position should see significant gains, and act as an interest rate hedge. Interest rates have increased for around two years, especially YTD, during which CEFS has outperformed, as expected.
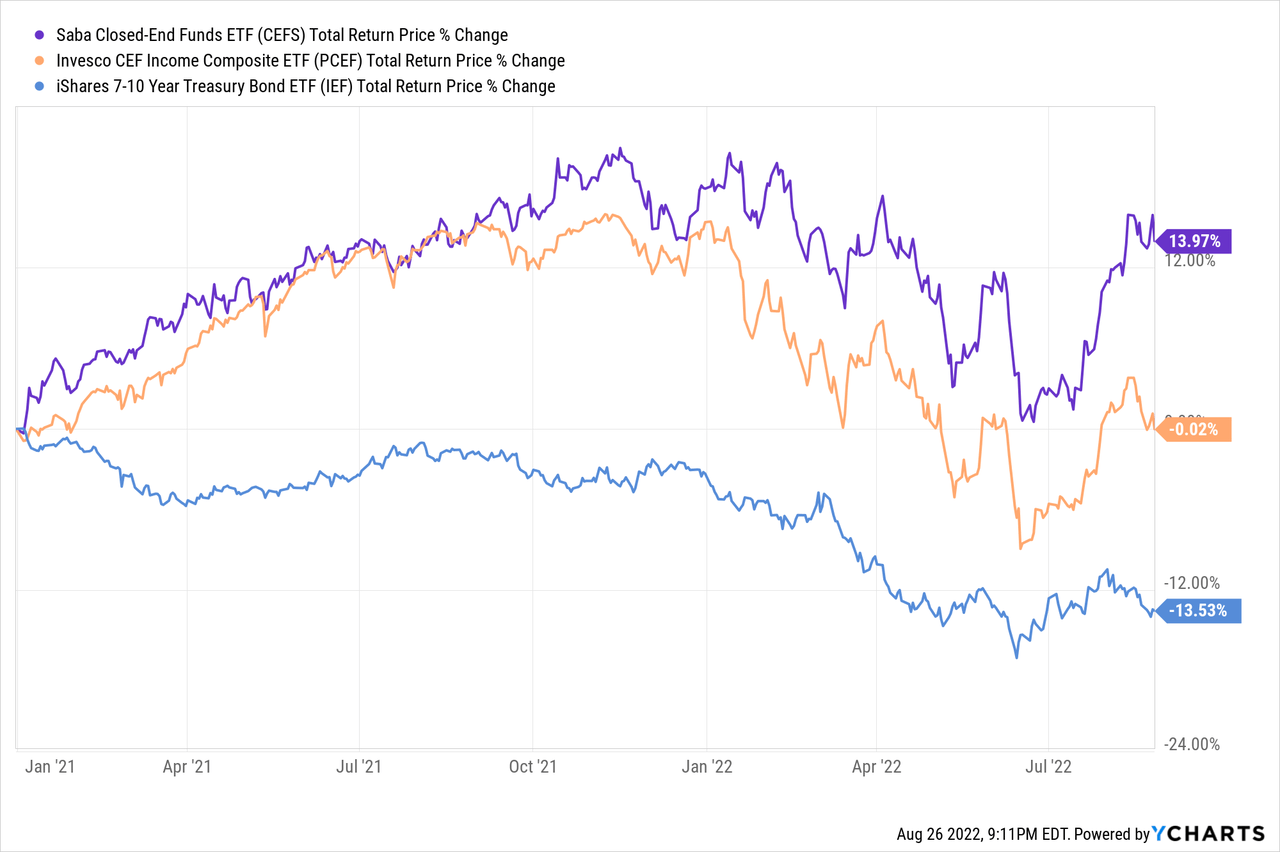
Importantly, and as can be seen above, CEFS’s relative performance was very clearly dependent / influenced by treasury performance. CEFS outperformed between January 2021 and April 2021, as treasuries went down. CEFS then underperformed from April 2021 to August 2021, as treasuries went up. Same overall situation with other time periods.
In my opinion, CEFS interest rate hedge will not lead to further gains and outperformance in the near future, as inflation and rates have both started to normalize. Still, said hedge was effective in the past, and strong evidence of a competent, effective investment management team, strategy, and fund.
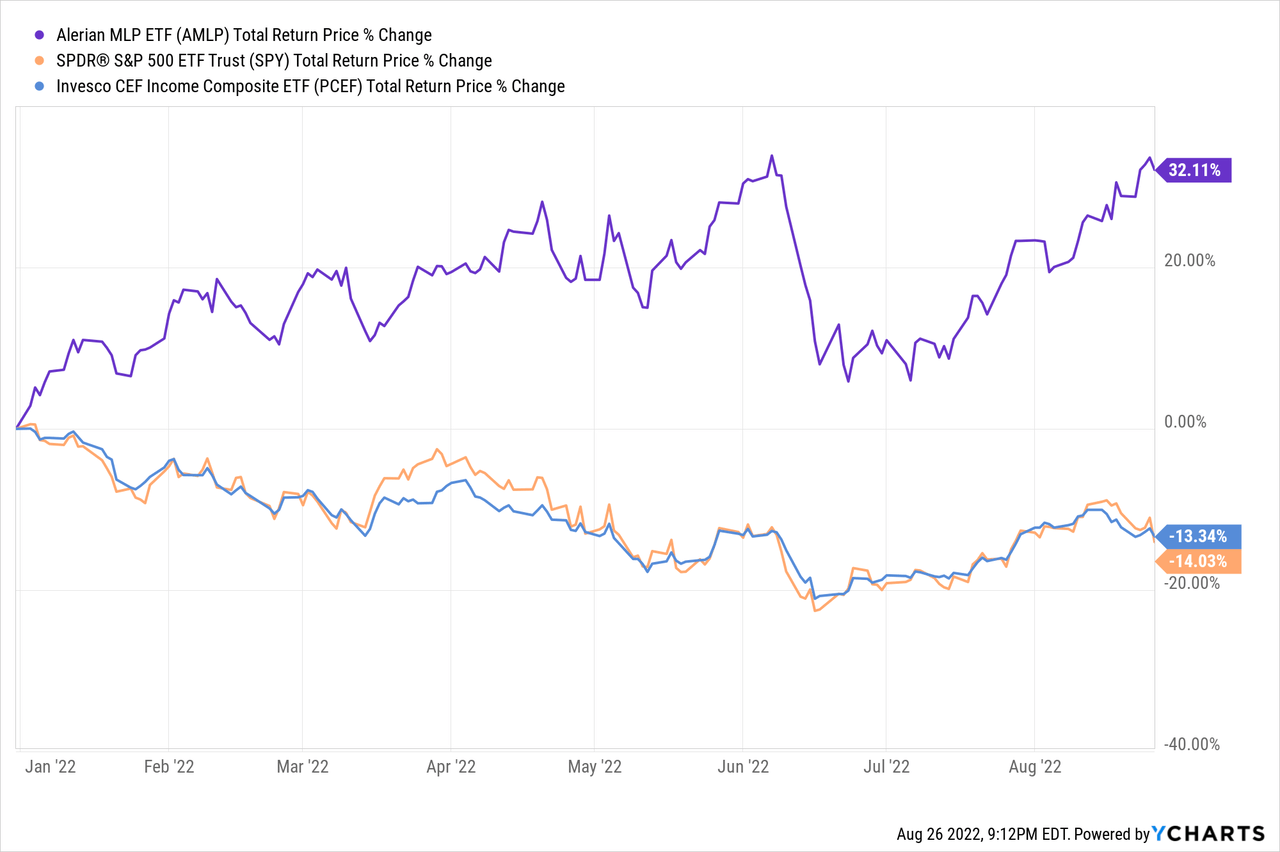
Second example of CEFS strong investment strategy, is the fund’s decision to overweight MLP CEFs in the recent past. MLPs have outperformed all year, as have most energy funds and investments, due to rising energy prices and improved investor sentiment. Overweighting these funds was a good idea, so far at least.
Third example, are the effective activist campaigns launched by CEFS’s parent company, Saba Capital. These vary, but most tend to consist of Saba buying a large position in a heavily discounted CEF, and then pressuring the fund into (attempting to) narrow the discount. As an example, Saba initiated a position in the Delaware Investments National Municipal Income Fund earlier in the year, pressured the company into launching a tender offer for up to 50% of its share at a tiny discount to NAV. VFL’s discount promptly narrowed, as traders bought heavily discounted shares to tender, until the arbitrage opportunity disappear.
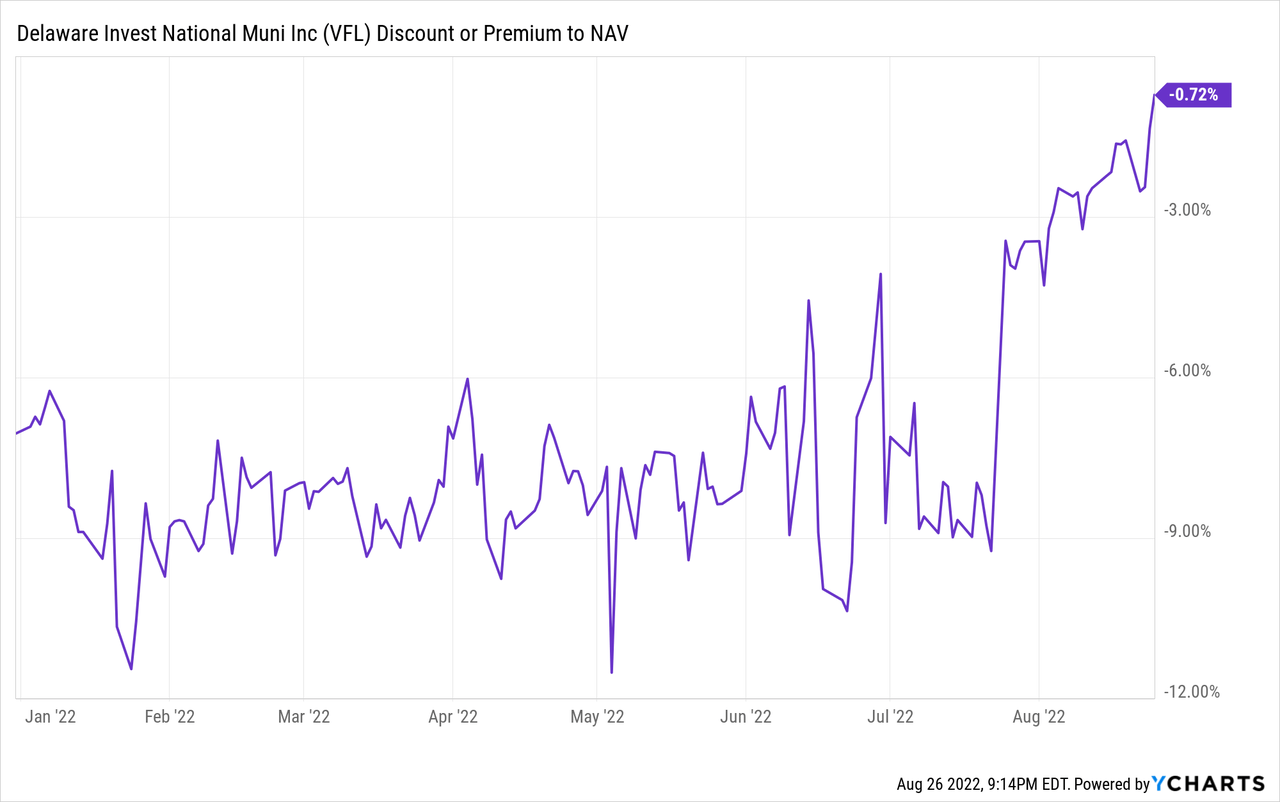
Narrowing discounts means higher share prices for the fund, and capital gains and market-beating returns for their shareholders. VFL has outperformed the average CEF YTD, as expected, although the difference has not been all that large.
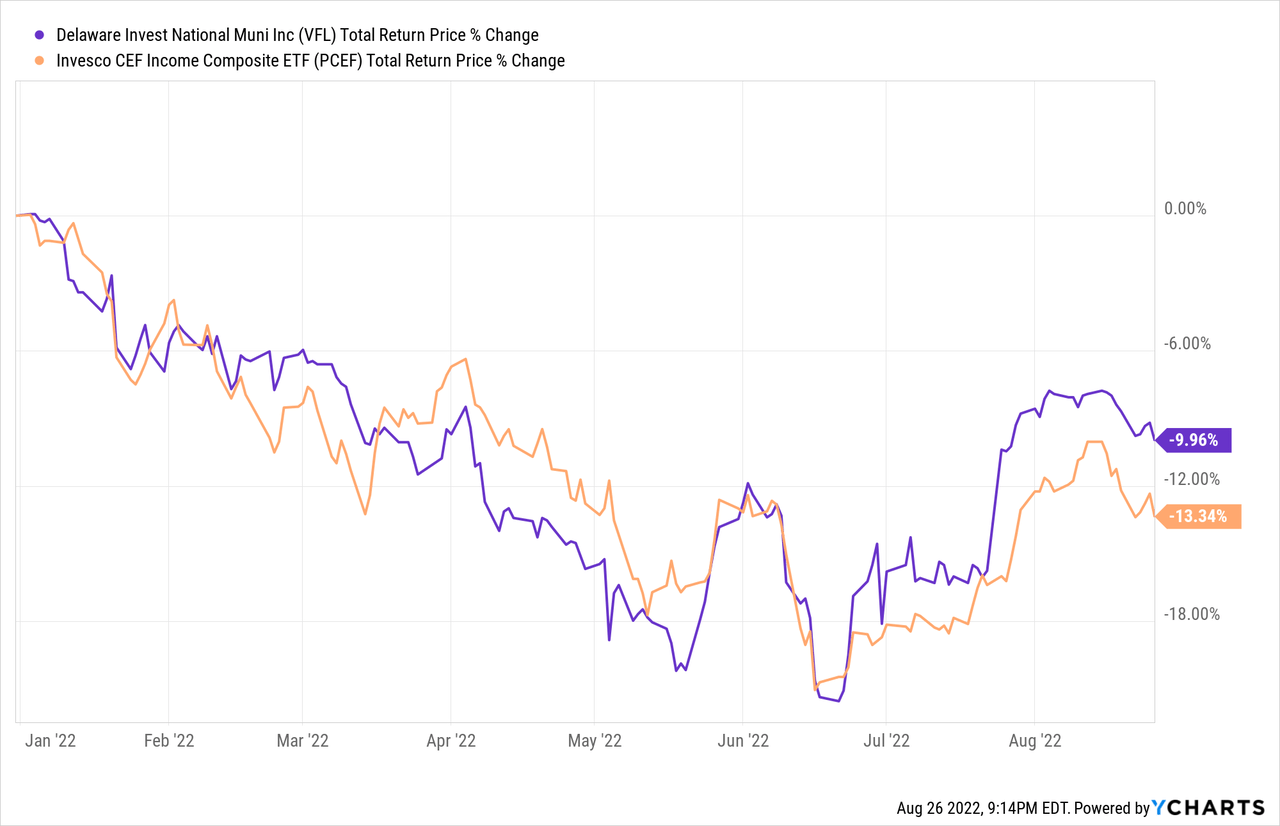
VFL is currently CEFS largest holding. VFL has outperformed YTD, in large part due to the machinations of Saba, so overweighting the fund, and launching the aforementioned activist campaign, was an effective strategy.
CEFS’s strong performance track-record is due to the strength and effectiveness of the fund’s investment strategy, and a significant benefit for the fund and its shareholders.
Conclusion – Buy
CEFS’s diversified holdings, strong 8.9% dividend yield, and industry-beating returns make the fund a buy.
Be the first to comment