

Fentino/E+ via Getty Images
Natural gas has been a roller coaster of a trade in 2022. For years, the power-producing commodity did a whole lot of nothing. Drilling for “natty” has become much more cost efficient through fracking than was seen before the 2008 price spike (though the all-time high happened during the hurricane-laden years of 2005). In the 2010s, Spigots could be turned on like a light switch, and new vast shale regions, such as the Permian and Marcellus, were being tapped. U.S. Henry Hub natural gas occasionally spiked above $6 during transitory weather events – like the 2014 Polar Vortex. Ultimately, prices settled back down to $2 to $4 from 2015 to 2019. Twenty-plus-year lows were even notched as recently as early 2020.
Natural Gas Price History Since 1990: 2022’s Breakout & Retest
Stockcharts.com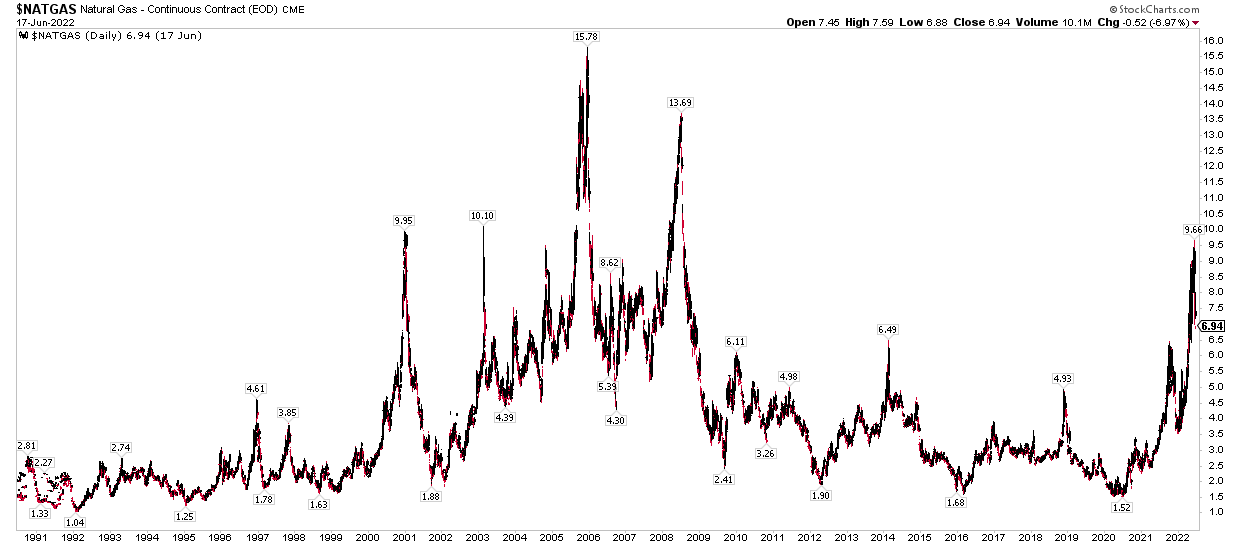
Like so many markets, the game changed during the pandemic. Operators went bankrupt domestically as profitability to pump gas dropped. Overseas, a broader trend was making headway – ESG. The environment, social, and corporate governance movement sought to end coal-fired power plants and steeply restrict even relatively clean natural gas usage. Solar and wind power were viewed as the renewable saviors.
As markets do, the pain trade began to take shape. Foreign demand for LNG surged and ex-U.S. prices went through the roof – this was before Putin invaded Ukraine. Markets like JKM, TTF, and NBP had parabolic LNG price charts in 2019 and 2020. Then Henry Hub started to participate. When Russia’s energy supply was all but cut off, things just got uglier.
Foreign LNG Price History
TradingView.com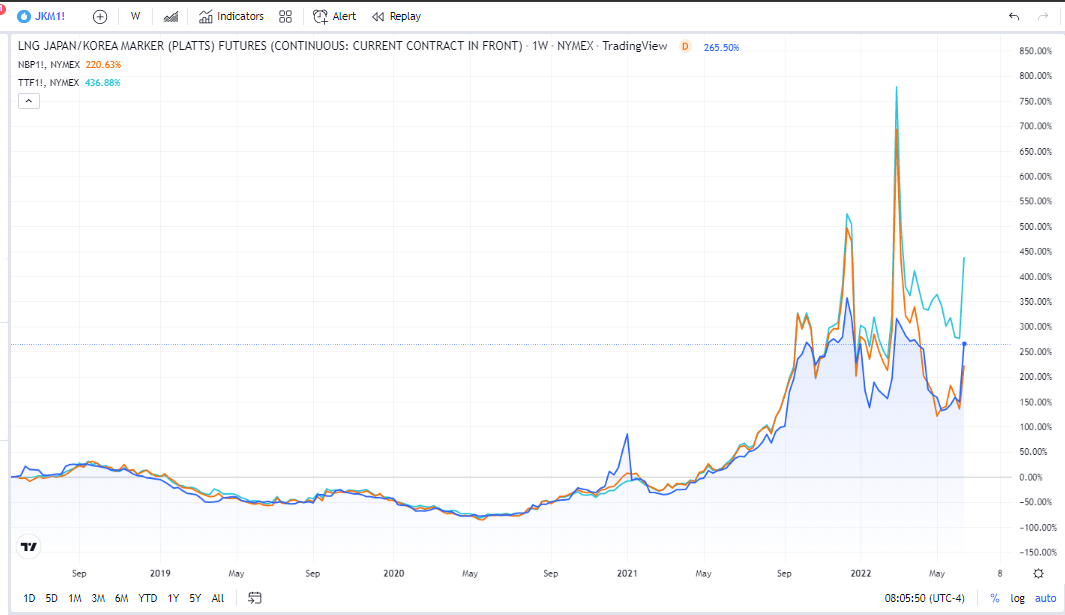
Global Natural Gas Price Points For LNG Exports
CelsiusEnergy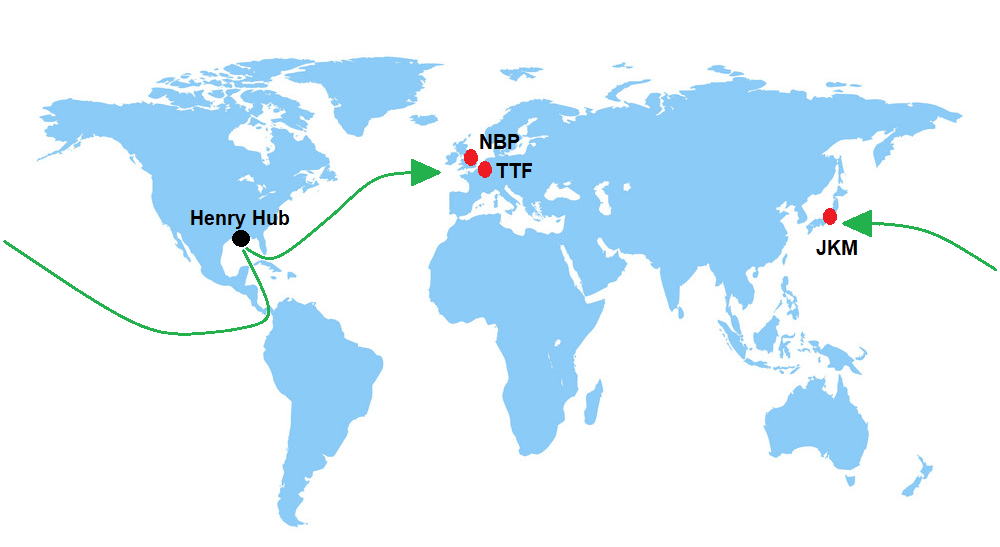
LNG Export Profitability Falls As Domestic Prices Rise And Foreign Markets Fall
BlueGoldTrader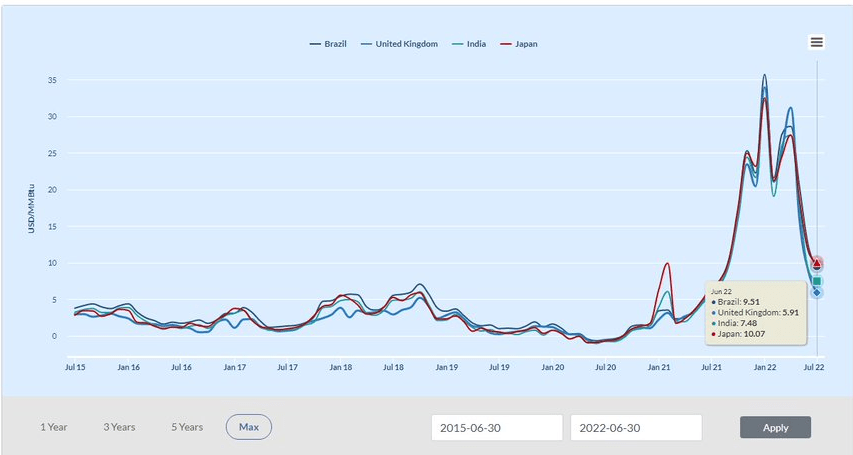
Earlier this year, domestic natural gas approached $10/MMBtu, the highest since shortly after the mid-2008 boom near $14. It quickly became apparent that years of under-investment and growing energy demand, partly fueled by the growth in electric vehicles, made for many bullish fundamentals.
Here in the States, we too were shuttering coal and nuclear plants at the behest of ESG proponents’ demands. Natural gas, seen as the transition fuel to the future, has seen production levels surge to all-time highs for this time of year, according to BlueGoldTrader.
Domestic NatGas Production At A New Seasonal High
BlueGoldTrader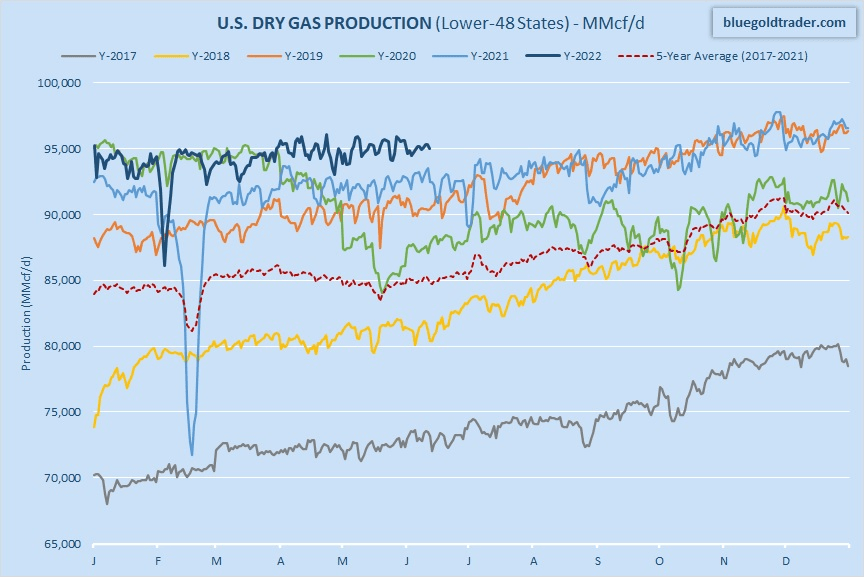
Fast-forward to today, and natural gas is way off its YTD highs. The recent bearish catalyst was a fire at the key Freeport, Louisiana LNG facility, effectively trapping the fuel at home. Unable to be exported, foreign LNG prices have once again spiked (though they are still below levels from last year).
That LNG terminal outage was so critical that it led to UNG’s second-worst day since its 2007 inception.
An 18% Freefall Following Freeport’s Fire Was UNG’s Second-Worst Session
Stockcharts.com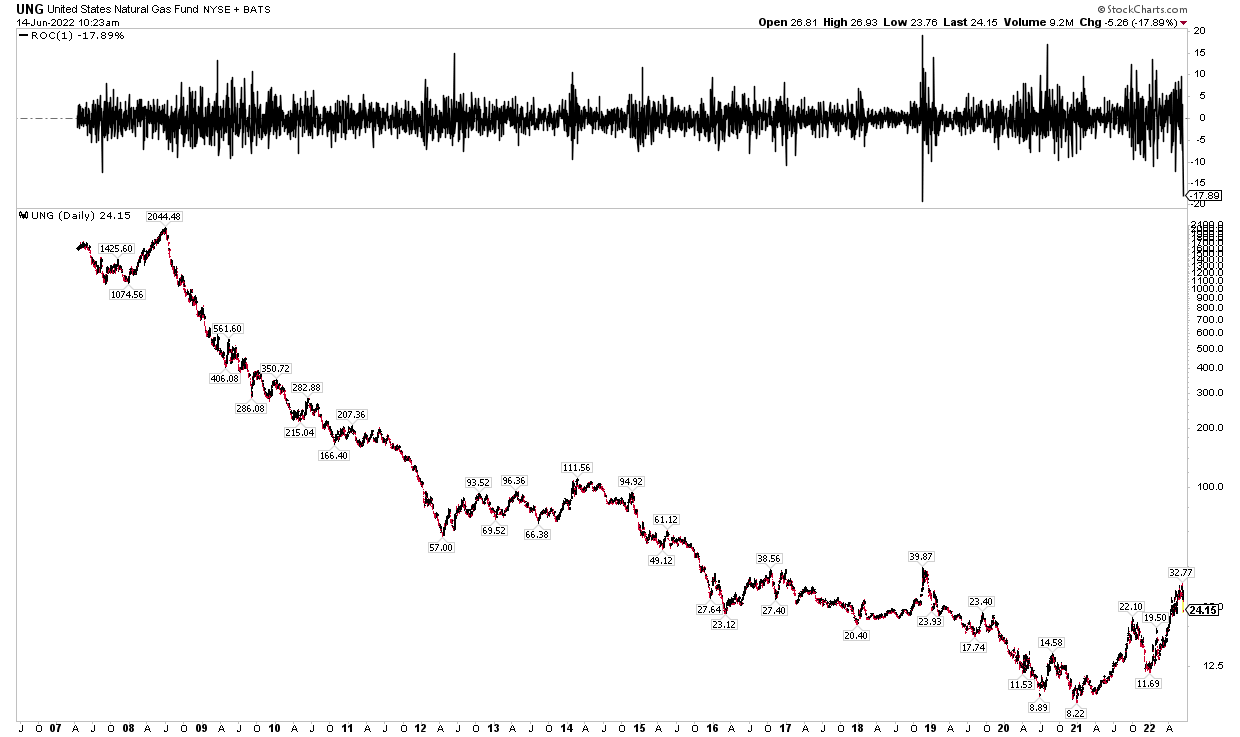
The current drawdown comes as this June is forecast to be the hottest on record for the CONUS, according to Maxar.
June 2022: Hottest Since 1950?
Maxar Technologies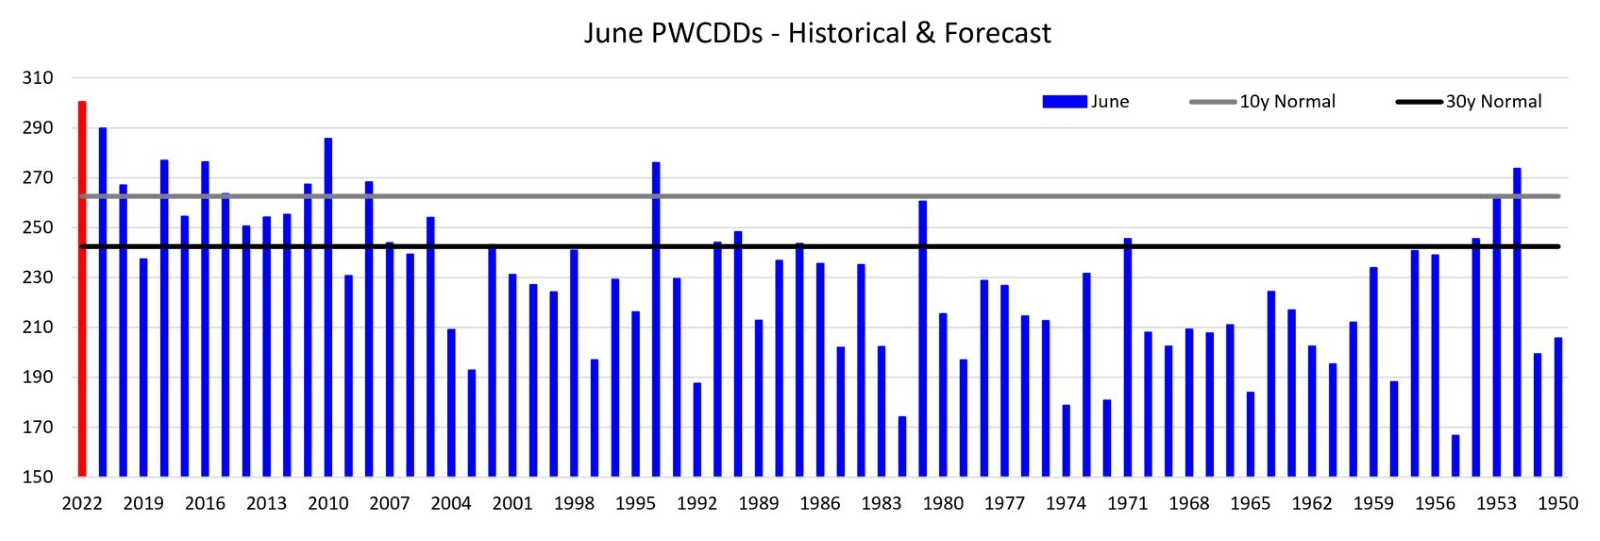
Amid these scorching temperatures, natural gas for power burn is pacing at record levels, according to HFI Research.
Record-High June Power Burn Demand
HFI Research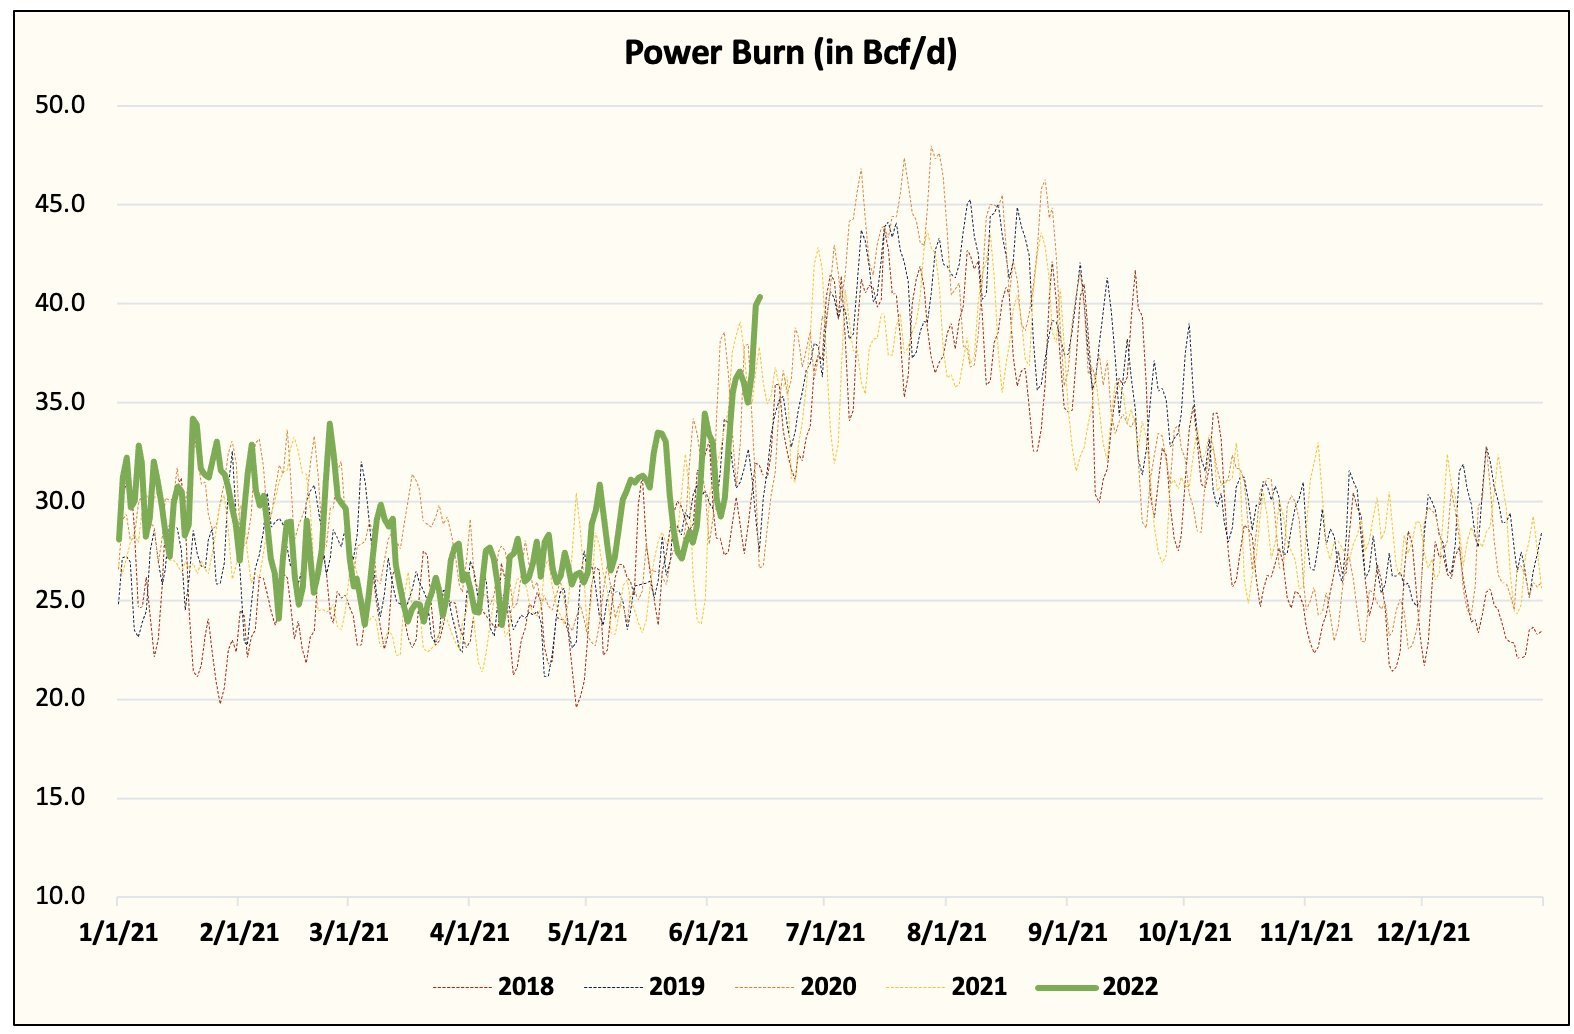
Having been a professional energy trader and risk analyst for many years here in Jacksonville, I keep a close watch on energy markets – both from a fundamental perspective and from the charts. Right now, I see support at $6.50. That level is key because it was the 2014 Polar Vortex-spike high and was the zenith during late 2021. It’s an important test underway as I write.
Natural Gas Continuous Prompt Month: $6.50 Support
Stockcharts.com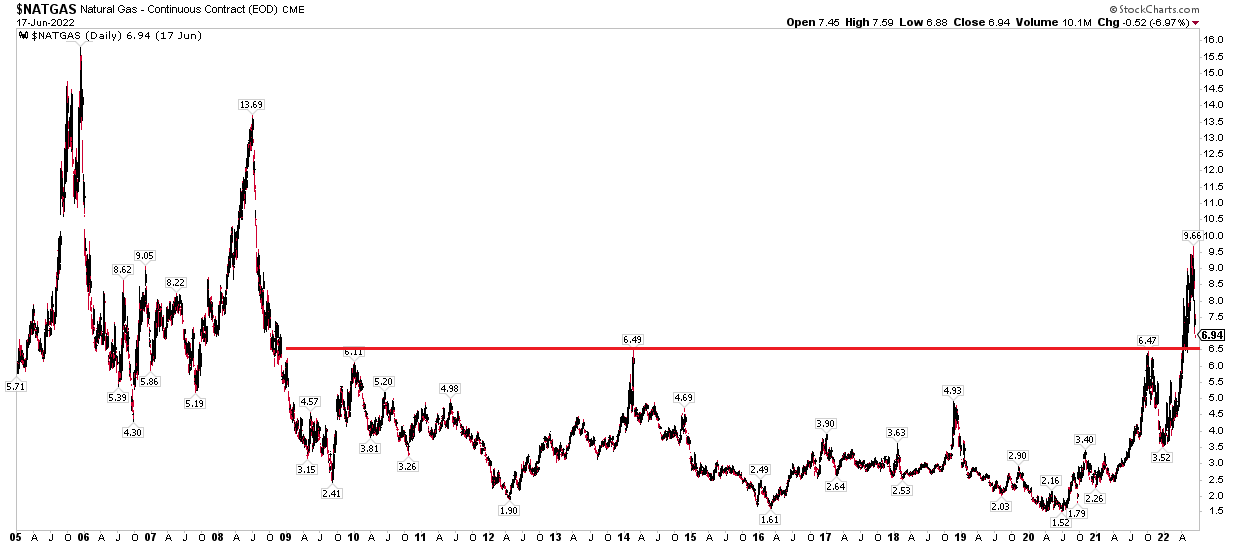
Retail traders can play it through the United States Natural Gas Fund, LP (NYSEARCA:UNG). The exchange-traded product offers exposure to near-dated natural gas futures contracts. With that, though, comes significant roll risk when the futures market is in contango. Right now, however, the market is in slight backwardation, so there is much less risk of losing out when the fund transitions its holdings to later-dated contracts. CelsiusEnergy.com is a great resource to track energy markets and charts, along with HFI Research and Blue Gold Trader. It was one of my go-to’s when I was on the desk.
Natural Gas Forward Prices: Slight Backwardation, Normal Winter Premium
CelsiusEnergy.com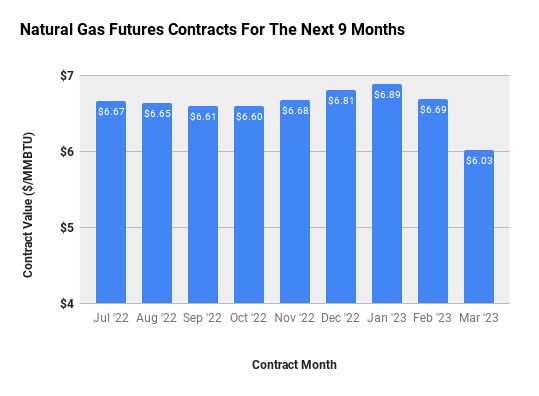
Seasonality is an important secondary factor to consider. On this the summer solstice, it is actually a bad time (historically) to get long natural gas futures, according to EquityClock.com.
Weak Price-Action, On Average, Now Through July
EquityClock.com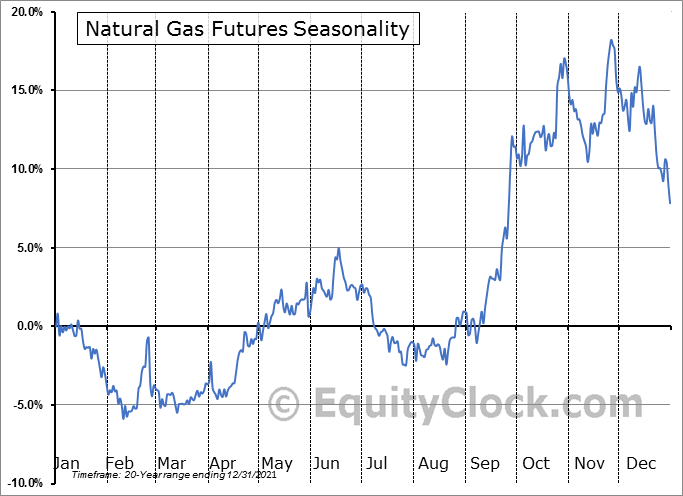
UNG Is Off To Its Hottest Start To A Year Since Its Inception
Stockcharts.com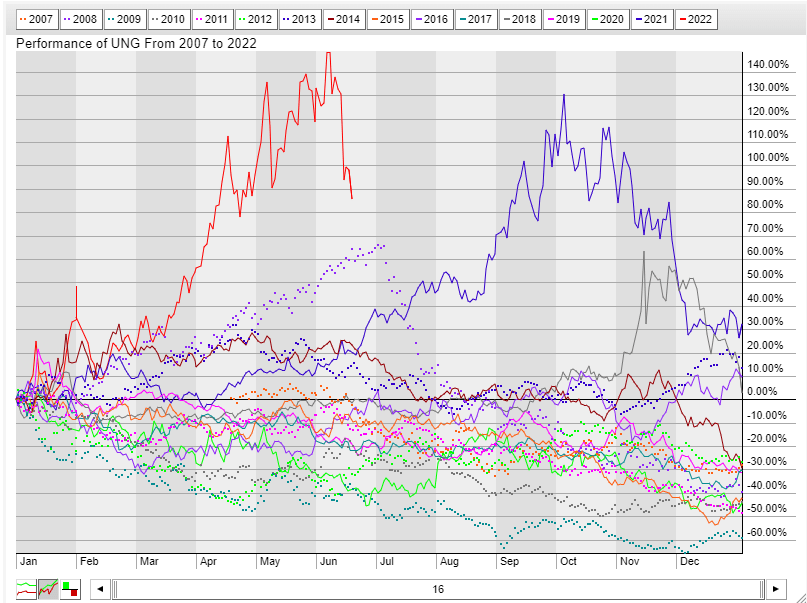
Natural Gas Is Among The Top-Performing Commodities In The Last Year
Koyfin Charts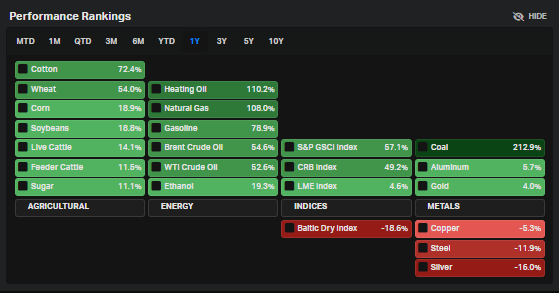
The Bottom Line
I’d be a buyer of NG right here, but with a stop under, say, $6 on the prompt month. You can use the front-month price chart of natural gas as your bogey as to how to trade UNG. Keep your eye on the charts, weather maps, and international developments. There are so many facets to this increasingly global commodity.
Be the first to comment