

MCCAIG
If only the market (NYSEARCA:DIA) could tell us where it is going. It just so happens that each of the Dow Index stocks does give us signals that, in summary, tell us where it is going. Below you will find our signals for each of the Dow stocks. This is not a foreign language and you can easily understand it yourself at a glance. If you don’t like looking at the signals for 30 stocks, we can use a short cut by just looking at the DIA chart below.
Why Is The Dow Going Down?
The Dow Index is in a bear market because it is looking out to the future and sees fundamental factors that are going to negatively impact the stock market. By now we are all familiar with the fundamentals that are driving this bear market. Just recently FedEx (FDX), Micron (MU) and Nike (NKE) reported bad earnings.
Does this mean that the October earnings season will be bearish? They will be more bearish in the first and second quarter of next year. How do we know that? The market is looking ahead and that is what it sees. It sees lower earnings, interest rates going up, high inflation, good returns from risk free Treasuries, a looming recession and the unemployment that brings. Companies like FDX are cutting costs and restricting headcount. When inflation eases, the Fed will ease and that will be close to the bottom of this bear market. It seems to be a long way off. That means this bear market continues to drop.
Supply Is Taking The Dow Down
We have circled on the list of Dow stocks shown below, our Demand, D, and Supply, S, reading for each stock in the Dow and show the total at the bottom of the D:S column. As you go down the column, you will see that all of the Dow stocks have Supply readings and none have Demand readings.
The Supply scale goes from a low of 1 to a maximum of 9. Extreme readings of Supply, like 7, 8 and 9 are color coded red because sellers are throwing these stocks out the window in a rush to get rid of them. We have circled these symbols for you. They are Coca-Cola (KO), McDonald’s (MCD), Goldman Sachs (GS), Visa (V), 3M (MMM), Intel (INTC), Dow (DOW) and Verizon (VZ).
On the other hand, a few of these stocks have low Supply scores and the selling may be over. We have circled names for you. They are Walmart (WMT), Johnson & Johnson (JNJ) and Merck (MRK). The stock with our highest, proprietary SID score, shown in the SID column is MRK. That is why it is at the top of this list of Dow stocks.
We show a color coded, 20-day bar chart tracking Demand and Supply for each stock, so you can see the short term buying and selling cycles for each stock.
Most Of The Dow Stocks Are Close To Their 52-Week Low
As you would expect in a bear market, stocks are going down to test their 52-week lows. We have circled all the 23 Dow stocks near their lows. The red percentage figure tells us the percent price is above the 52-week low. However, maybe that is a sign to buy these bargains.
We don’t guess, but we wait for the signals to turn up to tell us. We want to see our proprietary SID score improving and preferably moving above 80 for a Buy Signal. In the SID column you will find our Buy, Hold and Sell Signals. Buy is colored green, Hold is black and the Sell Signal is color coded red.
Right now none of the Dow stocks have our Buy Signal, which uses both fundamental and technical factors. The technicals are so poor, that most of the score is due to fundamentals. Thus, any score over 60 is good, even though none reached 80 and above for a buy signal.
All Thirty Stocks Have Our Technical Sell Signal
As you might suspect from our Supply scores discussed above, we would expect our short term, technical signal to be just as bad. It is and if you go down the Tech column, you will see that all 30 stocks have a Sell Signal in that column. So these two separate signals confirm the reasons we are seeing price weakness in the Dow and constant down side testing. As you will see on the chart below, the Dow just broke below its old bottom and is now looking for a new bottom. This tells us the DIA is going down to test the next support level at $280 shown on the Point & Figure chart shown below.
Only Seven Of The Dow Stocks Have Our Sell Signal
Seven stocks or 23% of the Dow stocks have our most important, SID Sell signal. The good news is that on a price weighted basis only 10% of the Dow has our proprietary Sell signal. By the time this bear market bottoms, we expect to see more than 20 Dow stocks with our Sell signal. This tells us that the bottom of this bear market is a long way off into 2023.
Here is the Dow Index list of 30 stocks showing our fundamental signals in the Fund column and our technical signals in the Tech column. Our most important Buy, Hold and Sell signal is in the SID column and it uses both fundamentals and technicals.
Supply Is Taking The Dow Index Lower (StocksInDemand.com)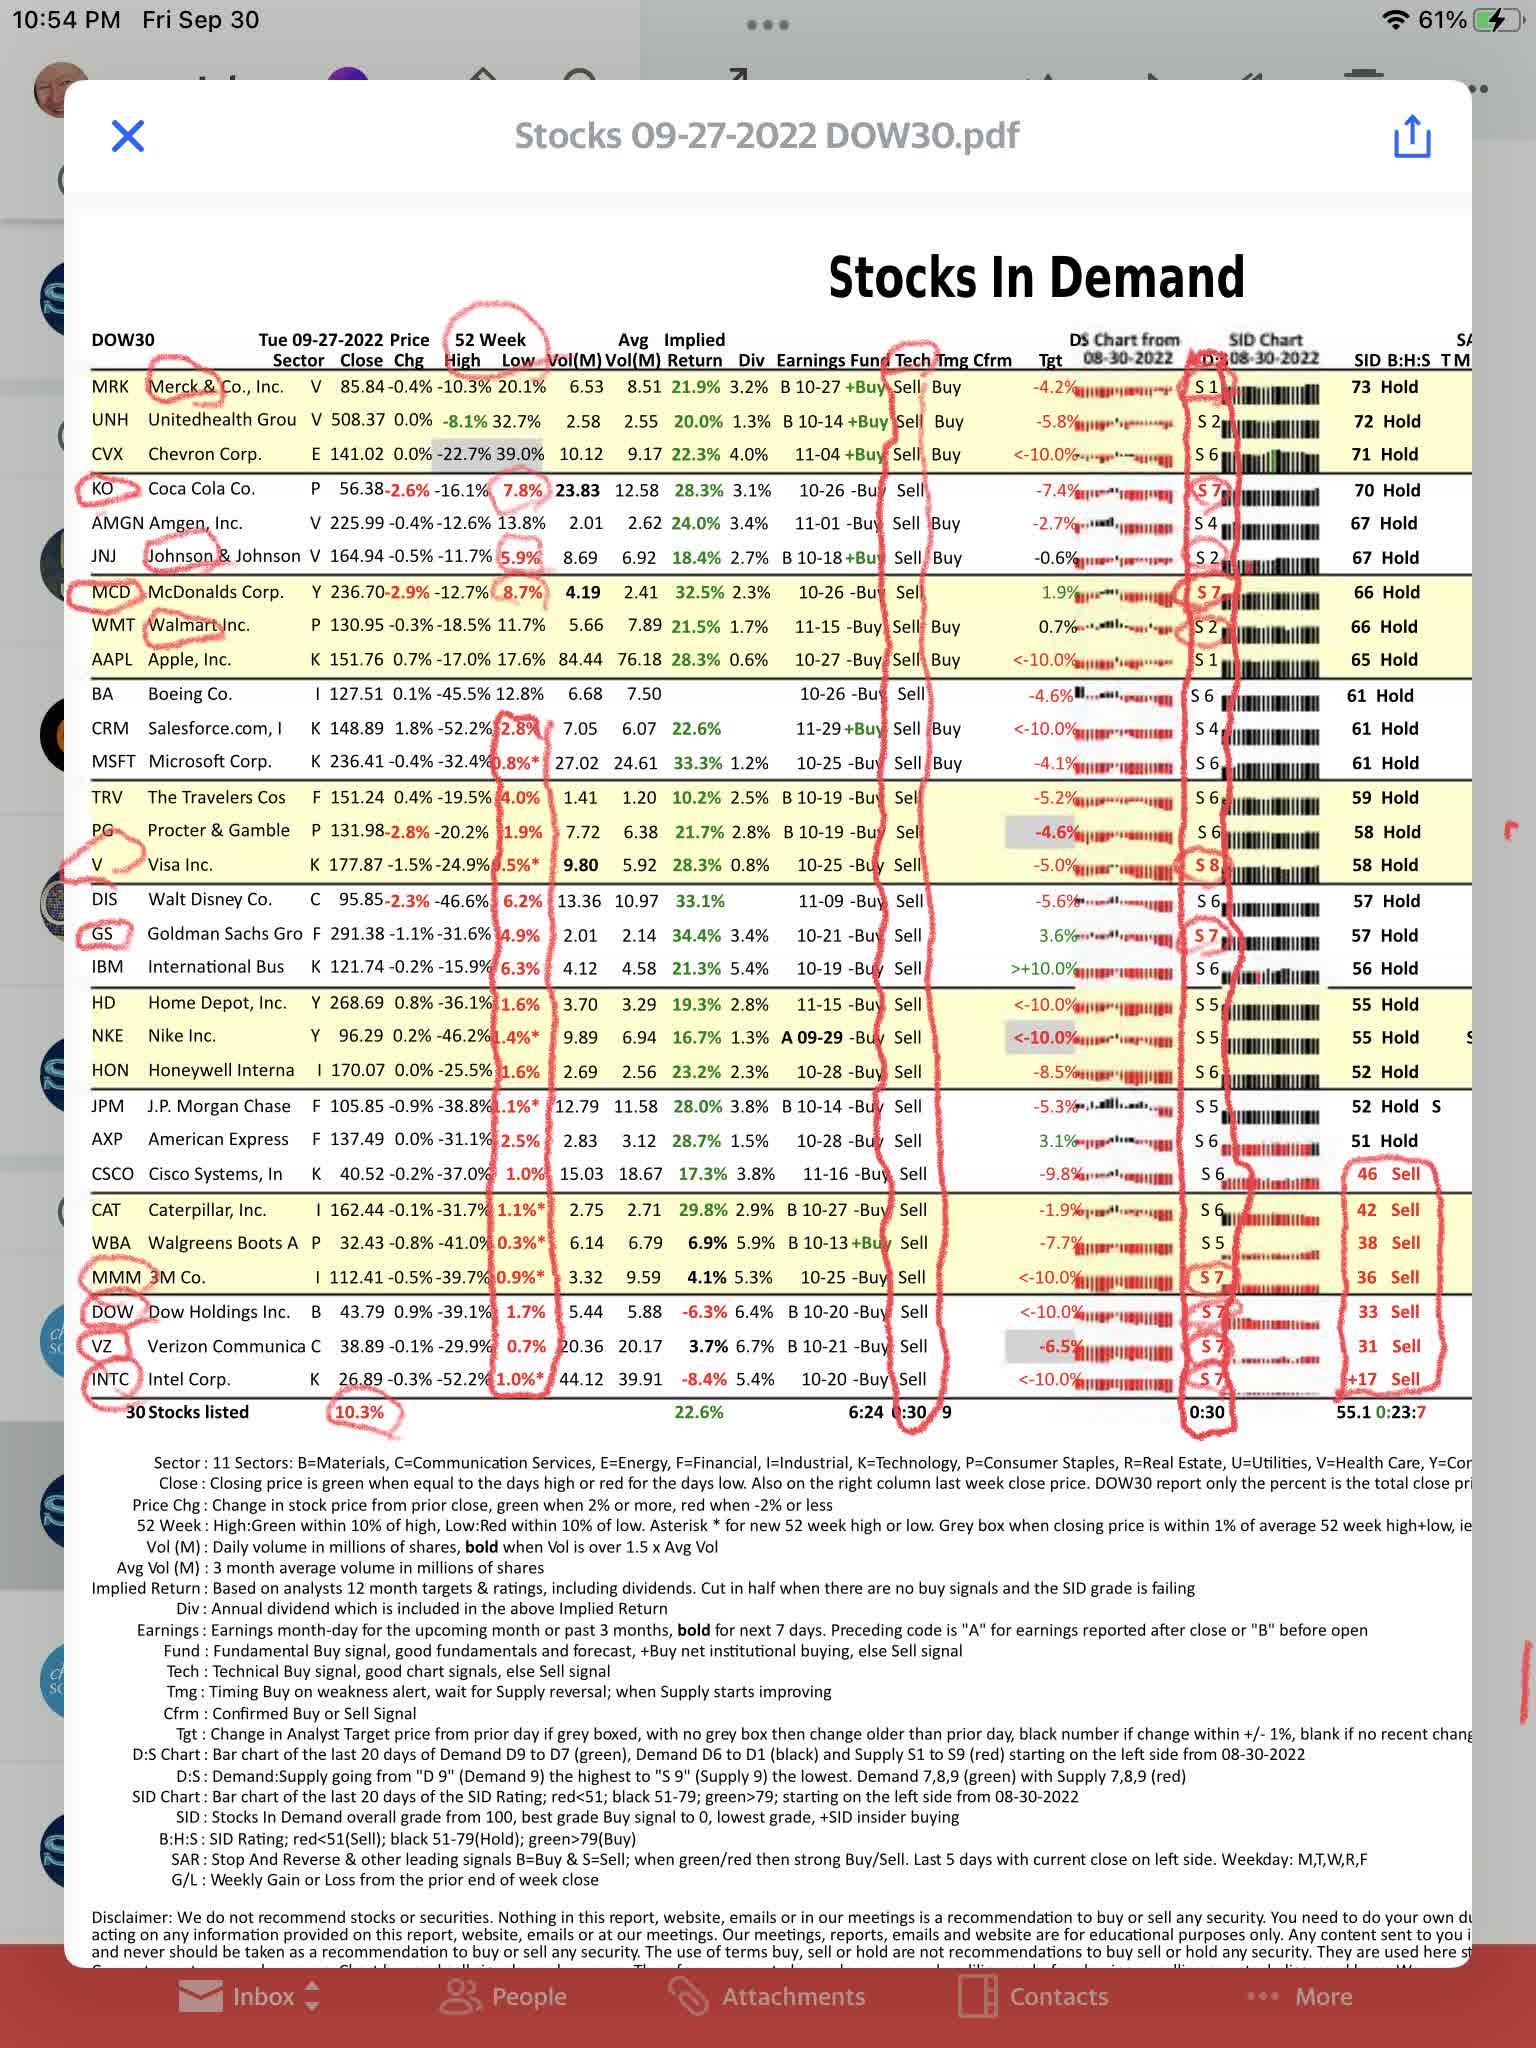
Here is the Point & Figure chart showing price breaking down and looking for a new bottom. The next support level is at $280.
DIA Targets $280 Support (StockCharts.com)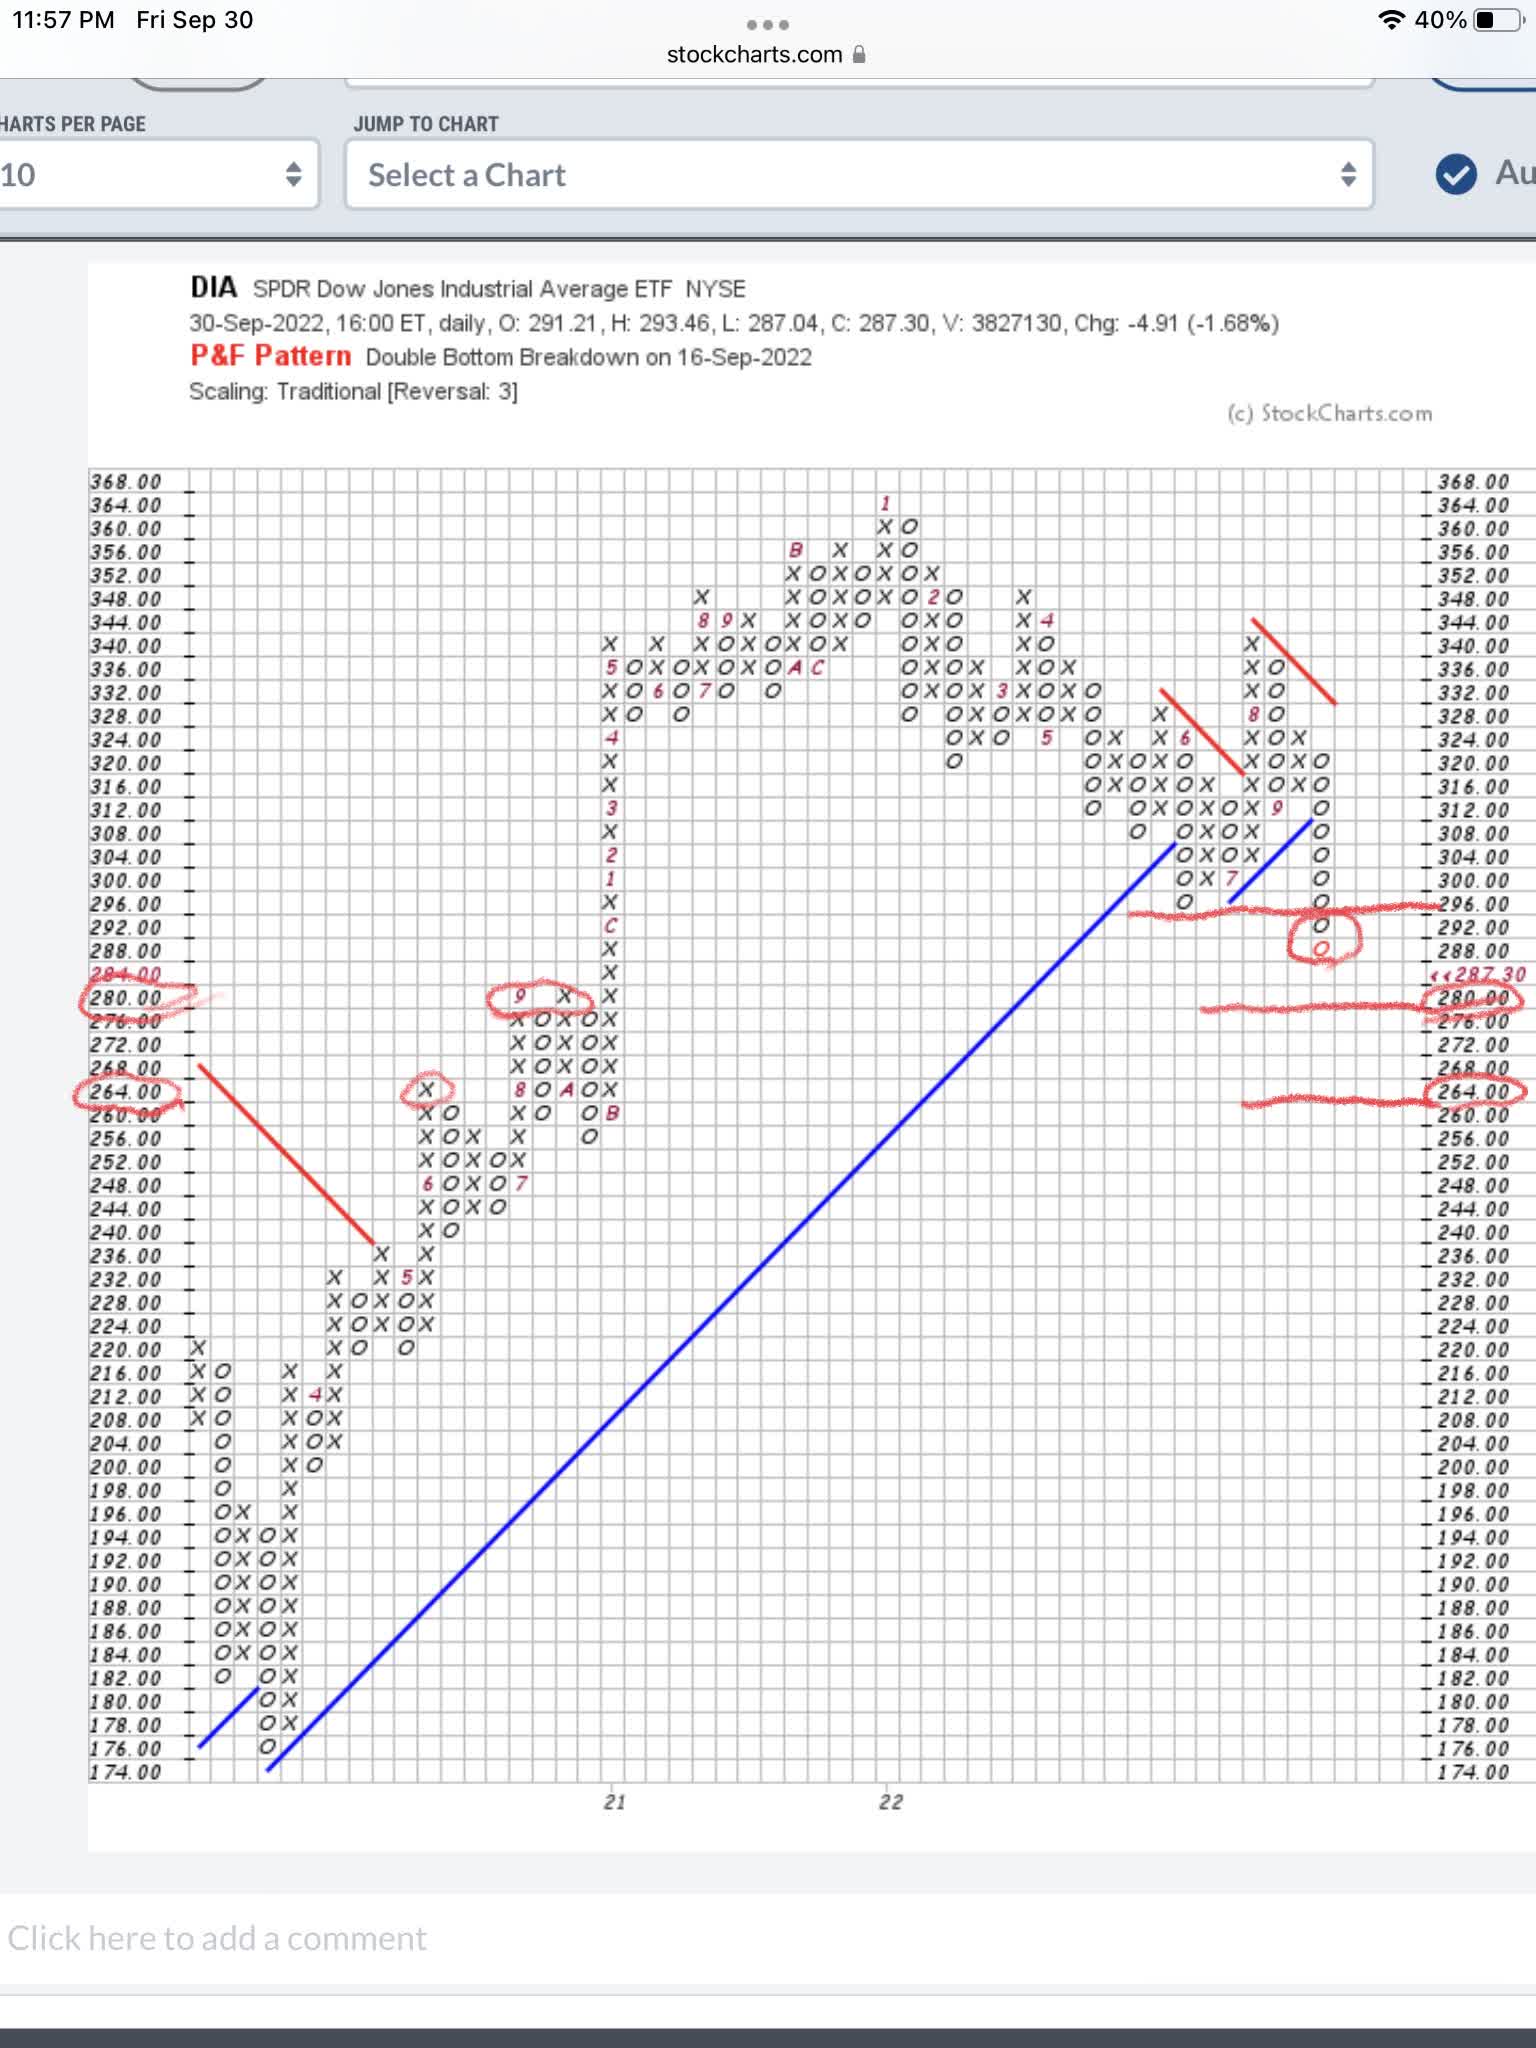
Be the first to comment