

tupungato/iStock via Getty Images
Passive index investing and strategic portfolios such as the 60/40 allocation are the two primary investment vehicles linked to retirement funds. The allocation to other markets, such as commodities and alternatives is small given their sluggish past performance and higher risks. There are also those who in hindsight made the right choices and invested in hedge funds with high returns. However, the majority of investors in passive index funds have already faced two major bear markets in the last three decades, and another one is on the horizon.
An understanding of the main points of this article requires looking at some data. The chart below shows the evolution of the S&P 500 index (SPY) annualized return (CAGR) starting in 1950.
Daily Chart of S&P 500 With Annualized Return Evolution (Price Action Lab Blog – Norgate Data)
By March 1956, CAGR had reached a high of about 13%. These were the post-WWII golden years of value investing. The Vietnam war and the arms race coupled with the cold war, in association with some wrong policies, caused a significant reduction in performance, during a normalization period. By the end of 1974, the CAGR had fallen to 6.6%, since maintaining a high annualized return for the market was not sustainable.
After about 20 years that included high inflation due to an energy crisis, a stock market crash in October 1987, and a long period of stagnation, the market had its strongest ever bull market due to technological innovation. The CAGR got as high as 9%, meaning that someone who invested in 1950, by 2000, or 50 years later, had an annualized return of 9% before dividend payouts. With dividend reinvestment, the annualized return was as high as 13.5%, and adjusted for inflation it was around 9%.
Unfortunately, the party did not last long and CAGR did not reach its previous highs. The growth of the 90s was followed by one of the worst busts in stock market history after the Great Depression. The CAGR fell to around 7.5% by 2003. After a few years of calm markets and a smooth uptrend at a low positive drift, the Financial Crisis came to raise doubts about the prospects of investing in equity markets. Even 60/40 investors faced significant losses in 2008, as was shown in another SA article.
The central bank had to step in to rescue the equity market’s credibility and a huge industry that has linked pensions to equity market performance. An unprecedented period of quantitative easing started with multiple distortions of economic variables the effects we may not have even seen yet. The central bank had no other choice but to intervene to mitigate risks. As it may be seen from the chart above, this unprecedented period did not do much to increase CAGR to levels above 9% or 10%. The reason for that was the already high historical volatility, and several minor and major corrections.
A chart of the 10-year rolling CAGR offers more clarity about the impact of volatility on equity market performance.
Daily Chart of S&P 500 With 10-Year Rolling Annualized Return (Price Action Lab Blog – Norgate Data)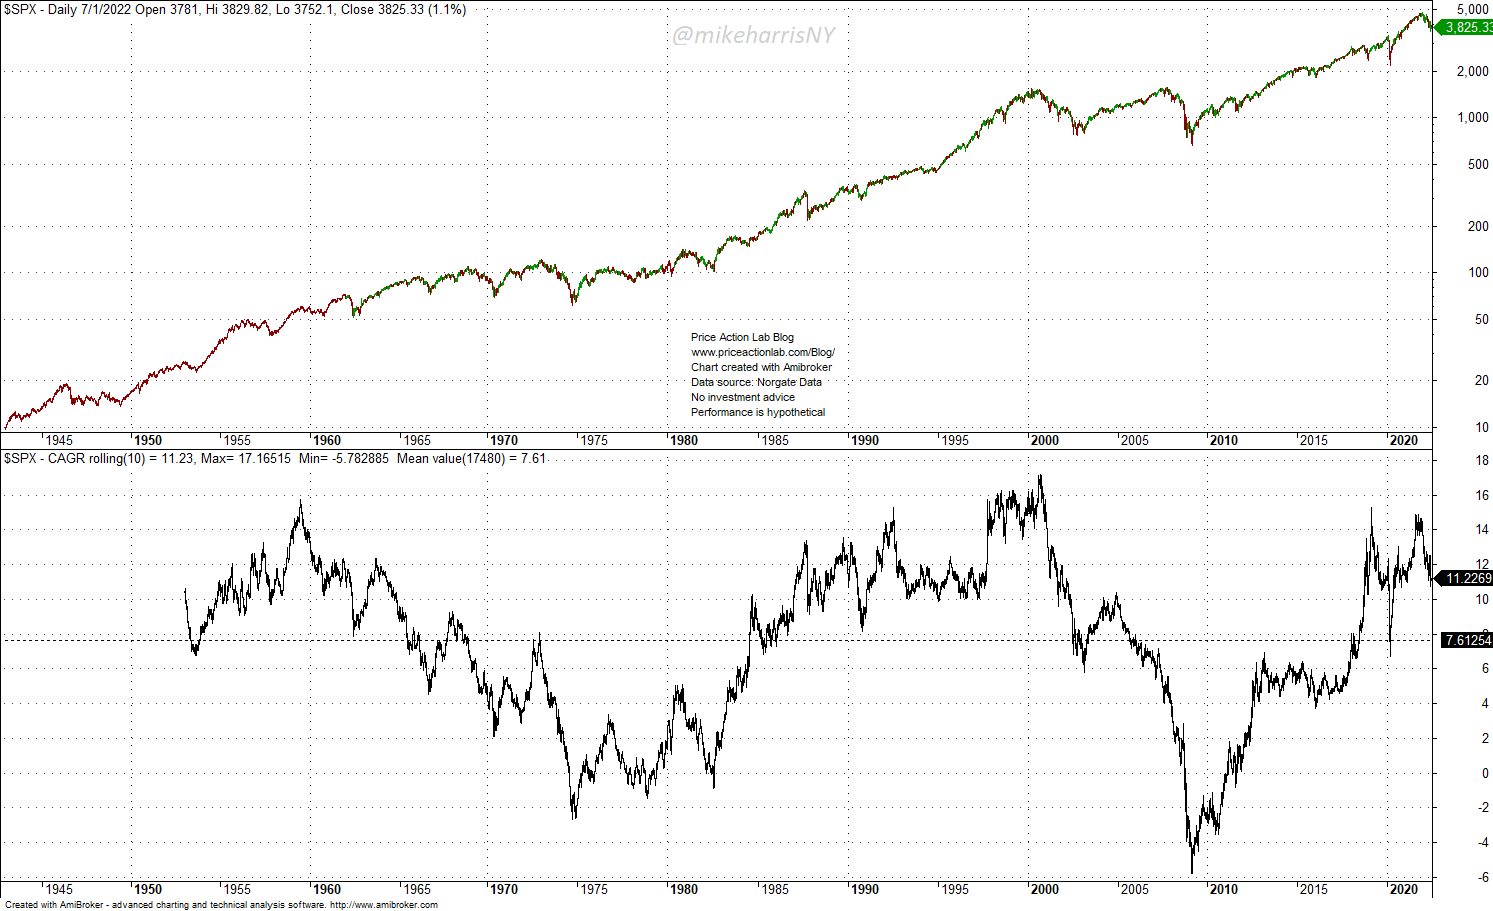
By mid-1959, the rolling 10-Year CAGR (R10CAGR) had reached as high as 16%. By November 1974, R10CAGR was at -2%. This means an investor from 10 years before had lost about 19% of the capital if there was no dividend reinvestment. With dividend reinvestment, the annualized return was around 1%. Adjusted for inflation, the annualized return after dividend reinvestment was about -4%!
By September 2000 and due to the tech bubble, R10CAGR was about 17% (and about 18.5% after dividend reinvestment.) Many thought this was an equity market comeback and pensions were linked to equities and various strategic allocations around them. But a devastating bear market followed.
By February 2009, R10CAGR was at -6%, the lowest it has ever been. With dividend reinvestment, the annualized 10-year return was about -4.5%. This meant an equities portfolio in large caps had lost about 47% of its value in the previous 10 years. It was then that the central banks decided to act to prevent pension destruction and other financial catastrophes. It was an indirect nationalization of the stock market that did not involve purchases of equities.
As it may be seen from the above chart, in the last 10 years investors have realized a respectable return but despite massive quantitative easing, the returns of the mid-50 and late 90s were never matched.
What will happen in an environment of rising rates and quantitative tightening, instead of falling rates and quantitative easing? Without support from the central bank, it is highly unlikely equities will escape a bear market. The pressure from the pension fund and passive index industry will be enormous. The central bank will eventually be forced to buy equities directly and essentially nationalize the stock market.
Under the nationalization scenario, investors should not expect high returns. The central bank will probably guarantee returns above inflation but nothing like the returns in the 50s or 90s. The equity markets will turn into another fixed-income market. Speculators will move to other markets, as they have done already with cryptocurrencies, NFTs and Defi. There may be increased interest in commodities and forex trading after many years of stagnation. Speculators will remain speculators. The losers will be the passive and index investors under the scenario of equity market direct nationalization.
Be the first to comment