

FG Trade/E+ via Getty Images
Healthcare REITs have outperformed the REIT average thus far this year, returning an average of (-15.09)%, compared to (-19.34%) for the Equity REIT index, according to Hoya Capital Income Builder.
Hoya Capital Income Builder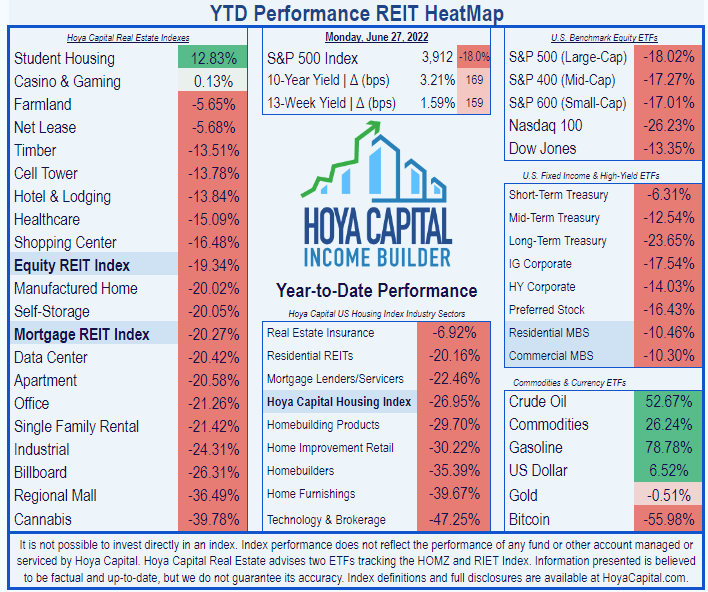
National Health Investors, Inc. (NYSE:NHI) has outperformed the Healthcare REIT average, gaining 6.33% YTD as of this writing, and sporting a dividend Yield of 5.8%. It has been one of the stellar REITs of 2022.
Seeking Alpha Premium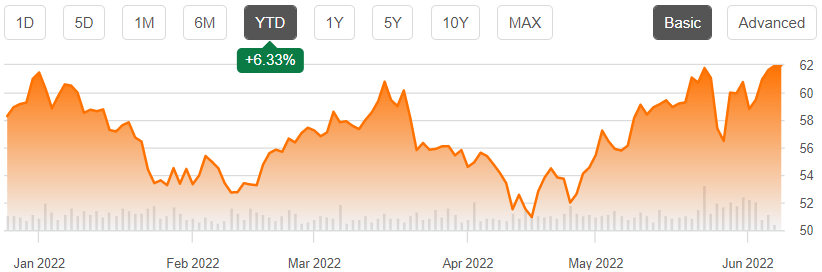
Meet the company
Founded in 1991 and headquartered in Murfreesboro, Tennessee, National Health Investors’ portfolio consists of 201 properties across 32 states, managed through 30 Operating Partners. Of these properties, 132 are senior housing facilities (blue dots), 68 are skilled nursing facilities (orange dots), and one is a hospital (brown dot in Oklahoma). In the senior housing sector, they emphasize private pay facilities not dependent on government reimbursements.
NHI website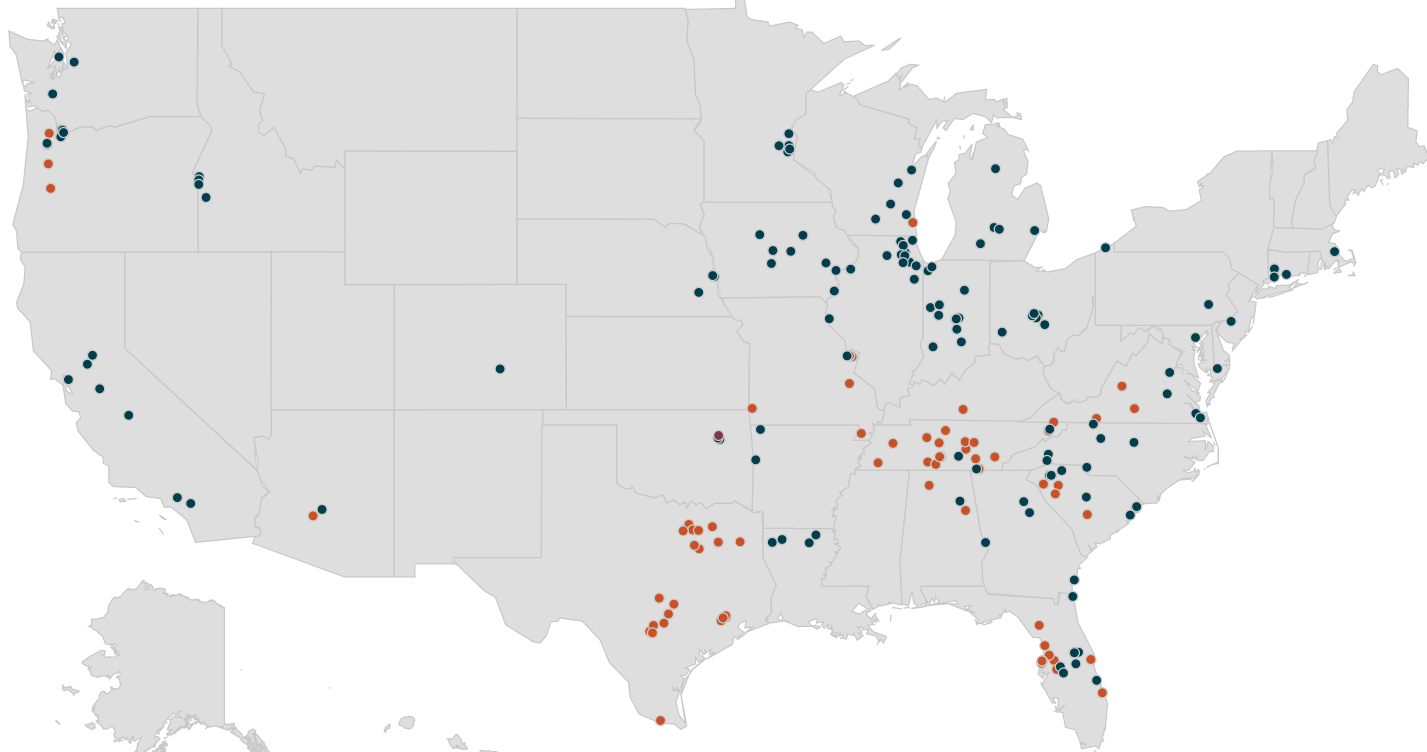
Of the 30 tenants, about 26% of NHI’s revenues derive from two publicly traded companies (National Healthcare Corporation and Ensign Group), while 63% comes from regional operators. NHI derives 23% of its income from properties operated by Senior Living Communities, by far the largest of their tenants.
NHI Q1 2022 Supplemental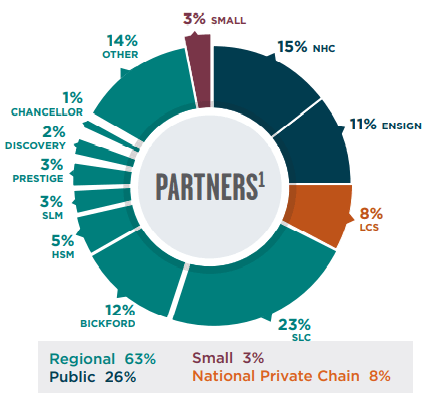
About 60% of the company’s revenues come from senior housing, and 35% from skilled nursing facilities. Hospitals and medical office buildings account for only 1% of revenue. Weighted average EBITDARM lease coverage for the portfolio is 1.54x, with the skilled nursing multiple 2.71x and the senior housing multiple just 0.98x.
NHI Q1 2022 Supplemental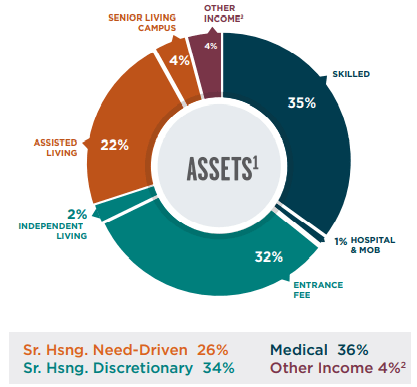
Their senior housing portfolio has experienced quite a bit of disruption from the COVID pandemic. Rent collection was only 79.7% in Q1 2022. As a result, for the past year the company has been working on disposing of underperforming senior housing, with a target of $250 to $400 million in sales. This is all but complete now, according to President and CEO Eric Mendelsohn, speaking on the Q1 2022 earnings call.
The company has also been restructuring leases with valued operating partners they are confident will recover from the COVID gut-punch, and project that rent collection will rise into the mid-90’s in Q2 2022.
Minimum base rents collectible as of March 31 are a nice steady $260 million or so per annum, as shown below:
NHI 10-Q for Q1 2022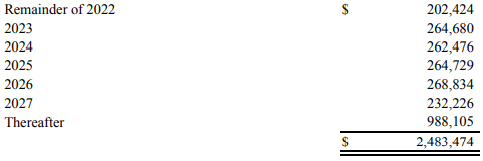
Quarterly earnings highlights
Here are the main takeaways from Q1 earnings reported May 10, on the earnings call and in the company’s 10-Q:
- Net income per diluted common share of $0.18, up $.04 from Q4 2021, but down 77% YoY (year over year)
- FFO (funds from operations) essentially flat from Q4 2021
- $71.3 million in revenue, down 11.8% from Q4 2021
- Expenses of $66.2 million, up about 50%, thanks mostly to $24 million in “loan and realty losses”
- Net income of $8.2 million, down 76% from Q4 2021
- Cash from operations $38.7 million, down 32% from Q4 2021
- Cash and cash equivalents on hand of $39.9 million, down from $116 million at the close of 2021.
Growth metrics
Here are the 3-year growth figures for FFO (funds from operations), TCFO (total cash from operations), and market cap.
| Metric | 2018 | 2019 | 2020 | 2021 | 3-year CAGR |
| FFO (millions) | $225.7 | $239.7 | $246.2 | $211.1 | — |
| FFO Growth % | — | 6.2 | 2.7 | (-14.3) | (-2.20) |
| FFO per share | $5.48 | $5.50 | $5.60 | $4.60 | — |
| FFO per share growth % | — | 0.4 | 1.8 |
(-17.9) |
(-5.67) |
| TCFO (millions) | $207.9 | $241.0 | $232.1 | $210.9 | — |
| TCFO Growth % | — | 15.4 | (-3.7) | (-9.2) | 0.48 |
| Market Cap (billions) | $3.22 | $3.63 | $3.09 | $2.63 | — |
| Market Cap Growth % | — | 12.7 | (-14.9) | (-14.9) | (-6.52) |
Source: TD Ameritrade, CompaniesMarketCap.com, and author calculations
Even before COVID reared its ugly head, NHI was growing only slowly. In 2019, which was a good year for REITs in general, NHI grew FFO at only 6.2%, and FFO per share was essentially flat. In 2021, which was a great year for REITs, NHI’s revenues and cash flow fell off double digits across the board. This company is a dividend proposition, but not a growth prospect.
Meanwhile, here is how the stock price has done over the past 3 twelve-month periods, compared to the REIT average as represented by the Vanguard Real Estate ETF (VNQ).
| Metric | 2019 | 2020 | 2021 | 2022 | 3-yr CAGR |
| NHI share price June 24 | $79.56 | $57.45 | $68.83 | $61.65 | — |
| NHI share price Gain % | — | (-27.8) | 19.8 | (-10.4) | (-8.15) |
| VNQ share price June 24 | $89.92 | $77.41 | $102.22 | $93.12 | — |
| VNQ share price Gain % | — | (-13.9) | 32.1 | (-8.9) | 1.17 |
Source: MarketWatch.com and author calculations
Like most REITs, NHI’s share price suffered in 2020 and bounced back in 2021, but NHI’s 19.8% bounce-back was timid compared to the 32% comeback in the VNQ. The company’s own figures show that it has underperformed both the REIT average and the S&P 500 TR Index over the last 3, 5, 7, and 10 years in total return. The company’s 3-year CAGR in share price loss of (-8.15)% swallows up the dividend, as high-yielding securities often do.
NHI Q1 2022 Supplemental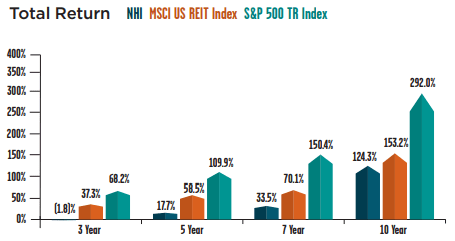
Balance sheet metrics
Despite the blow from the pandemic, NHI has maintained a relatively healthy balance sheet. The liquidity ratio of 2.12 is above both the REIT and the Healthcare sector averages, the debt ratio and debt/EBITDA ratio are both solid though unspectacular, and the balance sheet is bond rated.
| Company | Liquidity Ratio | Debt Ratio | Debt/EBITDA | Bond Rating |
| NHI | 2.12 | 32% | 6.7 | BBB- |
Source: Hoya Capital Income Builder, TD Ameritrade, and author calculations
Almost a third of the company’s debt is in unsecured loans at variable interest rates.
NHI Q1 2022 Supplemental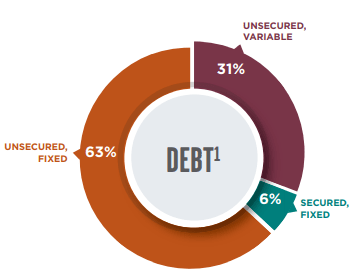
NHI is blessedly free of debt maturities for the remainder of this year, but faces a formidable $475 million next year. Once through that, they have two years of relatively easy payments, then $700 million comes due in 2026, most of it repayments to their line of credit.
NHI Q1 2022 Supplemental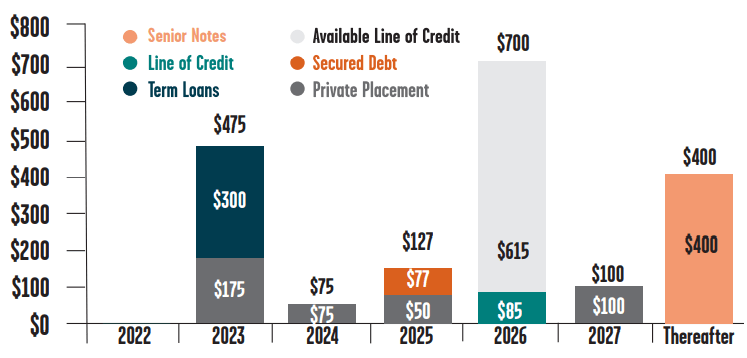
On March 31, NHI held $39.9 million in cash and equivalents, against debts of $1.25 billion. They have $416 million available through their ATM facility, but do not expect to use any of it in H1 2022. Instead, NHI is planning to repurchase $240 million worth of shares.
Dividend metrics
NHI is a strong payer. Like most Healthcare REITs, the company was obliged to cut its dividend during the pandemic, and it has not recovered, but still yields a pretty juicy 5.8%. Even taking that cut into account, this company handily outpays both the average Healthcare REIT and the average REIT overall. Although the payout ratio looks high at 80%, Seeking Alpha Premium rates the dividend a perfectly safe C.
| Company | Div. Yield | Div. Growth | Div. Score | Payout Ratio | Div. Safety |
| NHI | 5.84% | (-5.0)% | 5.01 | 80% | C |
Source: Hoya Capital Income Builder, TD Ameritrade, Seeking Alpha Premium
Dividend Score projects the Yield three years from now, on shares bought today, assuming the Dividend Growth rate remains unchanged.
Valuation metrics
From a value investor’s perspective, NHI seems attractively priced at 13.4x FFO, but it is also trading at a 12% premium to NAV, according to Hoya Capital Income Builder.
| Company | Div. Score | Price/FFO | Premium to NAV |
| NHI | 5.01 | 13.4 | 12.0% |
Source: Hoya Capital Income Builder, TD Ameritrade, and author calculations
What could go wrong?
Of course there is the possibility of a new pandemic, or a surge in cases from existing or future variants. Some of the company’s tenants are under stress as a result of COVID, and NHI has had to restructure leases, and that may be an ongoing challenge.
But NHI’s biggest challenge is the shortage of skilled nurses. Skilled nursing facilities are the best-performing class of assets the company owns. Bedside RN turnover rose to an all-time high of 18.6% in 2020, and in a survey in May 2021, another 22% of nurses reported they are strongly considering exiting.
After what they went through during the pandemic, it’s no wonder.. As McKinsey’s Gretchen Berlin writes on mckinsey.com:
. . . increasing demands placed on healthcare workers created both a physical strain on those working on the frontlines, and a psychological strain for those losing patients, or in some tragic cases, coworkers and loved ones.
The ANA (American Nurses Association) predicts another 500,000 nurses will leave the profession in 2022, leaving a shortage of 1.1 million. That leaves the remaining nurses in a strong position to negotiate salary and benefits, raising NHI’s cost of operation and restricting their ability to serve more patients. According to the ANA:
During the pandemic, demand for RNs surged. This combined with other existing factors to considerably worsen the nursing shortage and expose the workplace challenges nurses face. Nurses are under immense stress and feel the full weight of an overburdened, poorly functioning health care system.
Skilled nurses don’t grow on trees. It will take years for the supply of new nurses to meet the demand. The aging of the U.S. population, a tailwind for most Medical REITs, works against NHI to some extent, because it intensifies the demand for skilled nurses. According to the ANA, more registered nurse jobs will be available through 2022 than any other profession in the United States.
NHI also competes with alternative ways of caring for seniors, such as Medicare PACE and adult foster care.
Investor’s bottom line
If all you want is a fat yield, NHI is not a bad choice, and it is available pretty cheap. The company seems to have weathered the worst of the pandemic, and management is doing a responsible job of selling assets to keep the balance sheet solid.
However, the dividend is all you are likely to get with this company. It is not likely to grow rapidly, nor outperform the market in share price. I consider this company a Hold, as do the other Seeking Alpha Authors, the Wall Street analysts that cover the company, and the Quant ratings.
Seeking Alpha Premium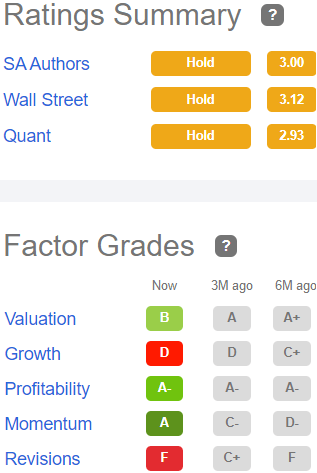
Despite the negative revisions in earnings estimates, revision-sensitive Zacks rates NHI a Hold, as do The Street and Ford Equity Research. TipRanks rates it a strong Outperform.
The average price target for NHI is just $59.40, slightly below its current level, and even the most optimistic price target is only 64%, just 3% above where it is today.
TD Ameritrade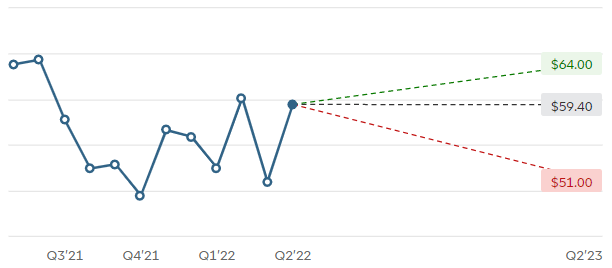
Be the first to comment