

Andrii Dodonov
Consider Going National
State-specific municipal bond funds appear attractive to investors because their dividends are exempt from state income tax for residents of the state where the bonds are issued. In the case of the Nuveen Quality Municipal closed-end funds (“CEFs”), however, most state-specific funds have either underperformed or only slightly beat the national fund over the long term.
Nuveen has several different closed-end funds that invest in municipal fixed income. Some states even have more than one state-specific fund. For this article, I am focusing on the funds with “Quality” in the title to simplify the analysis. These funds tend to have the highest credit quality and be the most diversified of the fund family. To narrow it down a bit further, I will focus on the national fund and 5 state specific funds:
- Nuveen Quality Municipal Income Fund (NYSE:NAD)
- Nuveen California Quality Municipal Income Fund (NAC)
- Nuveen New Jersey Quality Municipal Income Fund (NXJ)
- Nuveen New York Quality Municipal Income Fund (NAN)
- Nuveen Ohio Quality Municipal Income Fund (NUO)
- Nuveen Pennsylvania Quality Municipal Income Fund (NQP)
If we look at total returns over the last 10 years, we see that NAD beat 4 out of the 5 state-specific funds, with only the New Jersey fund coming out slightly ahead.
Seeking Alpha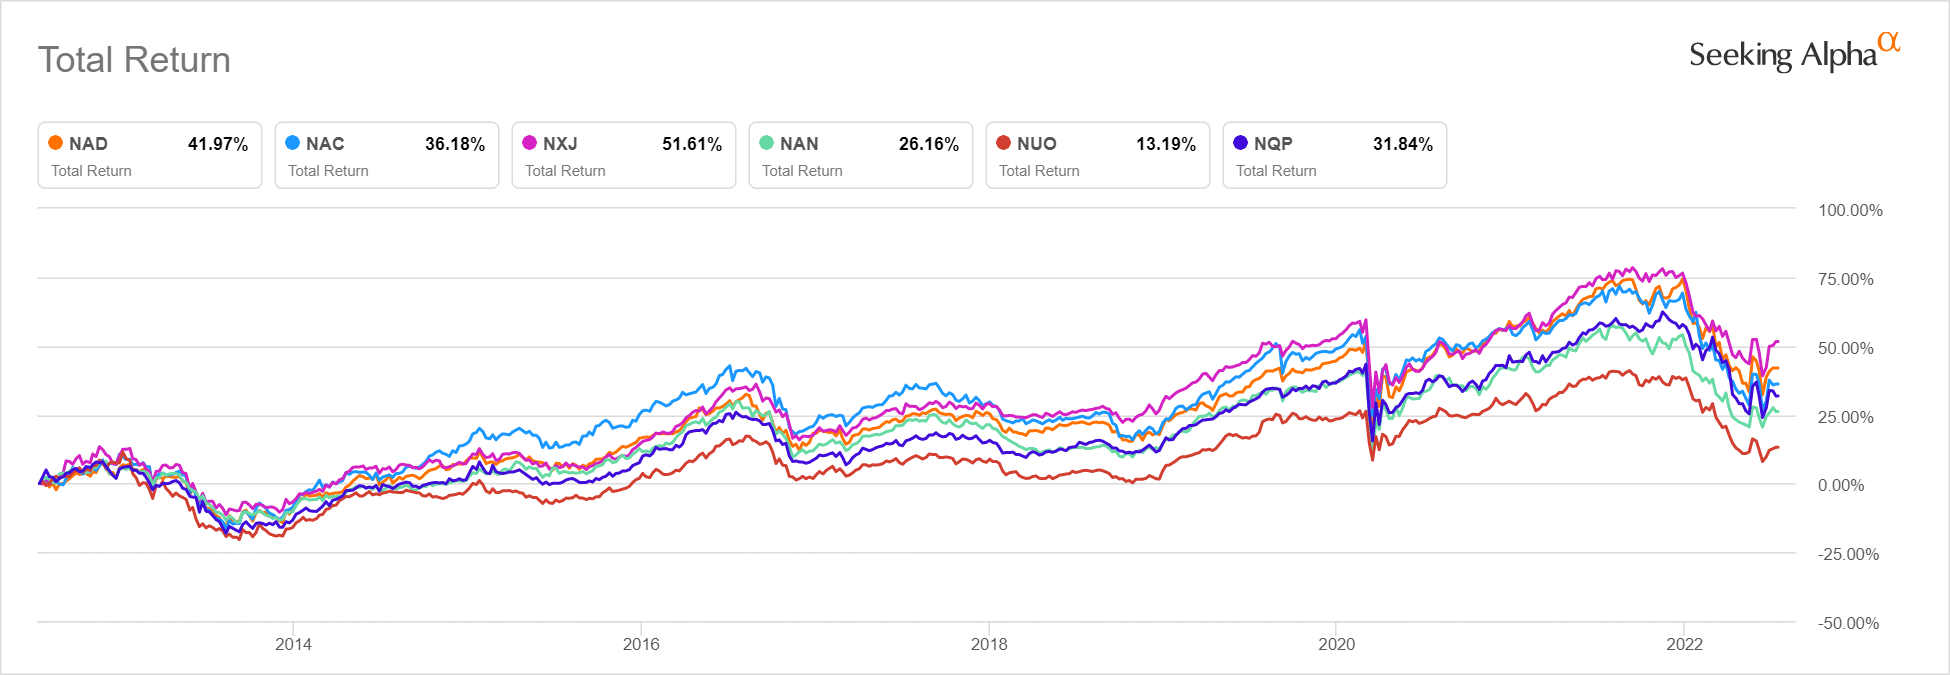
I selected these 5 states to have a few high-tax jurisdictions for further analysis. Just to show I am not cherry-picking, here is a quick chart of the state-specific funds for Arizona, Georgia, Minnesota, Massachusetts, and Virginia. Note that only Massachusetts comes out ahead of the national fund, and that is just a recent development in the last few months.
Seeking Alpha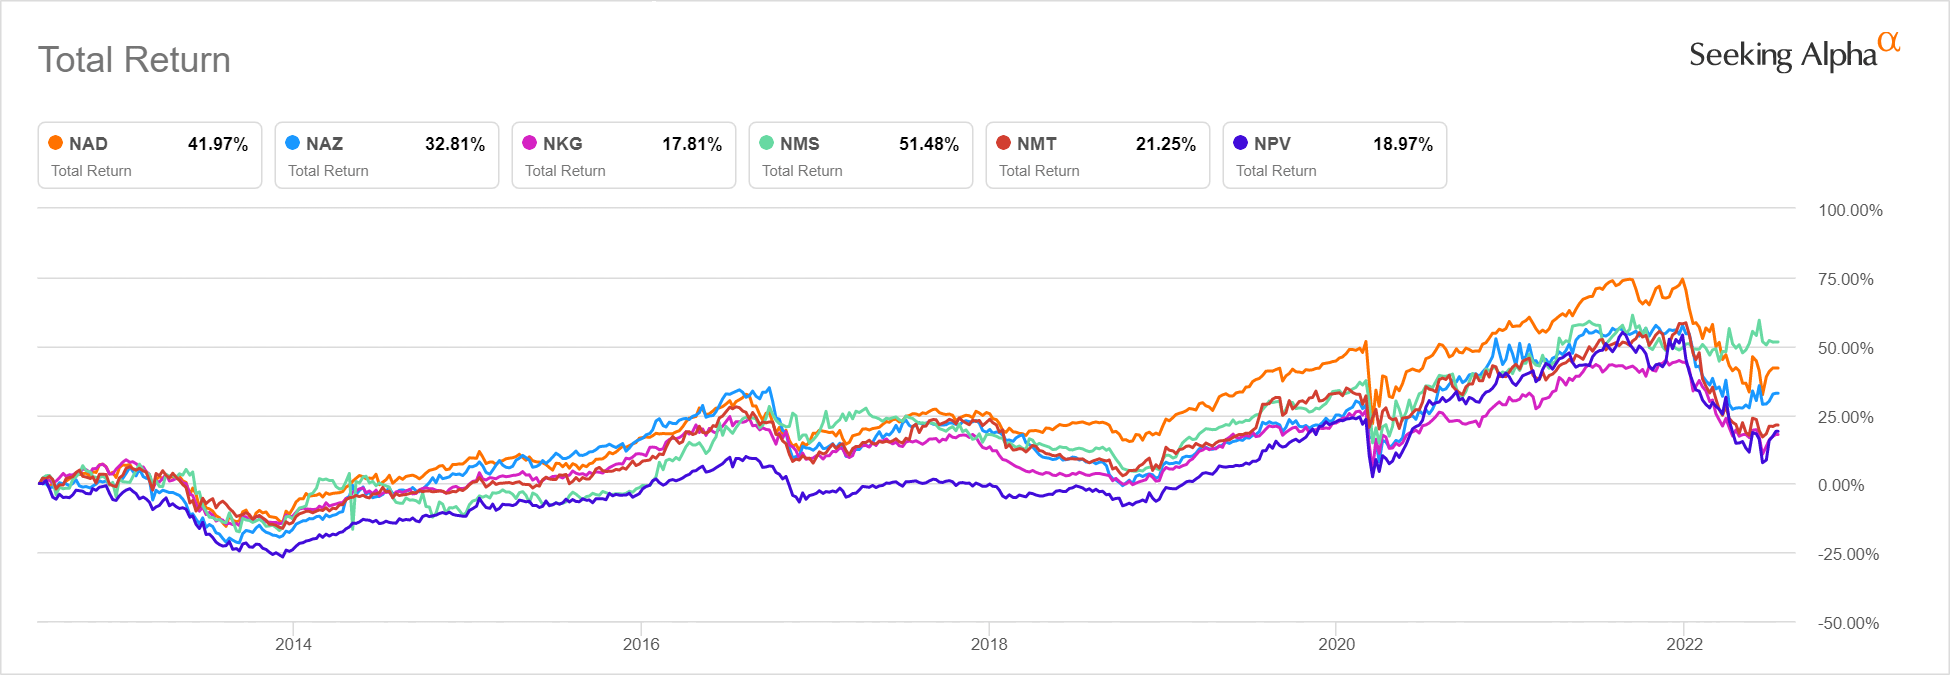
NAD is also competitive on a 5-year basis. I won’t copy the charts here, but you can generate them yourself using Seeking Alpha’s charting page.
One selling point of state-specific funds is that the dividends are not only free from federal income tax, but also from state tax for residents of the state where the bonds are issued. However, for middle income investors, the state tax break is rarely enough to compensate for the lower total returns compared to the national fund. Middle income investors are defined here as a married couple filing jointly earning $100,000 of taxable income.
The tables below show 10 and 5-year returns for these funds and the relative performance of the state-specific funds to the national fund, NAD. This relative performance is then adjusted by reducing NAD returns by the amount of state income tax due on the NAD dividends in each state. The tax effect swings NAC on a 10-year basis and NQP on a 5-year basis from a slight underperformer to a slight overperformer.
Author Spreadsheet (Data Source: Nuveen)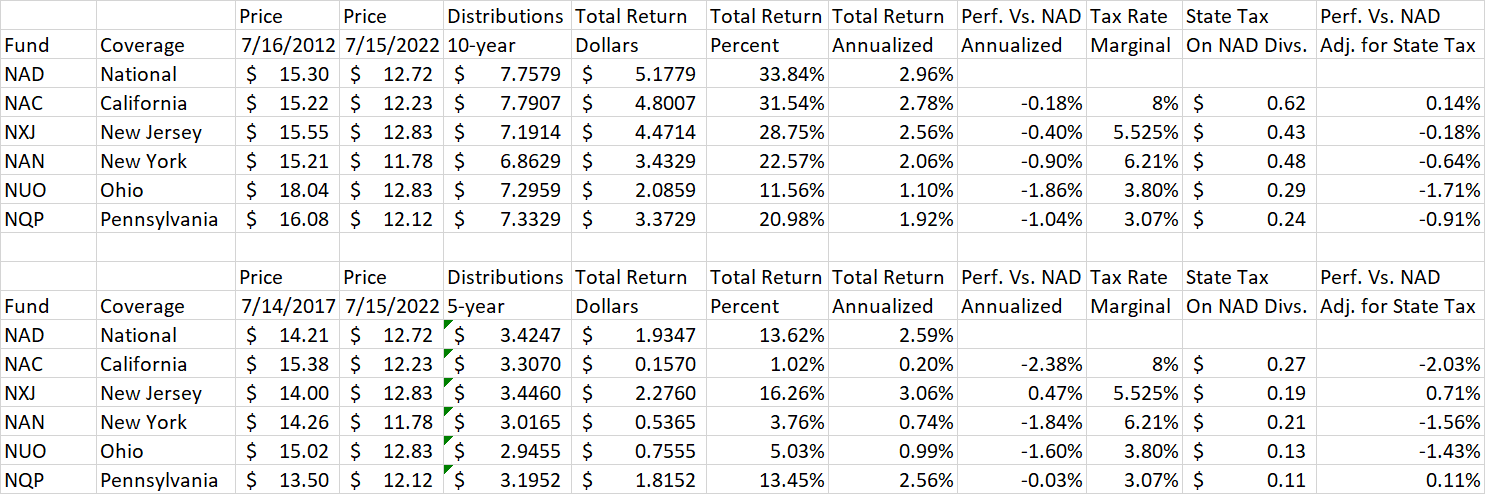
All data in the table come from Nuveen.com. The table assumes dividends are withdrawn rather than reinvested, which is why the total returns shown are lower in the tables than in the charts above.
States like California and New York have much higher tax rates for higher income brackets than the ones used here. High-bracket investors occasionally might be more inclined to favor the state-specific funds, but note that for the 5-year period, California and New York were the two worst underperformers before taxes.
Don’t Chase Discounts
Tax savings does not appear to be a strong enough incentive to favor state-specific funds, given NAD’s outperformance. Some CEF investors are also attracted by discounts to NAV. Currently, most of the state-specific funds trade at wider discounts to net asset value than the national fund. California is the only current exception, and it is close. Discounts don’t typically close on their own, and some may even get wider. An extreme example is the Ohio fund, which traded at an unusually high premium to NAV in 2012 but quickly fell back to a typical discount and now trades at the deepest discount of the bunch.
Author Spreadsheet (Data Source: Nuveen.com)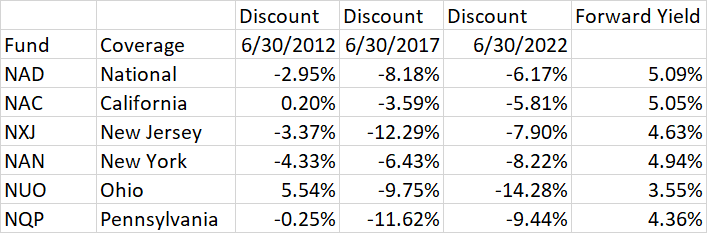
Note that forward yield is well-correlated with the level of discount. (Forward yield is the last monthly dividend times 12, divided by the latest market price.) The strong correlation is confirmed by the chart below:
Author Spreadsheet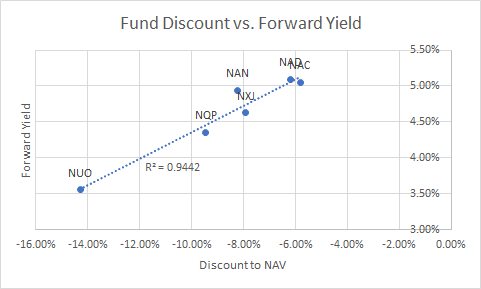
Are The Risks Similar?
NAD is significantly larger and more liquid than the state-specific funds. It has similar leverage, expense ratio, and duration as the large state-specific funds.
Author Spreadsheet (Data Source: Nuveen.com)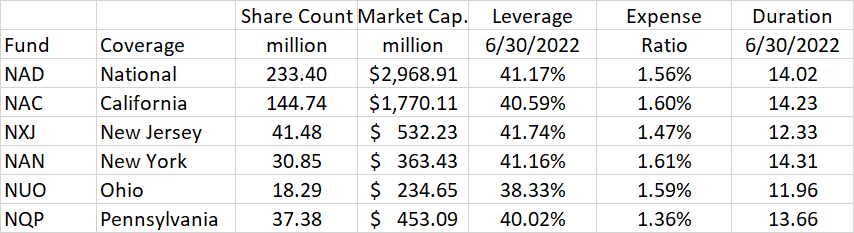
In a market downturn, one might expect a less risky fund to have more of a premium, but we see with the Ohio fund that is not the case. NUO has lower leverage and duration than NAD, as well as higher credit quality:
NUO Credit Quality (Nuveen.com) NAD Credit Quality (Nuveen.com)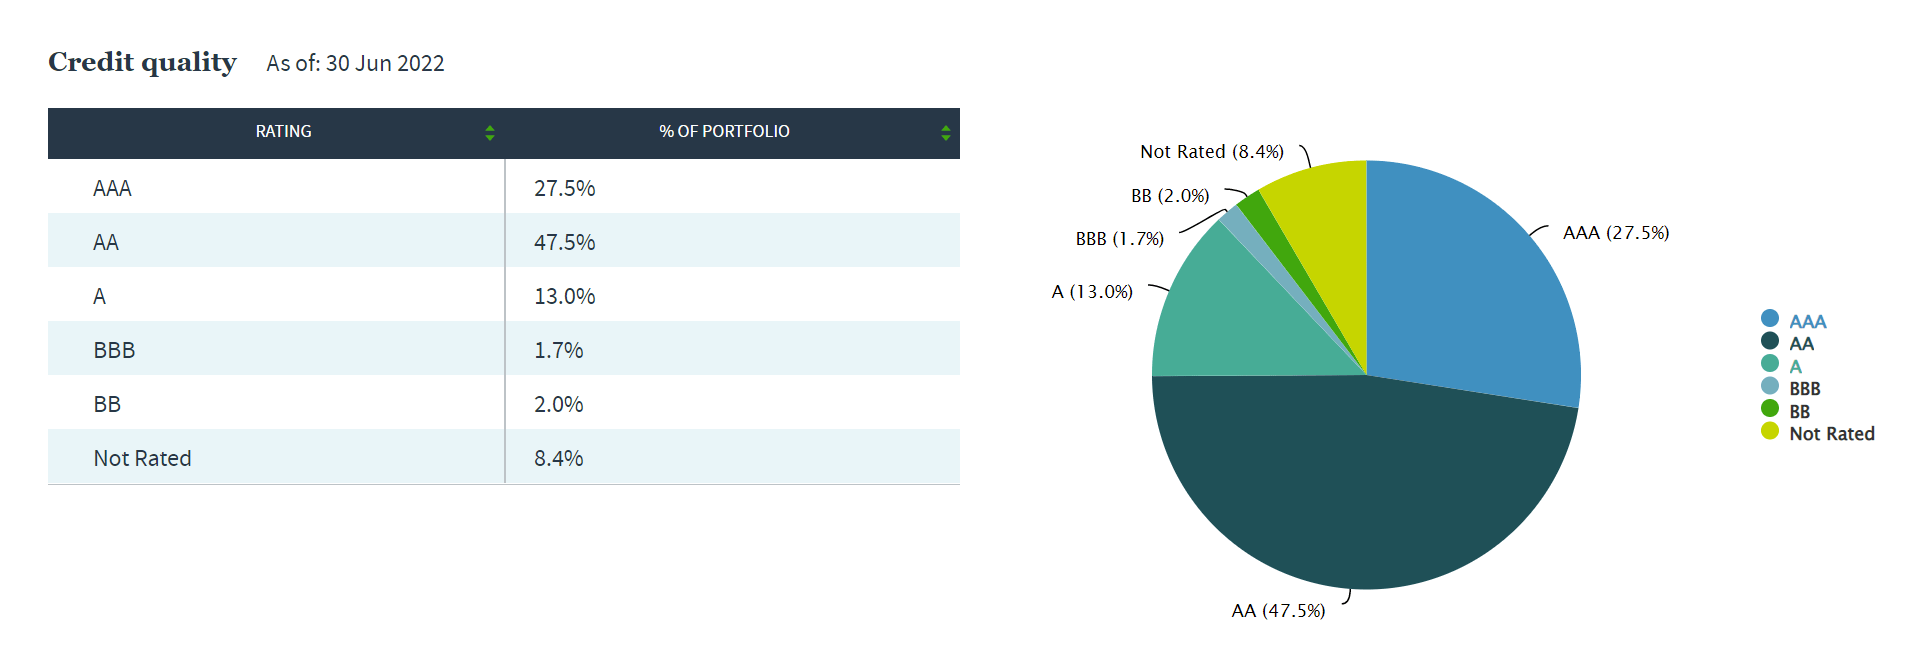
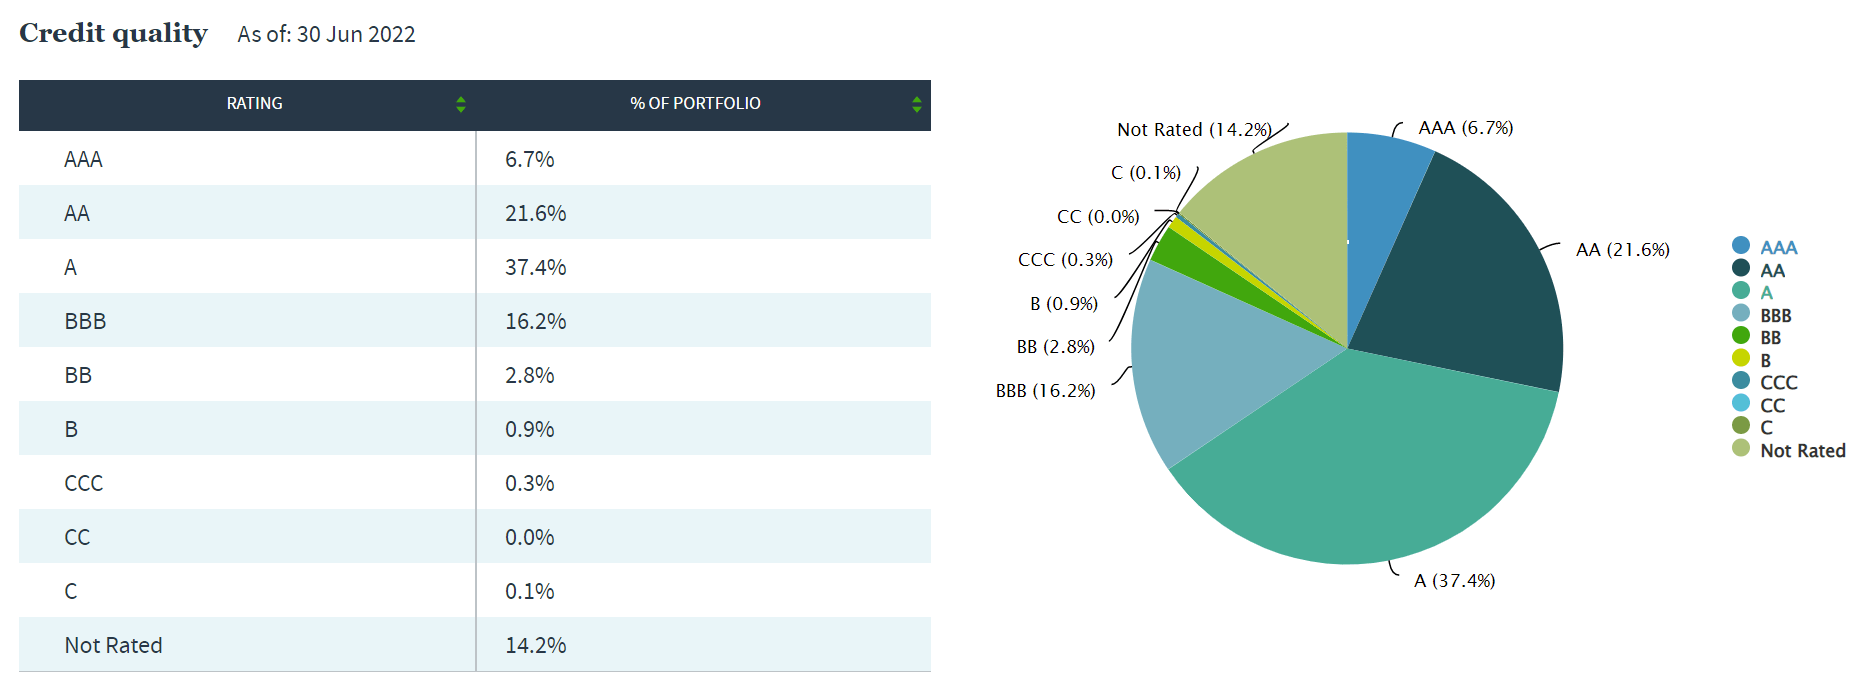
Despite these lower risk metrics, NUO trades at the steepest discount of the group. Investors appear to be focused only on the Ohio fund’s lower yield. The small size of the Ohio fund and lack of lower-rated bonds available in the state make it more difficult to find bonds with higher yields. This is the case even though a few years ago the fund began including around 10% out-of-state bonds in its holdings.
NAD as well as many of the state-specific funds just cut their dividend with the July 1 payment. Unlike some fund managers such as PIMCO, Nuveen adjusts their payouts more frequently to keep UNII within a few pennies of zero and distribution coverage right around 100%. In a rising short-term rate environment, the cost of leverage will increase similarly for national and state-specific funds. Since leverage levels are similar, this is an equal risk for both types of funds and does not favor one over the other. Payouts also have the potential to increase when rates start coming down.
Harvest Your Losses
These closed-end funds are down about 20% YTD on a market price basis, similar to the S&P 500 (SPY). Given the similar to slightly better performance of NAD over the long term, now is a good opportunity to sell state-specific Nuveen funds at a loss and swap into NAD. As long as you have realized capital gains from somewhere else (or up to $3,000 of ordinary income), the capital loss from the state-specific funds will reduce your taxable income one-for-one this year. Losses in excess of this can be carried forward to offset income in future years. In most states, buying NAD will give you a higher monthly income, even after subtracting the small amount of added state tax incurred.
Since discounts seem to be persistent, I don’t expect the state-specific funds to bounce back more than the national fund during a market recovery. However, if I am wrong, you can always swap back into your state-specific fund after 30 days to avoid the wash sale rule.
The above commentary is appropriate for a general U.S.-based audience. Please consider your specific tax situation and consult an advisor if necessary.
Be the first to comment