

Lemon_tm/iStock via Getty Images
Quality Stocks
Volatility continued to be high during March but my high growth watchlist finally got its first positive month of the year. The March watchlist reported a gain of 2.22% trailing VIG that gained 3.02% and SPY that picked up 3.76%. My target annualized rate of return is 12% and after 19 months this watchlist continues to deliver above average results with an annualized rate of return of 19.08%.
The main focus of this watchlist is to find the best combination of quality companies trading for attractive prices. I believe this is the optimal long term strategy to building wealth.
The top 15 dividend growth stocks for April offer an average dividend yield of 1.39%. Collectively they have increased dividend payments at a rate of 29.56% during the last 5 years. Based on dividend yield theory these 15 stocks are about 20% undervalued right now, and I think they are poised to offer strong long term returns. Following the recent pullback in the market, this month we have 14 potentially undervalued stocks and 1 that is fairly valued.
I would recommend two approaches to dividend investing. The first is to dollar cost average into at least 10-20 or more quality dividend-paying stocks across multiple sectors and industries. By dollar cost averaging, you eliminate the risk of trying to value a stock and over a long enough period, theoretically, you will buy shares at market highs, lows, and in-between resulting in an average cost basis somewhere in the middle. The second method carries a little more risk. Invest in undervalued stocks also dollar cost averaging into at least 10-20 unique quality companies across multiple sectors and industries. The additional risk with this approach comes from the chance that your valuation method proves to be incorrect. However, by investing in multiple unique stocks, the odds that you accurately identify at least a few undervalued stocks increases. The resulting upside from a few correct picks may more than offset the underperformance from the bad ones.
Watchlist Criteria
The criteria used to determine which stocks are included in my high-growth dividend stock watchlist remains unchanged for April 2022. It is made up of the 8 factors listed below that have historically outperformed the broad universe of dividend-paying stocks when analyzed collectively.
- Market Cap of at least $10 billion
- Payout Ratio no greater than 70%
- 5-year Dividend Growth rate of at least 5%
- 5-year Revenue Growth rate of at least 2%
- 5-year EPS Growth rate of at least 2%
- S&P Earnings and Dividend Rating of B+ or better
- Wide or Narrow Moat (Morningstar)
- Exemplary or Standard Management Team (Morningstar)
The rules identified 148 stocks for the month of April that were all ranked based on the above mentioned metrics with the exclusion of market cap. I then computed the current valuation for each stock using dividend yield theory. All stocks were ranked for both quality and valuation and sorted by the best combination of both. Next I computed a forecasted rate of return for the next 5 year period for each of the stocks. This return is based on forecasted earnings growth, a return to fair value and the dividend yield. The highest ranked 15 stocks with a forecasted return greater than or equal to 12% were chosen for the April watchlist. The long-term hypothesis for this watchlist is that it will outperform a broad quality dividend fund such as Vanguard’s Dividend Appreciation ETF, VIG.
Watchlist For April 2022
Created by Author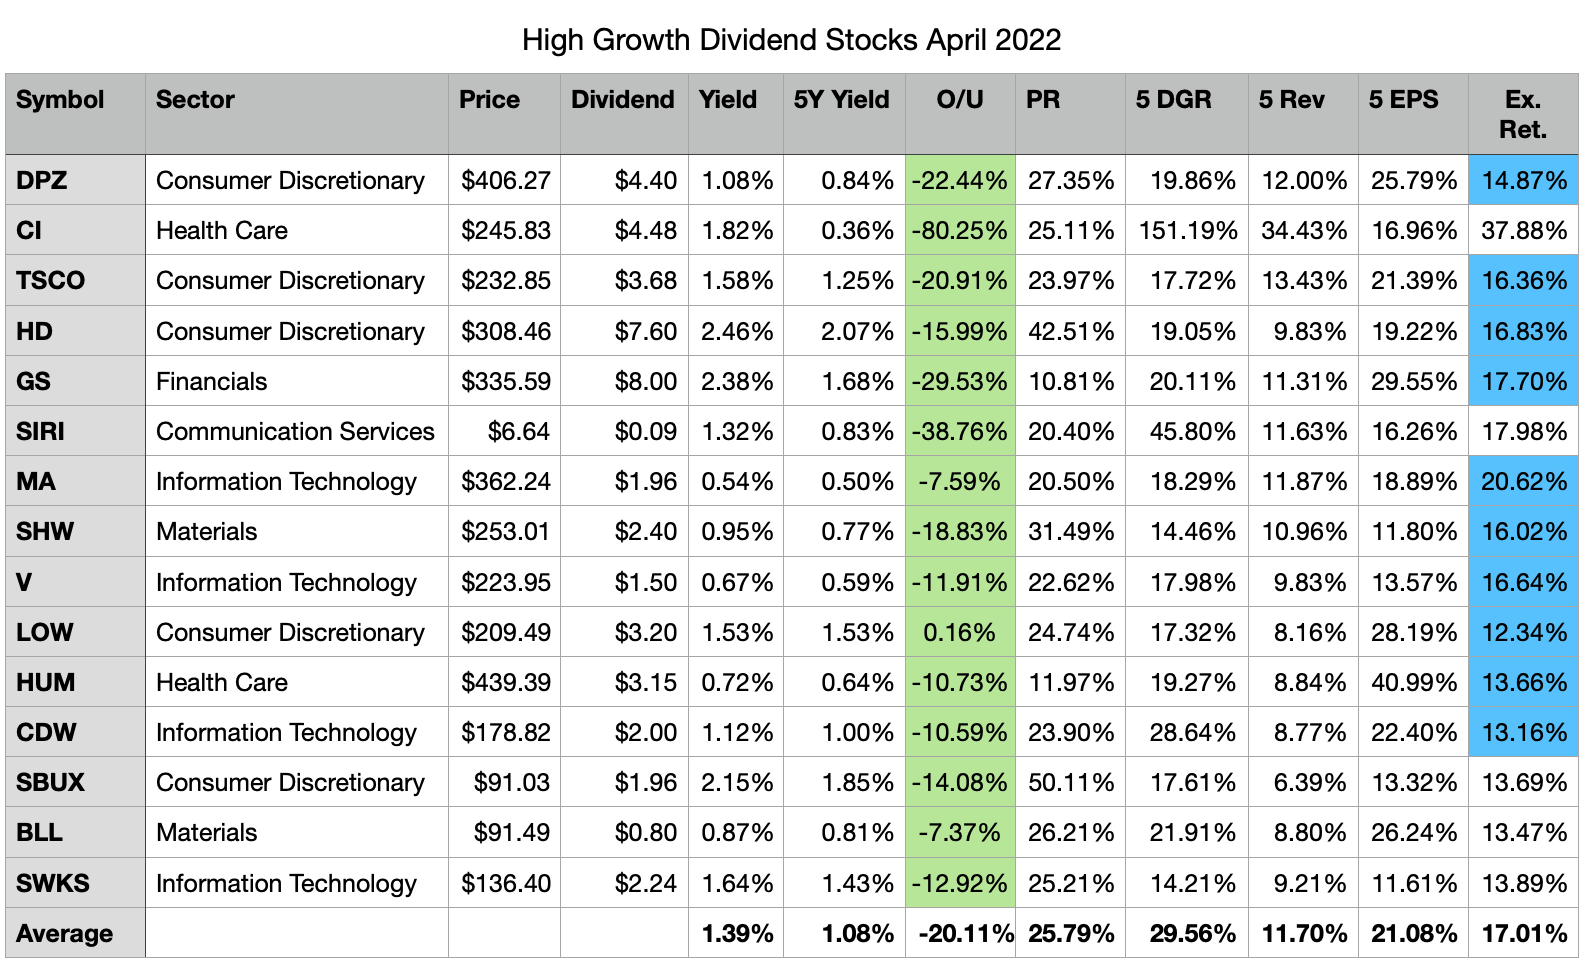
The “O/U” column represents potential undervalue; this is a comparison of the current dividend yield to the historical dividend yield. Collectively these 15 stocks offer a dividend yield of 1.39%, the potentially undervalued stocks offer a slightly worse average dividend yield of 1.38%.
The expected return in the table above was computed using a 5 year EPS forecast, a return to fair value and the current dividend yield. There is also a margin of safety built into the forecasted return. These figures are just assumptions based on the available data and there is no guarantee these returns will be attained.
The 80% potential undervaluation for Cigna (CI) is obviously inaccurate and a result of accelerated dividend growth during the past two years. Cigna for the longest time paid one annual dividend of 4 cents. In 2021 the dividend policy was adjusted to distribute a quarterly dividend, additionally the dividend rate was increased to $1 per share, and further to $1.12 per share in 2022. This increase drove the dividend yield significantly higher, hence using dividend yield theory to value Cigna will be ineffective in the near future. Dividend yield theory works best for companies with stable and consistent dividend growth.
Past Performance
March was a good month for the watchlist although it failed to outperform VIG and SPY. The watchlist underperformed VIG and SPY and remains behind both benchmarks on a year-to-date basis. Since inception, the watchlist lead over VIG is trimmed to just 2.19% and it now trails SPY by 0.30%. The annualized rate of return for the watchlist during the last 19 months is 19.08%, well above my target 12%.
|
Month |
Watchlist |
All |
VIG |
SPY |
|
1 Month |
2.22% |
2.69% |
3.02% |
3.76% |
|
3 Month |
-7.09% |
-7.26% |
-5.17% |
-4.61% |
|
6 Month |
6.35% |
4.14% |
6.52% |
5.96% |
|
1 Year |
18.32% |
15.64% |
12.23% |
15.49% |
|
2020 |
6.27% |
6.15% |
9.09% |
7.94% |
|
2021 |
33.52% |
32.29% |
23.75% |
28.56% |
|
2022 |
-7.09% |
-7.26% |
-5.17% |
-4.61% |
|
Since Inception |
31.84% |
30.24% |
28.02% |
32.37% |
|
Annualized |
19.08% |
18.16% |
16.89% |
19.38% |
Top 5 past and present watchlist stocks in March 2022:
- (PARA) +24.35% (past)
- (DE) +15.69% (past)
- (FAST) +15.43% (past)
- (TSCO) +14.51% (present)
- (CTAS) +13.34% (past)
Top 5 Stocks by Total Return since joining the watchlist:
- Nvidia (NVDA) +104.57% (12 months)
- ADP (ADP) +69.56% (19 months)
- Tractor Supply (TSCO) +67.13% (14 months)
- Charles Schwab (SCHW) +65.66% (14 months)
- Costco (COST) +56.23% (19 months)
NVDA remains the number one stock and the only watchlist stock with a total return above 100%. ADP slides up from 4th to 2nd place after a strong 11.85% return in March. TSCO pops onto the top 5 list, moving into 3rd place after a very strong 14.51% gain in March. SCHW shed 0.18% in March and drops from 2nd to 4th place. COST added 10.90% in March and moves into 5th place. BK and USB performed poorly in March and fall out of the top 5 list.
Since not all stocks have been on the watchlist for the full 19 months of its existence, comparing a monthly average return can help normalize the results. Here are the top 5 stocks with the highest average monthly return since joining the watchlist.
- Rollins (ROL) +6.76%
- Nvidia (NVDA) +6.15%
- Deere & Co. (DE) +4.86%
- FedEx (FDX) +4.47%
- Tractor Supply (TSCO) +3.74%
ROL holds onto 1st place after a strong showing in March of 7.42%. NVDA bridges some of the gap to 1st place after adding 11.92% in March. DE returns 15.69% in March and jumps into 3rd place after 4 months on the watchlist. FDX returns 4.47% in its first month on the watchlist and slides into 4th place. TSCO overtakes SCHW to remain on the top 5 list.
Drivers of Alpha
The watchlist did not beat VIG in March. Only 6 watchlist stocks outpaced the ETF last month.
The remaining 9 stocks underperformed VIG.
- (V) +2.61%
- (CI) +1.26%
- (HUM) +0.38%
- (BLL) +0.29%
- (SCHW) -0.18%
- (APH) -0.61%
- (MA) -0.95%
- (HD) -4.66%
- (SHW) -5.13%
Long Term Returns
In the past I tracked how a buy and hold approach would have worked out utilizing the ideas from this watchlist. Going forward I decided to drop this long term analysis in favor of tracking long term returns of each individual watchlist. I think this will be a more useful measure and will help me track whether each month’s watchlist can deliver 12% annualized rates of return over the long term.
|
Month |
Cumulative |
# of Months |
Annualized |
|
Sep 20 |
28.08% |
19 |
16.92% |
|
Oct 20 |
32.40% |
18 |
20.57% |
|
Nov 20 |
38.04% |
17 |
25.55% |
|
Dec 20 |
24.96% |
16 |
18.19% |
|
Jan 21 |
20.85% |
15 |
16.36% |
|
Feb 21 |
26.39% |
14 |
22.23% |
|
Mar 21 |
22.04% |
13 |
20.18% |
|
Apr 21 |
15.04% |
12 |
15.04% |
|
May 21 |
5.19% |
11 |
5.68% |
|
Jun 21 |
5.01% |
10 |
6.05% |
|
Jul 21 |
2.24% |
9 |
3.00% |
|
Aug 21 |
-0.95% |
8 |
-1.43% |
|
Sep 21 |
-2.84% |
7 |
-4.83% |
|
Oct 21 |
1.85% |
6 |
3.73% |
|
Nov 21 |
-3.60% |
5 |
-8.42% |
|
Dec 21 |
0.67% |
4 |
2.01% |
|
Jan 22 |
-7.67% |
3 |
-27.32% |
|
Feb 22 |
-3.20% |
2 |
-17.72% |
|
Mar 22 |
2.22% |
1 |
30.08% |
|
Average |
10.88% |
7.68% |
In the table above you can see the long term cumulative return for each of the past 19 watchlists, the number of months of return data and the resulting annualized rate of return. The column to pay attention to here is the annualized rate of return, this is a normalized calculation that can be used to compare and evaluate all past watchlists. Thus far only the first 8 watchlists have at least 12 months of return data so these annualized rates of return are much more meaningful. For the remaining watchlists, with less than 12 months of history, the annualized rates assume the watchlist can continue to grow at its current pace. As you can see all of the watchlist with at least 12 months of returns are beating my target rate of return. The market pullback is driving returns down for many past watchlists, my goal remains to have each watchlist exceed a 12% annualized rate of return over a long period of time. Short term volatility can drive these returns down but I believe after 5 years or so the vast majority of the watchlists will have returns above 12%
Short term volatility is long term opportunity for dividend investors, many quality companies are starting to look attractive once again.
Be the first to comment