

Market Recap
After what seemed like endless months of decline, SPDR S&P 500 Trust ETF (SPY) posted its highest monthly return since November of 2020, gaining 9.21% last month. My top 10 high yield dividend stocks selected for July performed even better, posting a return of 10.88%. Since inception, November of 2020, my top 10 high yield dividend stocks are beating SPY by 5.61% on an annualized basis. Vanguard High Dividend Yield ETF (VYM) performed well in July but gained only 4.6%, as a result the popular Vanguard ETF is now only 0.24% ahead of my strategy since inception. Year-to-date, through July, SPY is still down 12.61% whereas my top 10 list is down only 4.43%. However, it is still not performing better than VYM, which has a loss of 3.74% on the year.
The main purpose of a high dividend yield portfolio is not to outperform the broad market but to generate a passive income stream that is relatively safe, reliable, and one that can grow in the future. The top 10 stocks on my watchlist for August 2022, collectively, offer a 3.91% dividend yield that is more than double the dividend yield of the S&P 500. It is also significantly better than the dividend yield of VYM that hovers around 2.4%. These 10 stocks have also grown their dividends at a historical rate of 21.20% per year during the last five years. Collectively, all 10 stocks appear to be potentially about 35% undervalued right now based on dividend yield theory.
The best way to create a strong high yield dividend portfolio is with a buy-and-hold strategy. This strategy forces you to think about the stocks you decide to invest your capital into as the plan is to hold the positions indefinitely. Applying this approach over the long term while focusing on potentially undervalued stocks, allows investors to generate alpha through capital appreciation. While this may not pan out for every position, diversifying your high-yield portfolio across 20 or more unique stocks will increase the odds of picking up shares of certain stocks when they are trading for bargain prices. The beauty of a long-term outlook is time; you can sit back and wait for the valuation to revert to historical norms, all the while collecting a generous passive income stream.
Watchlist Criteria
Creating the high yield watchlist, I had four areas of interest that I focused on: basic criteria, safety, quality, and stability. First off, the basic criterion aims to narrow down the list of stocks to those that pay a dividend, offer a yield above 2.75%, and trade on the NYSE and NASDAQ. The next set of criteria focuses on safety because that is a crucial part of a high yield investing strategy. The filter excludes companies with payout ratios above 100% and companies with negative 5-year dividend growth rates. Another level of safety can be associated with larger companies; therefore, the watchlist narrows in on stocks with a market cap of at least $10 billion. The next set of criteria set out to narrow down the list to include higher quality businesses.
The three filters for quality are: a wide or narrow Morningstar moat, a standard or exemplary Morningstar stewardship, and an S&P quality rating of B+ or higher. A Morningstar moat rating represents the company’s sustainable competitive advantage, the main difference between a wide and narrow moat is the duration that Morningstar expects that advantage to last. Companies with a wide moat are expected to maintain their advantage for the next 20 years, whereas companies with a narrow moat are expected to maintain their advantage for the next 10 years. The Morningstar stewardship evaluates the management team of a company with respect to shareholders’ capital.
The S&P quality rating evaluates a company’s earnings and dividend history. A rating of B+ or higher is associated with above-average businesses. The last set of criteria focuses on the stability of a company’s top-line and bottom-line growth. The filter eliminates companies with negative 5-year revenue or earnings per share growth rate. I believe a company that is growing both their top-line and bottom-line has the ability to provide growth to its investors in the future.
All of the stocks that pass the initial screener criteria are then ranked based on quality and valuation. Further, I sort the stocks in descending order based on the best combination of quality and value and select the top 10 stocks that are forecasted to have at least a 12% annual long-term return.
August 2022 Watchlist
Here is the watchlist for August 2022. There are two changes from the prior month: Home Depot (HD) and Texas Instruments (TXN) drop off and are replaced by Restaurant Brands International (QSR) and Digital Realty Trust (DLR). Home Depot and Texas Instruments dropped off because neither stock offers a dividend yield of at least 2.75% right now. The data shown in the image below is as of 7/29/22.
Created by Author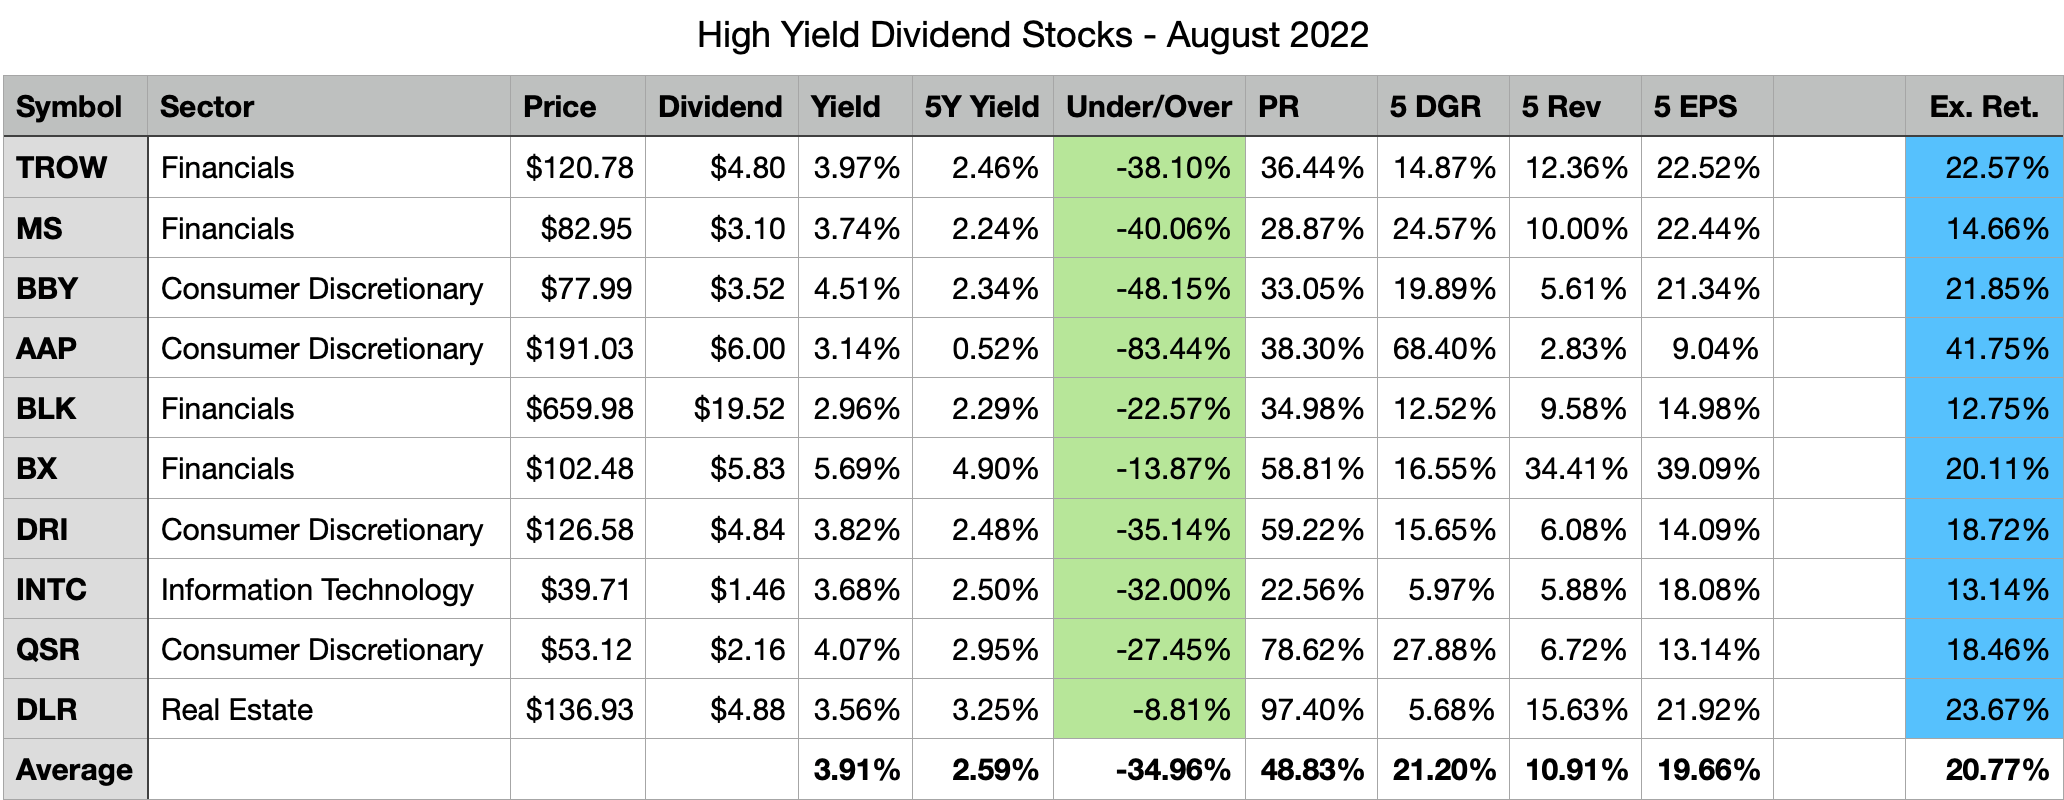
All 10 selected stocks this month appear to be potentially undervalued based on dividend yield theory. However the potential undervaluation for Advance Auto Parts (AAP) is misleading because of the very fast dividend growth during the past couple years. I believe the company looks attractive at its current valuation, but it is not 83% undervalued as dividend yield theory suggests. This valuation measure is correcting itself each month, as just a few months ago the stock looked potentially 85% undervalued. It will take a few more months and maybe even a year or two for the historical yield to balance out with the current yield.
The expected rate of return shown in the last column is computed by taking the current dividend yield plus a return to fair value over the next 5 years and a discounted long term earnings forecast.
Please keep in mind that my return forecasts are based on assumptions and should be viewed as such. I am not expecting that these 10 companies will hit the forecasted returns. What I do expect is that these 10 companies have the potential to offer better returns during the next 5 years compared to the 26 high yield stocks that passed my initial filters but ranked worse on quality and valuation.
Past Performance
The July watchlist performed very well gaining 10.88% last month, this brings the year-to-date return to minus 4.43%. For comparison purposes VYM, Vanguards high yield ETF, is down 3.74% this year and SPY, S&P 500 ETF, is down 12.61%. Following the strong results in July, the annualized return for the watchlist improves from 15.29% to 21.47%. The gap to VYM shrinks from 4.35% to just 0.24% (annualized return is 21.71%).
And the gap to SPY (outperformance) increases from 4.58% to just 5.61%. I do not expect that this watchlist beat VYM or SPY every month. However, I believe that a buy-and-hold investing approach leveraging the stocks presented on this watchlist will generate long-term alpha compared to the broad market. I also have a personal target rate of return of 12% that I believe will be attained by this watchlist when measured over long periods of time.
Thus far, the watchlist has exceeded my expectations and I believe it will continue to do so in the long run.
|
Date |
Watchlist |
ALL |
VYM |
SPY |
|
6 month |
-7.84% |
-3.32% |
-3.23% |
-7.75% |
|
3 month |
0.90% |
0.74% |
-0.23% |
0.43% |
|
1 month |
10.88% |
5.70% |
4.60% |
9.21% |
|
YTD |
-4.43% |
-2.37% |
-3.74% |
-12.61% |
|
Since Inception |
40.55% |
45.41% |
41.03% |
29.40% |
|
Annualized |
21.47% |
23.85% |
21.71% |
15.87% |
Individual watchlist returns for July 2022 were:
- (BBY) +18.10%
- (TXN) +17.18%
- (BX) +13.27%
- (MS) +11.87%
- (AAP) +11.86%
- (DRI) +11.19%
- (BLK) +9.87%
- (HD) +9.72%
- (TROW) +8.68%
- (OTCPK:INCT) -2.94%
Top 5 Stocks by total return since joining the watchlist:
- (PFG) +82.58% (21 months)
- (BMO) +81.01% (21 months)
- (MTB) +80.46% (21 months)
- (GD) +80.04% (21 months)
- (CVS) +77.77% (21 months)
PFG added only 0.22% in July but retains the number one spot. BMO added 5.86% in July and jumps back into 2nd place, now within sight of reclaiming its lead on the watchlist. MTB returned 11.33% in July and moves up to 3rd place, right on the heels of BMO. GD added a modest gain of 2.45% and drops to 4th place. While CVS added 3.87% and drops to the 5th best overall position. All top 5 stocks are now very close to each other and next month could likely see more changes.
Top 5 Stocks by Average Monthly return since joining the watchlist:
- (TXN) +17.18% (1 month)
- (HD) +9.72% (1 month)
- (ATO) +3.93% (8 months)
- (PFG) +2.91% (21 months)
- (BMO) +2.87% (21 months)
Buy-And-Hold Portfolios
The buy-and-hold portfolios are a more useful measure of how a long term investing approach utilizing this watchlist could perform. I started tracking one for 2022 and one since 2021. Both buy-and-hold portfolios invest an equal amount each month into all 10 chosen high yield stocks, the positions are never sold and all dividends are reinvested back into the issuing stock.
Here’s a quick breakdown of how each portfolio is performing.
The 2021 buy-and-hold portfolio has now been around for 19 full months. It gained 5.85% in July, beating VYM but trailing SPY. In spite of this loss, the portfolio maintains cumulative alpha of 3.14% over VYM and 8.48% over SPY. On an annualized basis, the portfolio has a return of 16.22% compared to 13.08% for VYM and 7.74% for SPY.
|
TOTAL |
Cumulative |
2021 |
2022 |
Annualized |
|
2021 B&H |
26.87% |
32.97% |
-4.59% |
16.22% |
|
VYM |
21.49% |
26.21% |
-3.74% |
13.08% |
|
SPY |
12.52% |
28.76% |
-12.61% |
7.74% |
It is now made up of 44 unique high yield dividend stocks. Below is a table of all of the positions, the cumulative return for each component and the allocation as of July 31, 2022.
|
Symbol |
Return |
Alloc. |
|
AAP |
0.65% |
2.54% |
|
AMGN |
12.22% |
6.24% |
|
ATO |
36.09% |
0.69% |
|
AVGO |
13.55% |
3.44% |
|
BBY |
-10.90% |
3.15% |
|
BEN |
-16.17% |
0.42% |
|
BK |
6.69% |
0.54% |
|
BLK |
6.17% |
1.61% |
|
BMO |
-2.32% |
0.99% |
|
BX |
-3.70% |
1.95% |
|
CMI |
9.20% |
0.55% |
|
CMA |
8.25% |
1.64% |
|
CMS |
16.18% |
1.17% |
|
CSCO |
-11.21% |
0.90% |
|
DLR |
-4.57% |
1.93% |
|
DRI |
-8.13% |
2.78% |
|
DTE |
21.62% |
1.84% |
|
EPD |
17.42% |
1.19% |
|
EVRG |
14.01% |
2.88% |
|
GD |
59.46% |
1.61% |
|
HBAN |
12.04% |
0.57% |
|
HD |
9.72% |
0.55% |
|
INTC |
-13.57% |
0.87% |
|
JPM |
-5.76% |
0.95% |
|
LMT |
21.73% |
4.30% |
|
MMM |
-16.30% |
6.76% |
|
MS |
-4.82% |
4.81% |
|
MTB |
25.57% |
5.07% |
|
NTRS |
12.12% |
1.70% |
|
PEP |
24.31% |
2.51% |
|
PFG |
15.02% |
4.65% |
|
PGR |
35.67% |
1.37% |
|
PM |
8.59% |
4.39% |
|
QSR |
-4.50% |
4.34% |
|
RY |
10.75% |
2.80% |
|
SNA |
9.02% |
0.55% |
|
STT |
3.06% |
1.56% |
|
TD |
4.28% |
4.74% |
|
TFC |
-10.34% |
1.81% |
|
TROW |
-6.73% |
2.83% |
|
TXN |
17.18% |
0.59% |
|
UPS |
0.31% |
2.03% |
|
USB |
-8.67% |
1.38% |
|
PARA |
-21.04% |
0.80% |
The 2022 buy-and-hold portfolio performed better in July gaining 8.82%. The portfolio trails VYM by 1.14% after 7 months but is outperforming SPY by 7.73%. I believe the portfolio will catch-up with VYM and offer alpha in the long run.
|
TOTAL |
Cumulative |
|
2022 B&H |
-4.88% |
|
VYM |
-3.74% |
|
SPY |
-12.61% |
As of month end July, it includes 27 unique high yield dividend stocks. Below is a table of all of the positions, the cumulative return for each component, and the allocation as of July 31, 2022.
|
Symbol |
Return |
Alloc. |
|
AAP |
0.65% |
7.39% |
|
AMGN |
11.29% |
3.27% |
|
BBY |
-10.90% |
9.16% |
|
BEN |
-16.17% |
1.23% |
|
BLK |
6.17% |
4.68% |
|
BMO |
-9.74% |
1.33% |
|
BX |
-3.70% |
5.66% |
|
CMI |
9.20% |
1.60% |
|
DLR |
-4.57% |
5.61% |
|
DRI |
11.19% |
1.63% |
|
EPD |
7.30% |
1.58% |
|
HD |
9.72% |
1.61% |
|
INTC |
-2.94% |
1.43% |
|
LMT |
17.93% |
1.73% |
|
MMM |
-7.26% |
6.81% |
|
MS |
-2.76% |
10.00% |
|
MTB |
17.06% |
1.72% |
|
PM |
4.98% |
1.54% |
|
QSR |
-2.70% |
7.15% |
|
RY |
-12.83% |
1.28% |
|
SNA |
9.02% |
1.60% |
|
TD |
-15.00% |
2.50% |
|
TROW |
-6.73% |
8.22% |
|
TXN |
17.18% |
1.72% |
|
UPS |
0.31% |
5.90% |
|
USB |
-16.19% |
2.46% |
|
PARA |
-20.36% |
1.17% |
Two benefits these portfolios offer over VYM and SPY are higher starting dividend yields and more spaced-out dividend payout schedules. The 2021 buy-and-hold portfolio is performing very well thus far, and the 2022 portfolio hasn’t been around long enough to be properly evaluated.
I believe that a buy-and-hold investing approach is the best strategy for all dividend investors. If you apply this strategy targeting quality companies trading for attractive prices, you should achieve better-than-average results in the long run.
PM Images
Be the first to comment