

AntonioGuillem/iStock via Getty Images
There’s something thrilling about dividends. Receiving that dividend payment in the mail or in your brokerage account reinforces the intention behind investing by manifesting the outcome. It says, “Your capital has been hard at work, here’s your reward.”
Dividends are a key feature of investment portfolios for all investors. For retirees dividends are an important source of income. Today, I want to review last month’s picks and take a look at my top 10 dividend payers for April.
A Dividend Recap
Dividends provide investors with direct income. This income rewards investors during draw downs in stock price. Dividend stocks tend to perform better during bear markets. For these reasons they can reduce volatility of a portfolio.
The table from Dividend.com demonstrates annualized returns by dividend payer type over 41 years. Dividend growers performed the best with the lowest volatility at an average annualized return of 10.07%. Regular dividend payers were not far behind at 9.28%. Non-dividend paying stocks only averaged 2.34%.
This data from Al Frank Asset Management tracks the total returns of dividend payer types over 80 years. Over the long term the highest payers performed best averaging 11.3% annual returns and non-payers performed worst at an average of 8.6% annual returns.
Data from Nuveen supports the data from dividend.com that dividend growers perform better outright and adjusted for volatility with average annualized returns over 10% and annualized standard deviations under 20. Dividend cutters are by far the worst performers with average annualized returns less than 0% and annualized standard deviation over 25.
Data from Fidelity shows that the 70th thru 90th percentile of dividend yield payers have the optimum risk-adjusted returns over the last 50 years. Notably, the 50th percentile is also attractive. Further data from Nuveen demonstrates that the payout ratio correlates with overall performance. Dividend payers with medium and medium-high payout ratios perform the best. High payout ratios perform the worst followed by low and medium-low payout ratios.
Compared to bonds, dividend paying stocks can offer better protection from inflation for investment income. Dividends enforce a greater degree of discipline on company management to meet their shareholder obligations. Finally, strong dividends are often a sign of healthy company fundamentals.
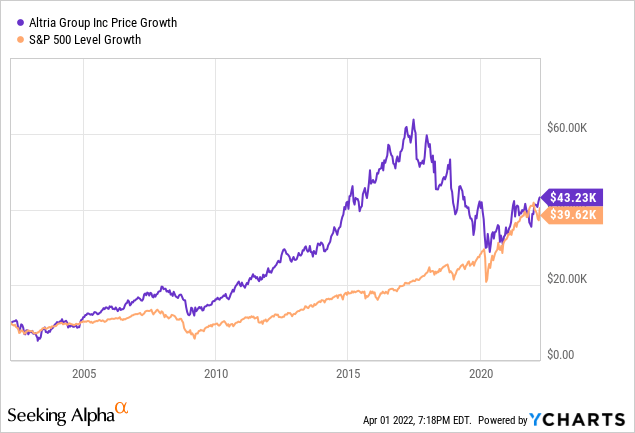
Consider the following case study. For the last 20 years the price performance of Altria Group (MO), a well-known dividend payer, and the S&P 500 (SPY) are nearly identical on an initial $10,000 investment:
When we examine total returns, including dividend reinvestment, for each $10,000 investment we can see MO outperformed by a factor of 5x:
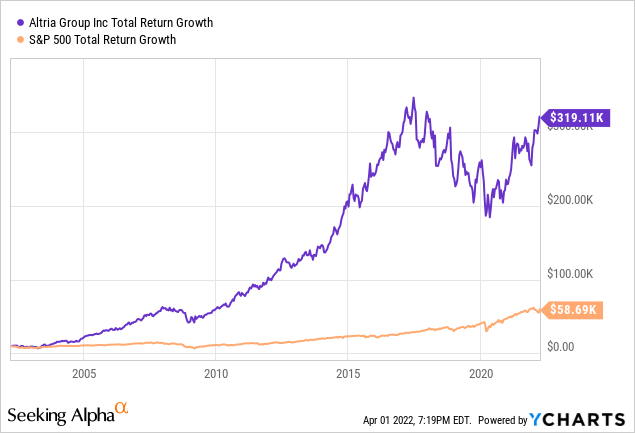
This exercise is not to suggest that MO is better than the S&P 500 or that dividend paying stocks always outperform. Altria performed exceedingly well during this time period. This is merely an illustration that omitting dividend distributions during stock evaluations is a critical mistake.
One reason that dividend investing is so powerful is the compounding effect of dividend reinvestment. By reinvesting dividends investors can achieve outsized returns for long term investments. Since 1980, 75% of the returns of the S&P 500 came from dividends when reinvested, demonstrating the importance of considering your dividend strategy.
There are major implications for retirees who cannot reinvest the dividends they need for income. For this example, we will model two identical companies with different payout ratios and dividend rates. In this case the retiree investor is not reinvesting dividends and will sell equity of the 3.3% dividend paying stock to produce the same amount of income as the 7.5% dividend paying stock. After 15 years the investment in the 3.3% dividend payer has returned a higher total return than the 7.5% dividend payer when Return on Assets is 10%. In this case the retiree is better to invest in the 3.3% dividend stock.
Chart by author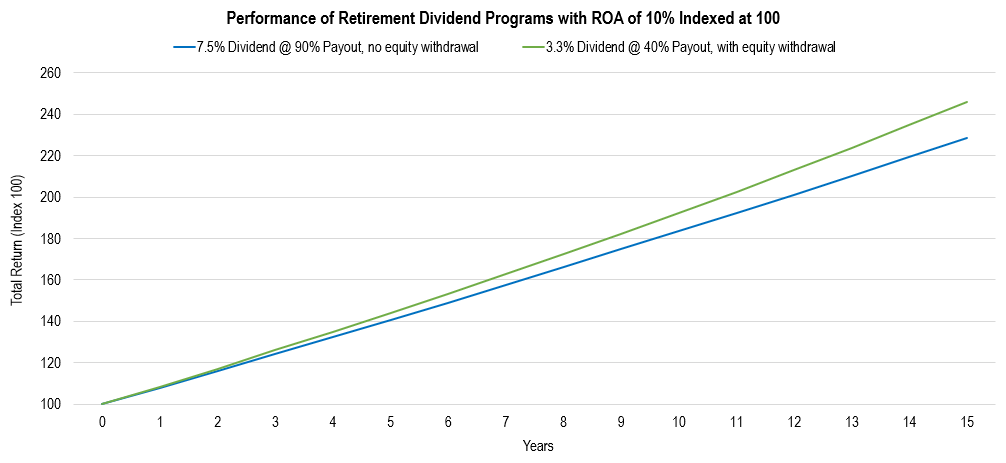
When we reduce the ROA from 10% to 7%, we can see that the 3.3% paying stock no longer produces a higher total return. The selling of equity for income cannot be overcome with growth. The return from the 3.3% payer is decelerating and approaching a limit. This is because if the retiree lives long enough, they will one day sell their last share of stock for income. In this case the retiree is better off investing in the 7.5% payer stock.
Chart by author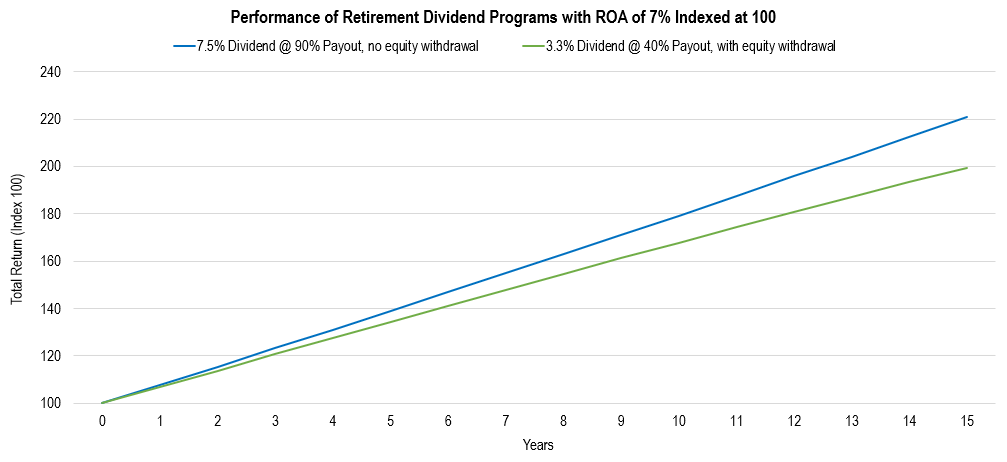
As we have seen, choosing a good dividend stock is not as simple as looking for the highest yield you can find. Often high dividend yields are a warning that the company is experiencing problems. Dividends can be cut when companies run into trouble and the margin of safety is inadequate. The future income that investors expected can vanish away.
Based on this information I have come to formulate four dividend payer goals:
- Maximize total return
- Deliver a meaningful yield
- Experience strong dividend growth
- Provide a margin of safety against dividend cuts
Top 10 Dividend Payers
The purpose of this exercise is to identify potentially good dividend payer equities that are worthy of further examination. This exercise does not analyze overall investment suitability and is not an assessment of risk. The lists are not recommendations, though I will mention if I own any of the names on the list.
Screening
The exercise begins with a stock screen that eliminates attributes which compromise my goals. This step is not meant to be acutely selective. I use the Seeking Alpha Stock Screener to sort equities based on the following qualifications. I implement substitutions to the data. For REITs I use FFO instead of earnings. For MLPs I use CFO instead of earnings.
| Metric | Screen |
| Dividend Yield FWD | >2% |
| Payout Ratio | <150% |
| 5Y Dividend Growth | >2% |
| Years of Dividend Growth | >5 |
| EPS FWD | >-3.0% |
| Cash From Operations | >-200M |
| Return on Assets | >3% |
| Debt to Equity | <500% |
| Debt to FCF | >-10% |
Ranking
The screen results in 82 stocks to rank. The ranking uses an equation that determines the percentile of each metric based on ideal ranges and assigns a weighted score according to an order of prioritization in the table below. The ranking score is out of 10. The score should be viewed relative to other scores.
| Metric | Reinvestment Strategy Priority | Retirement Strategy Priority |
| Dividend Yield FWD | Medium | High |
| Payout Ratio | High | Low |
| 5Y Dividend Growth | Low | Medium |
| Years of Growth | Medium | Medium |
| Revenue Growth FWD | Medium | Medium |
| EPS Growth FWD | High | Medium |
| Return on Assets | Medium |
Medium |
Top 10 Dividend Payers For Dividend Reinvestment
| Ticker | Name | Dividend Yield FWD | Score | |
| 1 | CTRA | Coterra Energy Inc. | 2.22% | 5.5 |
| 2 | MED | Medifast, Inc. | 3.84% | 5.3 |
| 3 | SIMO | Silicon Motion Technology Corporation | 2.99% | 4.7 |
| 4 | MMM | 3M Company | 4.00% | 4.7 |
| 5 | EPD | Enterprise Products Partners L.P. | 7.21% | 4.6 |
| 6 | PG | The Procter & Gamble Company | 2.28% | 4.5 |
| 7 | CNS | Cohen & Steers, Inc. | 2.56% | 4.3 |
| 8 | TXN | Texas Instruments Incorporated | 2.51% | 4.3 |
| 9 | ITW | Illinois Tool Works Inc. | 2.33% | 4.2 |
| 10 | GPC | Genuine Parts Company | 2.84% | 4.1 |
Top 10 Dividend Payers For Retirees
| Ticker | Name | Dividend Yield FWD | Score | |
| 1 | MED | Medifast, Inc. | 3.84% | 5.4 |
| 2 | CTRA | Coterra Energy Inc. | 2.22% | 5.3 |
| 3 | SIMO | Silicon Motion Technology Corporation | 2.99% | 4.4 |
| 4 | EPD | Enterprise Products Partners L.P. | 7.21% | 4.3 |
| 5 | MMP | Magellan Midstream Partners, L.P. | 8.46% | 4.2 |
| 6 | MMM | 3M Company | 4.00% | 4.0 |
| 7 | CNS | Cohen & Steers, Inc. | 2.56% | 3.8 |
| 8 | TXN | Texas Instruments Incorporated | 2.51% | 3.8 |
| 9 | AVGO | Broadcom Inc. | 2.60% | 3.8 |
| 10 | TROW | T. Rowe Price Group, Inc. | 3.17% | 3.7 |
This month’s lists differ slightly from last month’s lists. On the dividend reinvestment list: CTRA remains #1, AEM & LEG drop from the list, and EPD and GPC add to the list. On the retirement list: CTRA drops to #2, AEM drops from the list, and TROW adds to the list.
After last month’s article I started looking into Coterra Energy (CTRA). I’ll start by saying that I remain constructively bullish on energy, including oil and nat gas, although I fully expect near term weakness in the sector especially if the conflict in Ukraine is resolved. However, the long-term fundamentals support higher energy prices for 2022. Two articles, in particular, have done a superb job of analyzing the market.
The first article is from Ross Hendricks titled Oil’s Biggest Supply Crisis In Decades. Here is an excerpt from the article that summarizes the market situation:
Despite the short-term price volatility, the oil supply/demand backdrop remains as bullish as ever. Recent inventory data shows a dangerously tight market, even before the full impact of Russian supply losses.
The second article is from Goehring & Rozencwajg Associates, LLC titled The Oil Crisis is Unfolding in Slow Motion. Here is an excerpt from the article that projects where the oil price is expected to go:
Today, oil represents less than 3.3% of US GDP and would have to rise to $140 per barrel before approaching the critical 5% threshold. Why do we focus only on the US? Demand is the most elastic in wealthy countries with high energy intensities and the least elastic in developing countries that need energy to fuel their ongoing development. In 2008, prices spiked as high as $145 per barrel albeit temporarily. In this cycle, we believe oil prices will at some point reach, and potentially significantly exceed the previous $145 per barrel peak before we begin to see evidence of demand destruction.
The move in oil today reminds me of the move in oil from 2007-08. The market conditions are not the same, however, it has a similar appearance of a runaway move in a commodities bull market. This time, the creation of money stock far exceeds that of the previous bull run. The next chart is the logarithmic oil price adjusted for inflation. Today the oil price of $102 per barrel is not even close to the 2008 high, adjusted for inflation. That high would present $190 per barrel today. The peak that occurred in 2011 represents $144 per barrel. The move in oil has accelerated at similar speed compared to the 2007-08 run and if the trend continues it implies an oil price of $144 by the end of the year.
TradingView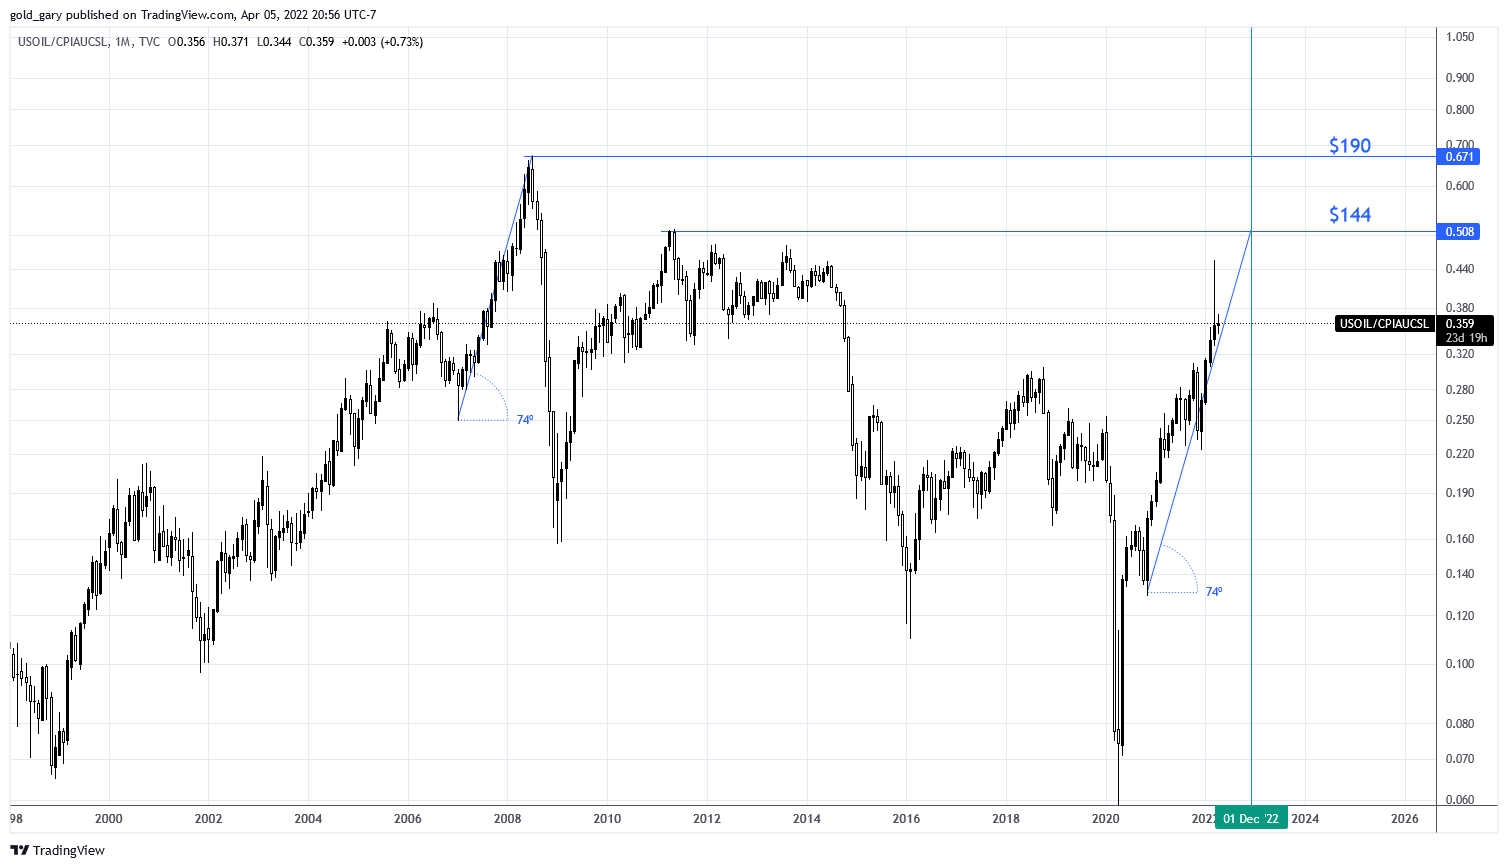
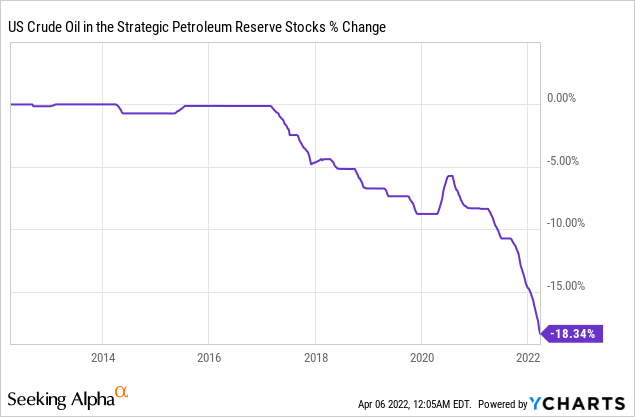
As of March 2022, ARA gasoil and US distillate stocks were at a 5-year low. The aggregate inventory of U.S. crude, gasoline, and distillate are at a long-term deficit compared to the four-year average. The shortages and elevated prices have prompted the Biden Administration to release oil from the Strategic Petroleum Reserve. The reserve is now withdrawn by 18% since 2017, half of which has occurred since 2021.
Production from U.S. Shale largely contributed to the inexpensive prices of oil in the 2010’s but that source has not been producing as well of late. U.S. DUCs have plummeted since 2021 while Permian Basin production has been mostly flat since 2020.
The Daily Shot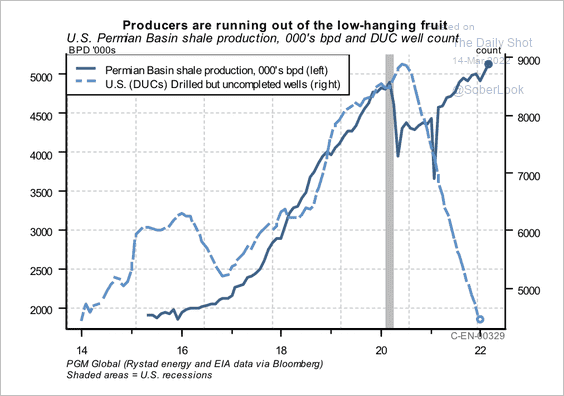
According to OPEC the global oil deficit is likely the largest in modern history at -2.5 mmb/d compared to the deficit of -1.0 in 2008. Given these considerations I expect $140 per barrel oil within 2022. Even if that does not happen, merely sustaining the current price of oil is very profitable for a company like CTRA.
The company primarily operates on 234,000 acres in the Permian Basin of Texas and New Mexico, 177,000 acres in the Marcellus Shale region, and 182,000 acres of the Anadarko Basin. In 2022 the company expects to earn 53% of revenues from natural gas, 35% from oil, and 12% from NGL.
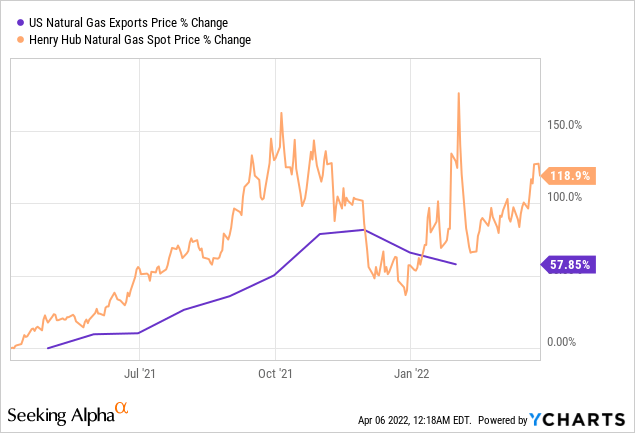
Natural gas prices in Europe have absolutely skyrocketed in response to the conflict in Ukraine. Today, the U.S. is increasing natural gas exports to Europe which is increasing prices in the U.S. The U.S. export price of natural gas is up 57% over the last year.
CTRA trades at a blended price to operating cash flow multiple of 7x. The forward price to cash flow multiple is expected at 5x. This compares to a normal P/OCF of 9.65x. Based on estimates, a return to that multiple over the next three years would result in a total return CAGR of 21%.
FAST Graphs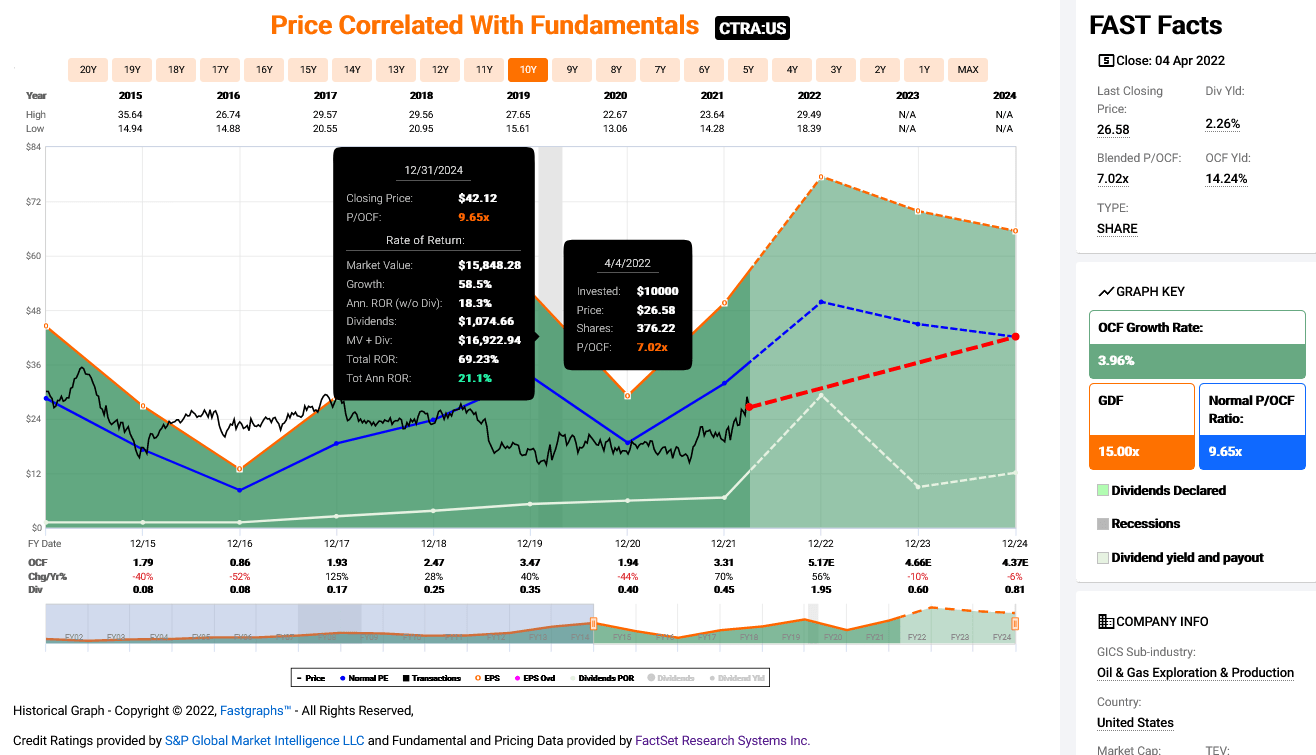
The company is setting a base dividend of $0.60 per share with a variable dividend supplement dependent on free cash flow. This results in an expected dividend payout of 8% for 2022 based on the share price of $23. Today the share price is $26.38, suggesting an annual dividend of 7% for 2022. For perspective, the company paid $1.12 per share in dividends in 2021 which would represent 4.2% at current market cap. An explanation of the variable dividend is in the graphic below.
Company Presentation (from Seeking Alpha)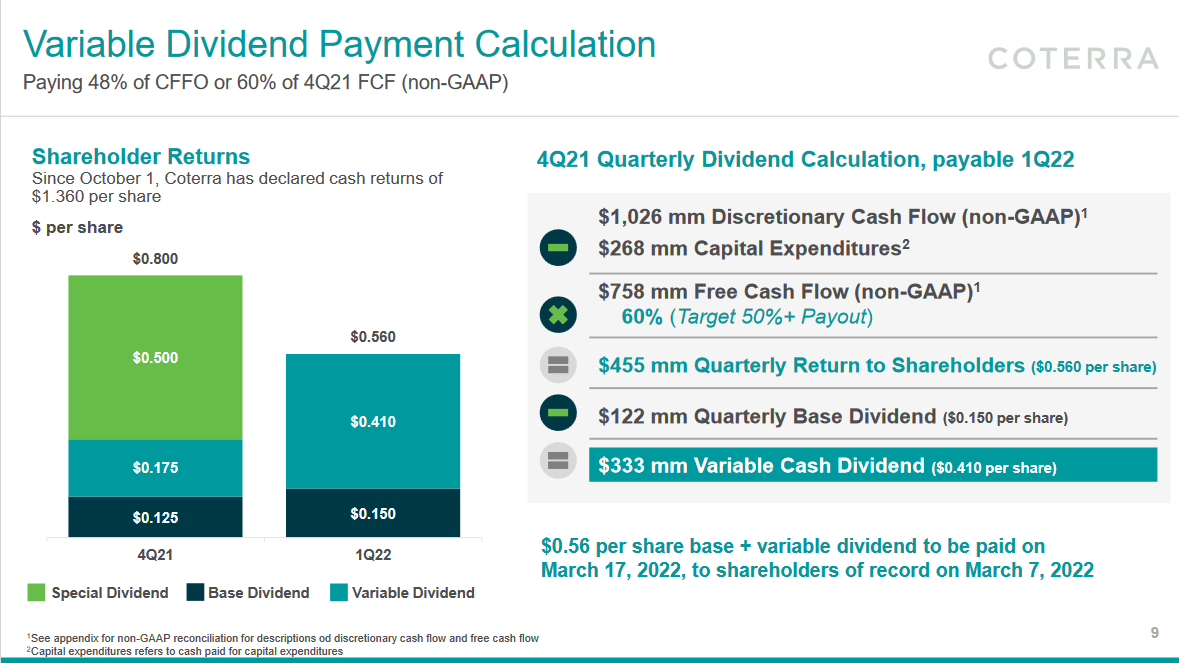
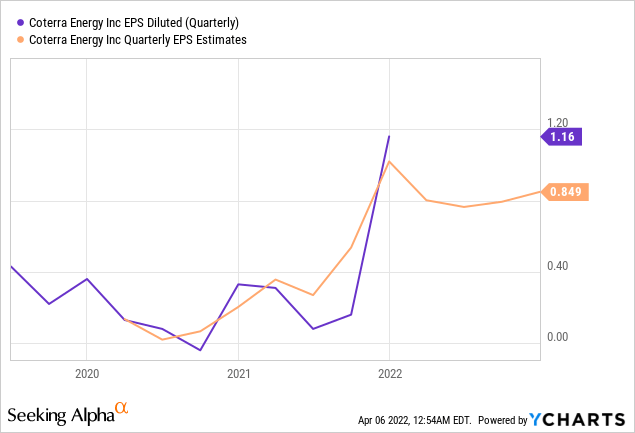
Company EPS has been rising since the 2020 drop in oil price. Estimates for quarterly EPS in 2022 range from 0.76 to 0.85 per share. Forward GAAP P/E is expected at 10.02.
In the Q4 2021 earnings call, President Tom Jorden had this to say about the company:
There are good times in our industry, so they will not last forever. Our experience tells us that things tend to stay good until they turn back, and these turns are swift and unanticipated. There is every reason to be optimistic about our business right now. Oil demand and prices are firming, supported by fundamental supply-demand imbalances, natural gas demand and LNG exports are increasing, driven in part by reawakening to the fact that natural gas is an essential component to the world’s energy transition needs. Public policymakers in the United States and abroad are reexamining their energy policies in a manner that favors natural gas demand. We hope these good times last, but Coterra is prepared for whatever the future may bring.
As we look ahead into 2022, we have a well-crafted plan, backstopped by the outstanding returns that our assets are providing. Our goal in formulating the 2022 capital plan was simple, to maximize our cash flow, capital efficiency and hold production relatively flat. As we have previously discussed, we are strategically interested in balancing liquids upward as a percent of our overall revenue and cash flow.
The company is expecting a strong 2022 with an increase in oil production of 4-10%. They have initiated a $1.25 billion share repurchase program which represents 5.6% of current market cap.
Company Presentation (from Seeking Alpha)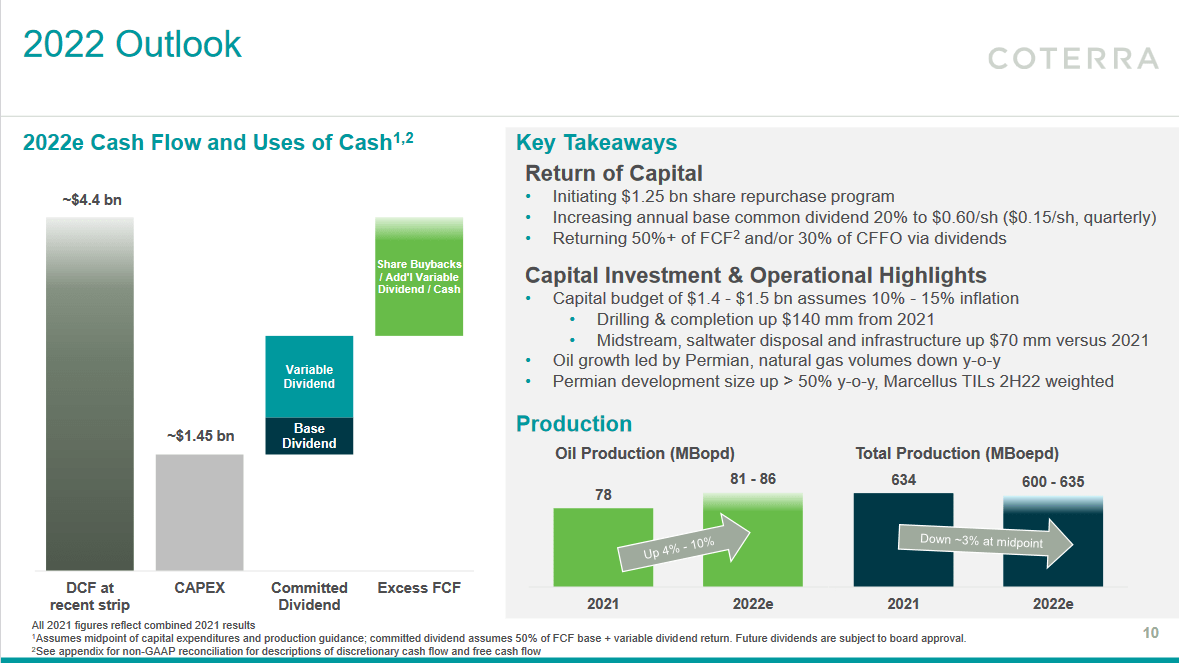
Summary
I hope this exercise was helpful in exploring top dividend payers. To be clear, this is not a comprehensive assessment but merely a starting place to explore dividend payers worthy of further investigation. Even though screening and ranking lists are cliche I have found this method to be useful in discovering new research opportunities.
I have opened long positions in CTRA. I do expect a recession in the next year or two as economic growth is slowing and recession indicators are initiating. Before we get there, however, I do expect higher oil prices and plenty of dividends from CTRA. I also have long positions in MMM, EPD, MMP, TROW, & AEM.
Be the first to comment