oversnap/iStock Unreleased via Getty Images
This article was coproduced with Williams Equity Research (WER).
Let’s begin with a well-known Sherlock Holmes quote:
“… when you have eliminated the impossible, whatever remains, however improbable, must be the truth…”
As we noted earlier in this series, publicly traded asset managers are unique players. They typically enjoy strong margins and, in many cases, permanent capital generating reliable fee revenue.
Like real estate investment trusts ((REITs)), asset managers also display incredible diversity. So there’s a lot to go around in more than one way.
This series covers 10 altogether – and there isn’t a bad name among them. In fact, at current valuations, they all arguably have better risk-adjusted return profiles than the S&P 500.
Let’s break down what we’ve covered so far…
- Part I included several of the best “asset light” managers, including BlackRock (BLK), T Rowe Price (TROW), and Invesco (IVZ).These firms focus on ETFs, mutual funds, and closed-end funds – though not exclusively – rather than complex private funds with direct ownership in private equity, credit, real estate, or infrastructure.
- Part II looked at Blackstone (BX), Cohen & Steers (CNS), and KKR & Co (KKR).These firms have very different profiles. For example, BX’s scale is a multiple of the others and highly diversified. Whereas CNS and KKR are overweight real estate and private equity, respectively.
But, as we already noted, there are more asset managers out there to explore, so let’s get to them…
Asset Manager Evaluation #1 (or #9): Blue Owl Capital Inc.
Blue Owl Capital Inc. (OWL) makes both equity stakes in asset managers and direct loans to private companies. That latter part is represented by the parent company of Owl Rock Capital’s (ORCC) advisor.
As such, OWL investors get to also own the manager that collects fee revenue from ORCC. This doesn’t make ORCC – a top-tier business development company (“BDC”) and one of the largest sector representatives with an approximate $5 billion market cap – internally managed, but it does similarly reduce conflicts of interests.
Also worth noting is that its external advisor has several other billion-dollar private BDCs under management.
As for OWL itself, it was private until its IPO via a $12.5 billion special purpose acquisition company (SPAC) in early 2021. And, so far, it’s not well-covered here on Seeking Alpha.
That’s likely attributable to its unusual business model and complex, SPAC-related financial structure.
For instance, OWL had 14.2 million shares in warrants outstanding at Q1’s end. These are tied to Class A shares – the publicly traded version you and I can buy – and are redeemable at $11.50 per share.
Their trading symbol is officially OWL.WS, but this varies by custodian. So it’s OWL+ at TD Ameritrade, which is what WER uses – and therefore where he recently added to his position at $1.91 per share.
If you’re interested too, make sure to:
- Read the fine print via SEC filings on how these instruments work before pulling the trigger
- Understand these warrants are a levered play on OWL’s performance.
One more thing to know about Blue Owl before we move on is this: The other half of its business – the part that owns equity stakes in other asset managers – goes by Dyal.
Okay then! Now that we’ve established that, let’s get into the nuts and bolts of Blue Owl’s business.
Blue Owl Continued
Blue Owl was founded by executives from some of the other companies we’ve covered in this series.
It had $102 billion in assets under management (“AUM”) at last report:
- $45 billion in direct lending
- $41 billion in GP Capital Solutions
- $16 billion in real estate, a relatively recent addition.
(Source: Blue Owl 2022 Investor Day)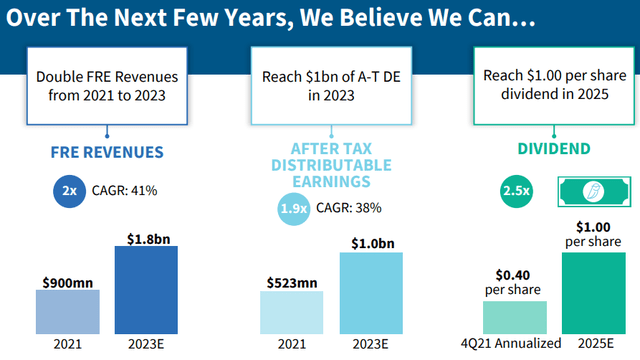
The above slide is really Blue Owl’s bottom line. Due to its unique business model and strong penetration into retail and broker/dealer capital markets, it expects to double its fee-related earnings (“FRE”) between 2021 and 2023.
That would result in a 38% compound annual growth rate (“CAGR”) in distributable earnings and a $1 per share dividend by 2025.
For context, Blue Owl closed at $10.05 last Friday. If it’s able to achieve these metrics – which is hardly guaranteed – the stock won’t have a 10% yield in 2025.
ORCC doesn’t even trade with that high of a yield, and it’s a BDC.
More realistically (and depending on many factors, including interest rates at the time), a 3%-4% yield is more reasonable. That means a stock price of $30-$40 compared to today’s $10.
That would be a 39%-50% annual return profile (compounded annually) if it worked out.
To understand those estimates, we need to know that 95% of Blue Owl’s FRE comes from permanent capital. So it has substantial control over its AUM and, subsequently, its financial fate.
The company also maintains excellent 60% margins on FRE. And since 100% of distributable earnings is derived from FRE, it’s easier to predict the dividend over time.
In 2021, Blue Owl generated $523 million in after-tax DE. That doesn’t look incredible against the current market capitalization of $14 billion…
But it will if Blue Owl maintains its current growth rate.
(Source: Blue Owl 2022 Investor Day)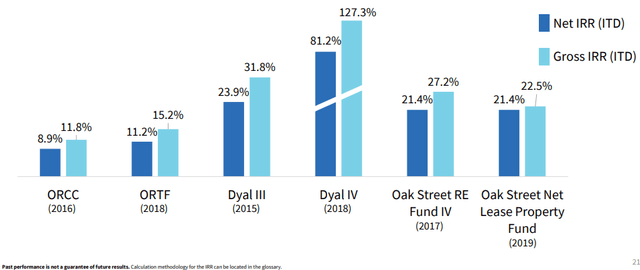
Blue Owl Continued Some More
Asset managers live and die by their performance. And in Blue Owl’s case, its funds have done very well.
The only vehicle that’s underperformed is ORCC, and that’s more to do with the valuation than financial performance.
If the stock were to trade at a 1.1x-1.15x premium to net asset value (“NAV”), for example, that would put it back around the 12% annualized return target it was aiming for.
Also, note the performance of the Dyal funds. All of them exceed the net internal rates of return inception to date above 21%.
(Source: Blue Owl 2022 Investor Day)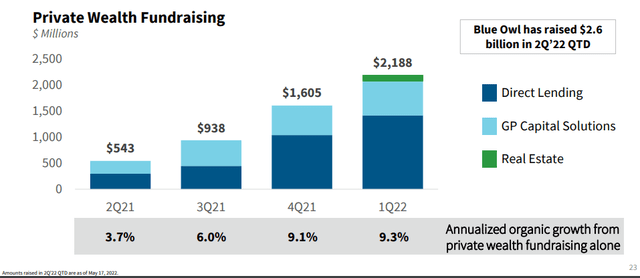
Blue Owl is riding what is likely the largest trend in the wealth management industry: direct lending/private credit. You can see above how rapidly direct lending has increased in the private wealth space since Q2-21.
Since 2017, direct lending FREs – which are roughly half the business by assets – grew at a 93% CAGR.
Yes. You read that correctly. Fee-paying AUM increased at a 51% CAGR.
Blue Owl’s direct lending division (including its predecessors) went from a 2.9% market share in 2010 to 17.6% by 2021’s end. On one hand, that means it won’t likely garner growth via market share like it has in the past.
At least not for more than a few years.
On the other hand, the whole industry is growing rapidly. And Blue Owl’s existing relationships all but guarantee they’ll get a good piece of that pie.
That does assume performance remains strong, but it’s not a big assumption. WER previously helped lead investment, and operational due diligence and manager selection at several of the companies Blue Owl raises capital from.
(Source: Blue Owl 2022 Investor Day)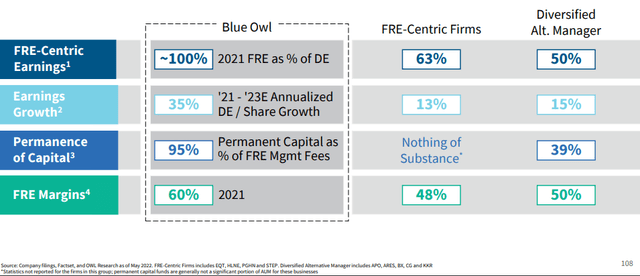
This all adds up to a strong competitive position, which is illustrated in Blue Owl’s valuation.
One More Round of Owl Capital Information
The stock currently trades for 18x-19x forward earning estimates, which puts it near the top of the pack. Whether investing in Blue Owl or its warrants makes sense mostly depends on your confidence in its 2-3 year outlook.
For iREIT on Alpha, our equity investments are medium- to long-term in nature. (e.g., we don’t buy or sell stocks simply based on what we think they’ll do next quarter.) So that timeline doesn’t bother us.
Admittedly, uncertainty is magnified by Blue Owl’s company structure. We won’t get into all the details here, but I’ll provide a couple key points.
Class A shareholders own 100% of the economic interest from OWL (warrant dilution aside and a few other footnotes) but represent only 4% of voting rights (as outlined on page 18 of this SEC filing). An earnout regime related to the business combination also reduces FRE in a way other managers aren’t subject to.
Sounds complex, I know. But if we use management’s estimates from qualified third parties for Blue Owl in 2023-2025… the earnings profile and current yield plus payout ratio indicate at least $30 per share.
The current dividend yield of 3.3% isn’t bad either despite the valuation being on the higher end. Anything below $11.50 – which happens to be the strike price on the warrants – is a great value in WER’s opinion.
WER owns both common stock and warrants in Blue Owl, which is investment-grade-rated at BBB. Our 12-month price target is $17 per share, or a potential total return of 74%.
That’s below the 52-week, by the way.
Asset Manager Evaluation #2 (or #10): Ares Capital Management
Ares Management Corporation (ARES) also manages a top-tier publicly traded BDC, which trades under Ares Capital (ARCC). ARCC, one of the best-performing and largest players in the sector, has been on the NYSE for nearly 20 years.
Another commonality it has with Blue Owl is Ares’ focus and expertise in private credit.
(Source: Ares Q2 2022 Investor Presentation)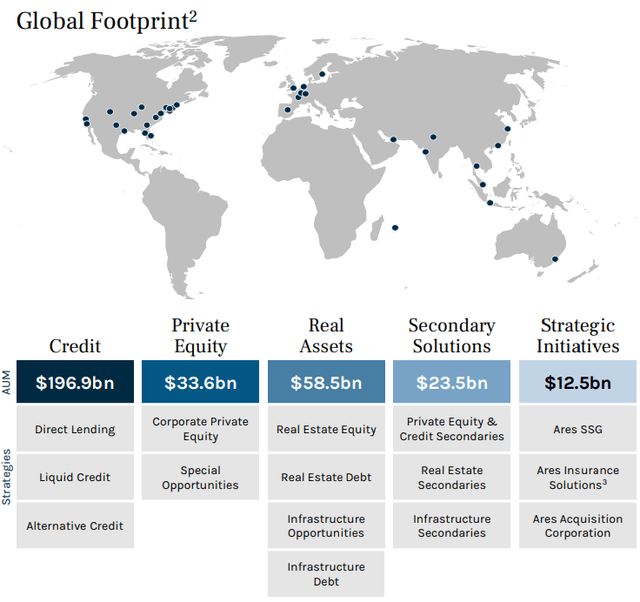
As of the end of the last reporting period, Ares was sitting on $325 billion in AUM. And it had just under $200 billion of that in the credit sphere.
Ares is benefiting from the same trends Blue Owl is: rapid growth in private credit and other types of alternative investments.
One advantage Ares has is its large scale and excellent brand name coupled with its often relatively modest market share. This gives it a lot of room to grow without requiring new division launches or having to establish a track record.
After seeing sky-high growth numbers with Blue Owl, let’s see how Ares stacks up given its three-times larger asset base.
(Source: Ares Q2 2022 Investor Presentation)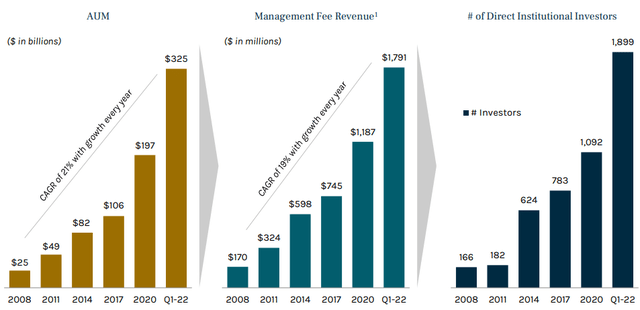
You’re probably starting to understand why we like these companies so much.
Ares achieved 21% CAGR in AUM since 2008 and an almost-as-compelling 19% CAGR in management fee revenue. It’s already at $325 billion in assets, and we know trees don’t grow to the sky.
That said, its largest peers have several times the asset base Ares does. Growth rates may not be around 20% annually for the next 14 years like they have been in the past 14…
But Ares can still double and potentially even triple its asset base over the next decade. How many other companies do you know growing that quickly?
(Source: Ares Q2 2022 Investor Presentation)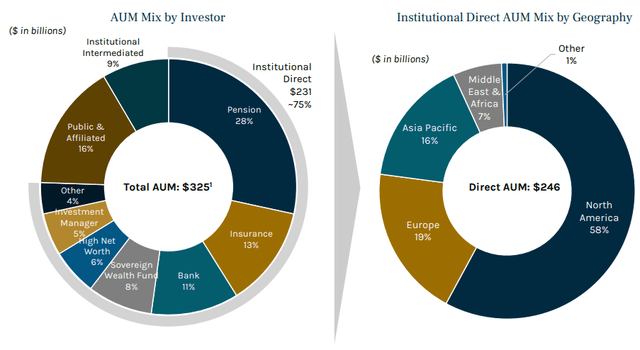
Ares Capital Management Continued
As with Blue Owl, WER has performed investment and operational due diligence on several of Ares’ funds over the years. They’ve also made great strides penetrating the retail and broker/dealer community – which is critical to offset the inevitable decline in pension assets.
Ares has this exposure down to only 28% today. And we expect that will be less than 20% in the years to come.
Ares has also done a great job absorbing institutional capital from geographies outside North America. This permits it to capitalize on global growth and wealth accumulation trends almost regardless of location.
(Source: Ares Q2 2022 Investor Presentation)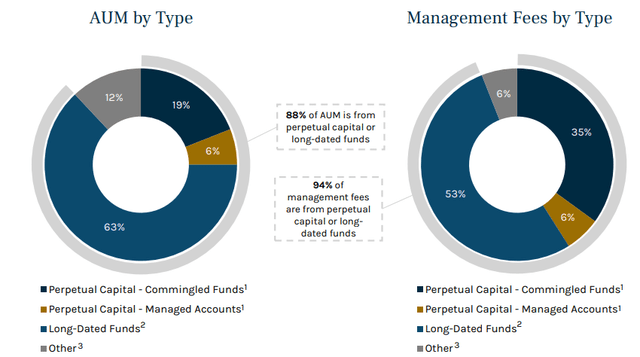
The asset manager has an above-average concentration of its AUM in perpetual or long-dated capital, which stabilizes earnings. In fact, Ares has obtained 86-89% of its revenue from FRE every year since 2017.
Yet another similarity with Blue Owl is how Ares is positioned to increase earnings per share as rates rise, all other things equal. Both firms are heavily invested in floating-rate credit that automatically ratchets higher with increases in LIBOR/SOFR.
Now, all large alternative investment managers are better situated against most types of inflation than the broader market. But not all are structured to increase cash flow because of it.
Ares is sitting on $58.2 billion in committed capital that’s yet to be invested. That’s a massive revenue and earnings source Ares is legally entitled to once employed.
Ares’ balance sheet is solid too with total liquidity exceeding $1.2 billion. And the market is willing to price debt out to 2051.
Clearly then, the bond market is confident in this business’ staying power. Plus, it enjoys a very attractive A- investment grade credit rating, which is two notches above Blue Owl’s.
Ares Capital Management Continued Some More
Ares has traded down from above $80 per share to below $60. That’s knocked the previously “good” valuation a lot closer to “great” territory.
It’s positioned to generate $0.70 in Q2-22 and approximately $3.25 for the year. We anticipate that to increase to at least $4.00 in 2023 and $4.50-$4.90 in 2024 depending on where global equity markets and other indices trade between now and then.
A lot of that growth is structural and not heavily dependent on asset prices, although that certainly helps.
Trading around $59 per share today, next year’s growth estimates equate to a 14.75x forward multiple. And we think that’s on the conservative side.
Today’s 18x multiple might look a little expensive, and it’s certainly not in distressed territory. But it’s a compelling bargain with a far better risk-adjusted return potential than the S&P 500 – if you have our confidence in Ares’ medium-term financial performance.
Below $65 is a good deal on ARES. Below $60, excellent.
Our upside target is $82.50 or a potential 12-month total return of 44%. And don’t forget it pays a 4.2% dividend too!
In Conclusion…
You know my methods, Watson. To quote our famous detective again:
“It seemed to me that a careful examination of the room and the lawn might possibly reveal some traces of this mysterious individual. You know my methods, Watson. There was not one of them which I did not apply to the inquiry. And it ended by my discovering traces, but very different ones from those which I had expected.” (Arthur Conan Doyle).
Likewise, you know our methods here at iREIT on Alpha. And, of course, it’s because of our granular, almost microscopic research, that we’ve achieved great successes.
(iREIT on Alpha)
We’ll be adding OWL and ARES to the iREIT on Alpha tracker soon.
Also, we have one more round to go until we conclude our quest for the best Asset Managers. So stay tuned!


Be the first to comment