

DakotaSmith
Fundamental 10-Step Analysis Of AutoZone Health & Valuation
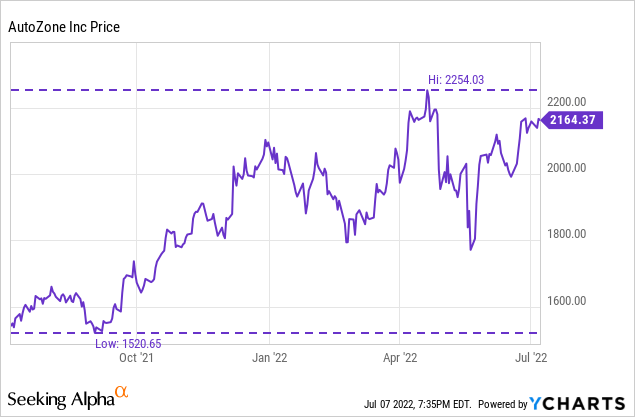
It’s been one year since we last looked at AutoZone (NYSE:AZO), which, at the time, was sitting at just under $1500 per share in early July 2021. Having surged nearly 50% from the prior twelve months in 2021, the valuation and fundamentals looked incredibly appealing then – and now the nearly $33B market cap has forged ahead to a $42.26B market cap representing a 28% increase in market cap, though the share price has surged even further due to share buybacks. Is the runup just a flight to safety amidst market weakness or have the fundamentals continued to improve over the past year? Let’s take a look at the current share price’s justification by valuation metrics and the fundamentals over the past 5 years, as well as looking at the advancements made since the last analysis one year ago.
AutoZone is the leading retailer of automotive replacement parts and accessories in the Americas, with 73% of revenues coming from the retail operation and 27% of revenues coming from the commercial operation of automobile parts. This has expanded significantly in the past year, with commercial going from 22% to 27% of revenues, a reflection of the company’s emphasis to “accelerate growth in commercial“. Since hovering in the $1500 range during the mid part of 2021, AutoZone has now surged ahead to $2164 at present.
Using the $42.26B market cap as of July 7, 2022, AutoZone is the predominant company in the America’s for automobile replacement parts & accessories, competing with Advance Auto Parts (AAP) and O’Reilly (ORLY). AutoZone is run by an incredibly unique management team that promotes steady growth and an absolutely robust share buyback program that has resulted in a 30.457% decrease in share count over the past 5 years accounting for shareholders having a 43.8% increase in ownership just through buybacks – a 7.5% CAGR alone. Add to this a 5-year average return on invested capital of 47.17% and a free cash flow growing at a 21% CAGR and you have what I believe is an incredible company selling at a reasonable price point that is delivering incredible shareholder returns.
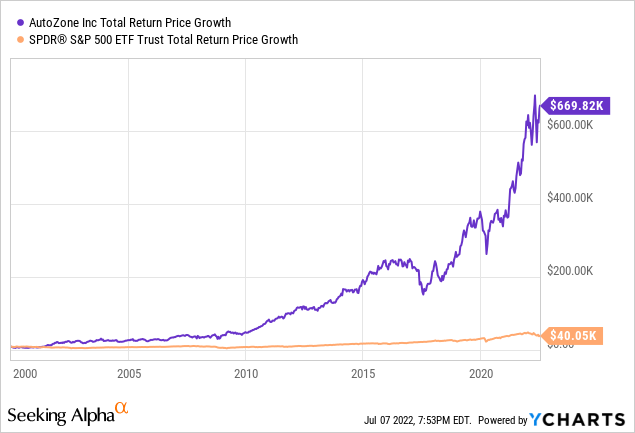
Just look at this return from January 1, 2000 showing the price growth of $10,000. AutoZone, through high return on invested capital, steady EPS growth, and massive share buybacks was able to trounce the S&P 500 by over 16 times. Take share buybacks alone – in this 20-year period, AutoZone decreased their share count by over 85% – representing investors increasing their ownership stake in the company by over 6.5x. This is a rare compounder of a company that operates in a steady business that holds the course and delivers incredible results for shareholders – and is a strong buy for a long-term investor.
One final factor…the financial markets are and have been abuzz over when the recession will come or if we are already in it technically. During the latest conference call, Chairman/President/CEO Bill Rhodes provided a detail that was remarkably poignant and comforting to investors:
This is the most remarkably resilient business I have ever seen. And I don’t understand why, when we have a recession, our business goes up and we come out of it and our business never goes down. It seems to flat line and then grow from there. It’s amazing to me. (Source)
Using a 10-Step Fundamental Analysis detailed further here, I will examine 10 important components of AutoZone and how the company measures up on each metric, either assigning a 1/1, 0.5/1, or a 0/1 for each of the 10 components.
Revenue & Income Increases With Management’s Goal Of “Steady Growth”
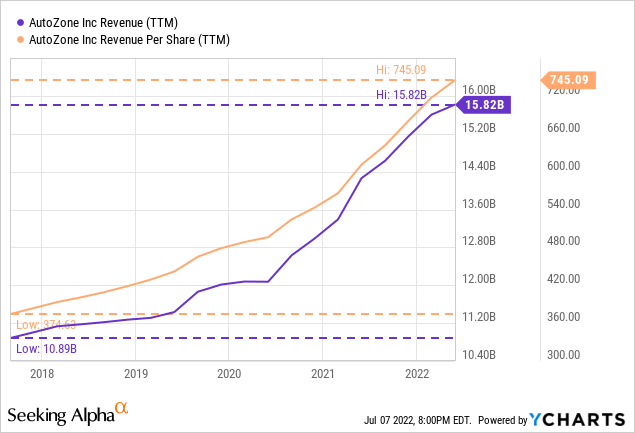
Looking at trailing 12-month numbers as of May 7, 2022 for operating revenue over the past 5 years, AutoZone has increased revenue from $10.77B in 2017 to $15.82B in 2022. Revenue increase has come from a combination of new store openings with 24 in the last quarter months alone (Source) along with a continued heightened emphasis on the commercial market and taking market share in that realm (Source). With the average age of a vehicle on the road in the United States now at 12.2 years old and increasing from last year, AutoZone is enjoying the benefits of having older vehicles requiring more maintenance, upkeep, and replacement parts on the road. This is a tremendous tailwind for a company that already benefits from automobile repairs normally being urgent in nature and not usually serviced by multi-day shipping through online channels, but rather immediate retail requirement. This revenue growth has grown at an 8% CAGR over the past 5 years, but taking into account the share buybacks creates an even more enhanced piece of data: per share revenue – which grew from $384.22/share in 2017 to $811.80/share in 2022 or a 16.14% CAGR. This is the effect of share buybacks and how they can even further enhance growth for the investor.
From last year’s evaluation alone, revenue increased 11% and 22.5% per share including share buybacks – the compounding machine continues forward.
Revenue Growth: $10.77B -> $15.82B over 5 years, 8% CAGR // 16.14% per share CAGR |
Solid revenue growth over 5 years enhanced by share buybacks, and continuing to accelerate even more in the past twelve months gives confidence that new store openings and enhanced commercial segment are benefitting shareholders. Score: 1/1
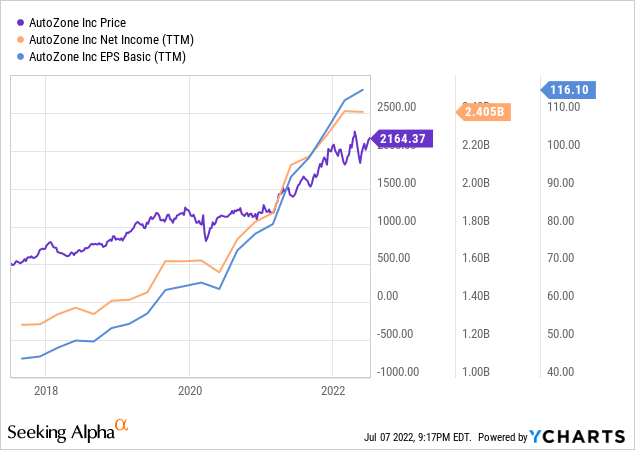
Although net income is not quite as insightful of a valuation metric compared to free cash flow, the minimal capital AutoZone requires coupled with mostly depreciated assets leads to a very similar net income or earnings figure – one that is growing at a rapid rate. Using trailing twelve-month figures as of May 7, 2022 – AutoZone’s net income has nearly doubled over the past 5 years from $1.274B to $2.405B representing a 13.5% CAGR. These figures are further enhanced as shown in the chart when seen through a per share basis to account for the buybacks: $45.45/share in earnings in 2017 growing to $123.41/share in earnings over 5 years or a 22.11% CAGR. (Note the chart doesn’t accurately show the most up-to-date and ever decreasing share count) These types of growth rates in a mature business are incredible and highlight the power of the internal compound with minimal capital expenditures required (and a high rate of return achieved on those expenditures to boot). But…now is a good time for an investor to ask the obvious…can this continue or has this simply just been a very good run?
Looking to the future there are two major headwinds that AutoZone will face in terms of their financial performance: 1) Will the increase in electric vehicles on the road and their limited replaceable parts drag the company down? and 2) Will gross profit margins continue to decline like in the past couple of years and ultimately face serious margin reduction? There are obviously no easy or resolute answers to be had to either question, but what we do know at present should alleviate major concerns. We do know that while electric vehicles make up only 2.2% of global cars on the road, there will be an increase as time goes on – projected to be approximately 1/3 of all vehicles on the road by 2040. But even this bold prediction still leaves a 20+ year runway for the company at very low electric car rates on the road, and even after 20 years, they will still not be in the majority. Finally, management has stated margin declines are a result of increased volumes in place due to an aggressive expansion into the commercial program, which currently represents 27% of sales, up from just 22% of sales in 2021.
Income Growth: $1.274B -> $2.405B over 5 years, 13.5% CAGR // 22.11% per share CAGR |
Very consistent & robust income growth over 5 years significantly enhanced on a per share basis by share buybacks. Score: 1/1
Moderate Balance Sheet And Debt Ratios Do Not Detract From The Stability
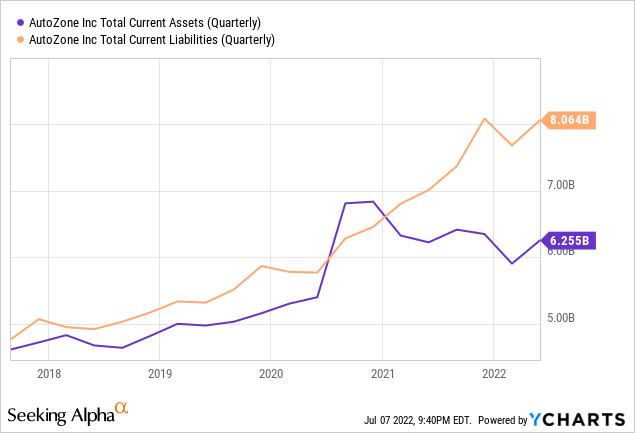
Due to the liquidity of current retail assets being sold and the amount of inventory required, retailers and grocers traditionally do not hold current assets greater than current liabilities. This is magnified by AutoZone holding over 100,000 SKUs in some of their hubs (Source), the growing store count, and continued increasing growth of their commercial market for auto body shops and mechanics that require even more rare or specialized parts than would otherwise be found in a normal retail environment. Based on this and the established industry norms, while liquidity in terms of the company’s ability to pay off all current liabilities with current liabilities is definitely ideal, it is rarely expected in a retail setting such as this due to sell-through rates – and the 5-year chart above confirms this with current assets only exceeding current liabilities for a few months towards the end of 2020. I will note however, that the delta between the assets and liabilities has reached its greatest level yet, increasing by $1B just in the past twelve months.
Assets vs. Liabilities: $6.255B current assets vs. $8.064B current liabilities / negative but common for retail |
While common for retailers, current assets do fall short of current liabilities, representing less than ideal liquidity. Due to the norms of the industry practice, we will deduct half a point instead of a full point. Score: 0.5/1
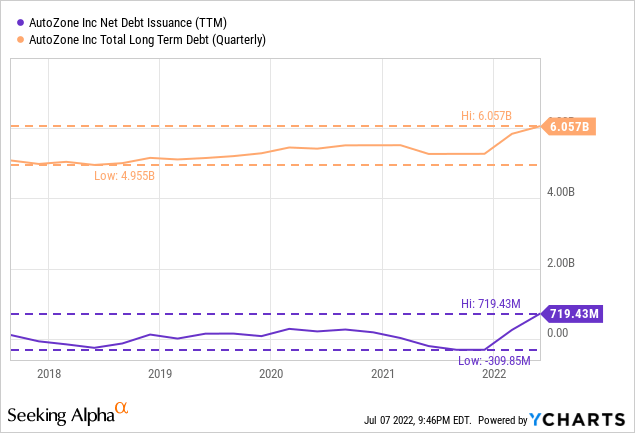
AutoZone management has kept long-term debt at approximately 2.25x free cash flow, which represents a reasonable figure for management to keep within. The debt expansion did concern me at first glance, I will admit, but management noted in the Q32022 conference call:
Regarding our balance sheet, our liquidity position remains very strong and our leverage ratios remain below our historic norms. Our inventory per store was up 10.7% versus Q3 last year.
I believe that management is behaving prudently with their debt and only appears to accrue debt in order to fund their aggressive share buybacks during leaner quarters in order to keep sufficient cash on hand for inventory purchases.
Long Term Debt: Growing, But Funding Future Growth and Below Historical Norms with Great Liquidity |
Management is prudently using debt, interest is a small portion of cash flow, and overall is 2.25x Free Cash Flow. Score: 1/1
The Reason For The Returns: Unheard Of Return On Capital & “The” Share Buyback Plan
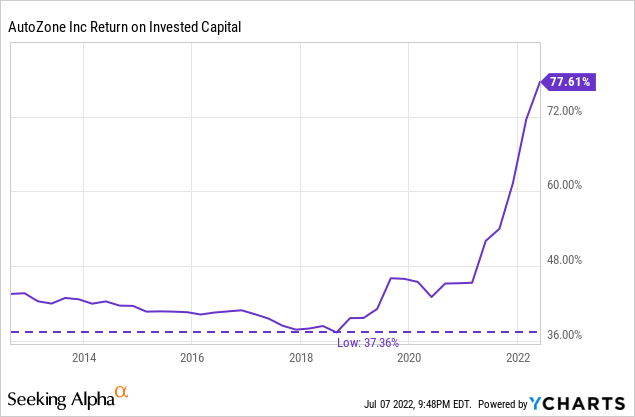
After examining the long-term debt situation on the balance sheet, it appears an ideal time to examine management’s returns from the capital invested back into the business. Return on invested capital is perhaps one of the greatest indicators of a competent management team – how capital is invested and allocated back into the business. The average of S&P 500 companies is approximately 7%. Looking at doing better than average and towards companies deploying their money in a high quality manner, I look for businesses earning more than 10% return on invested capital. Return on invested capital is a financial metric favored by Charlie Munger, stating “It’s obvious that if a company generates high returns on capital and reinvests at high returns, it will do well.” (Source) With an average ROIC of 47.17% over the past 5 years, AutoZone management is doing a first-class job of using shareholder money in the best manner possible. Investors can feel confident whatever free cash flow is not being returned to shareholders in the form of buybacks is being very wisely used to internally compound growth within the company. In fact, current ROIC shows returns at 77.6% which is almost unheard of in any industry, and the 10-year chart above represents just how consistently AutoZone has produced outsized returns. Looking at the chart, you may be fooled to believe that the 10-year low of 37.3% is a bad number – even the 10-year low is still an unbelievably high number that 99% of companies never come close to achieving. To outperformance the average S&P in this regard by 7 times over 5 years and 11 times at present truly shows the magnitude by which AutoZone makes incredible investments within their company, generating substantial returns for shareholders.
Invested Capital & Equity Returns: 47.17% ROIC avg 5 years & currently 77.6% – Incredible Numbers |
ROIC is well above 10% at 47.17% average. No return on equity since intense buybacks create negative shareholder equity. Score: 1/1
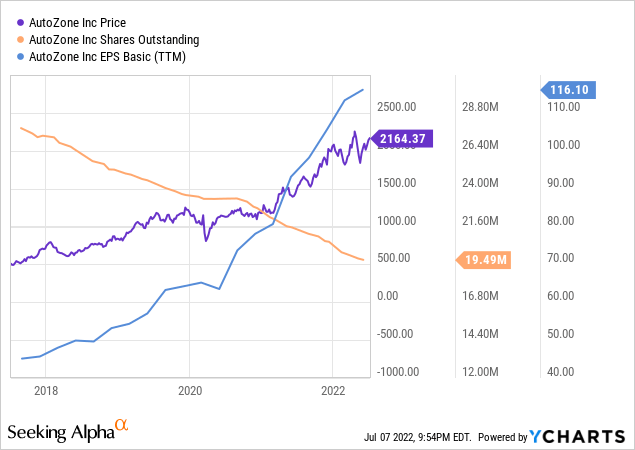
AutoZone has a share buyback program that is simply unparalleled amongst any company with such a large market cap, or any company period! Let’s look at the chart above for a simple example: as shares (orange line) go down by 30.4% during 5 years, earnings per share (light blue line) go up by over 171% during the 5 years – so it is no surprise that the share price (purple line) also goes up, in this case, by 327%.
The number of shares of the company and the way management either enhances shareholder value or dilutes it through buybacks or share issuances is a very meaningful metric for overall investor return. While some companies will buy back 1% of shares annually and have a very good buyback program at that, others will dilute and raise capital through issuing new shares. With AutoZone, the magnitude of the buyback is truly impressive. In 5 years, the shares outstanding have decreased from 28,030,696 shares to 19,487,599 shares, representing a 30.4% decrease in shares and investors having a 43.8% increase in ownership: a 7.5% CAGR just from buybacks alone! In fact, the Q3 press release shows that management bought back 449,000 shares totaling $900MM just in the prior quarter alone. As demonstrated by Berkshire Hathaway’s (BRK.A) (BRK.B) long term buying back of shares and refusing to dilute or split the stock, AutoZone management is showing that buybacks are one of the best ways to enhance shareholder return in a tax efficient manner in the long term. The growth of the earnings power is magnified by the decrease in the share count, creating a compounding machine.
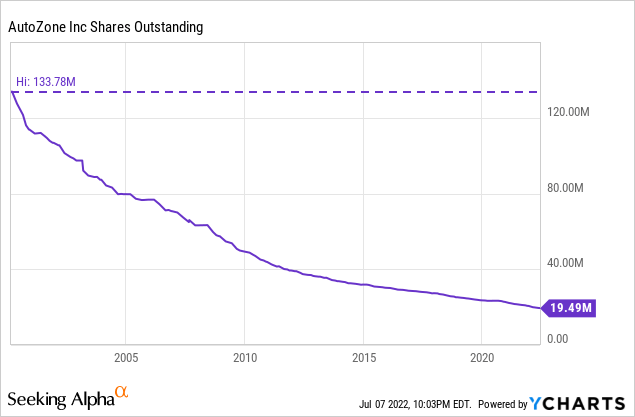
Take a look at one more chart just to really enhance the magnitude of this: from January 2000 to now, AutoZone decreased their share count by over 85.4% – representing investors increasing their ownership stake in the company by 6.5x. A fun, easy, and highly visual way to think of it – if your ownership of AutoZone is like a 20-slice pizza pie, in 2000 you only received one slice out of 20. Thanks to share buybacks, you now get 6.5 slices out of the 20-slice pizza or roughly one-third of the entire pizza. It’s good to be patient and let compounding do its job!
Buybacks: 28.03MM -> 19.487MM shares over 5 years, 30% decrease in shares – A++ and Unparalleled |
Shares have decreased over past 5 years & is the gold standard. Score: 1/1
Management purposefully does not issue a dividend of any kind, preferring to return capital to shareholders through share buybacks and through reinvestment into the business at high rates of return. These two metrics together offer investors a far more lucrative rate of return due to the effects of internal compounding and the tax efficiency of buybacks for shareholder benefit. I also personally believe that a lack of a dividend tends to encourage more long-term holders of the business, as shareholders tend to appreciate the internal “snowball” compounding effect.
Dividend: $0 dividend annual, 0% fwd yield // Management returns through share buybacks |
The no dividend policy is supported by outstanding return by other means. In this case, the policy works well. Therefore, less is more. Score: 1/1
Strong & Growing Free Cash Flow…At A Reasonable Valuation
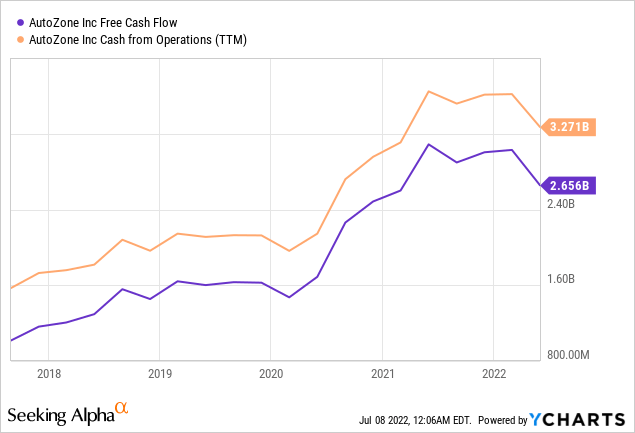
From the standpoint of a company’s operational strength and stability, free cash flow represents a very meaningful metric and the primary factor I look towards when creating a valuation metric and measuring long term stability and growth. AutoZone again outperforms with regards to free cash flow over 5 years – going from $1.008B to $2.655B representing a 21.37% CAGR and well over doubling (2.6x) during the time period. Where the numbers really become affected greatly though, is on a per share basis thanks to the buybacks – approximately $36/share in free cash flow 5 years ago has turned into approximately $136/share in free cash flow now – a 3.75x increase representing a staggering 30.5% CAGR. Like the other fundamental metrics of the company that we have reviewed, this is a remarkable display of management overperformance. But I was concerned with what appeared to be a significant downturn in the free cash flow, and even cash from operations performance. I looked at cash from operations because if management was spending significantly towards growth in property, plant and equipment that would count as a capital expense and could significantly lower free cash flow – cash from operations on a cash flow statement would not be affected by that. The two components falling in lockstep is, according to management, and the cash flow statement a factor of inventory purchases and timing. Here is CFO Jamere Jackson on the reason for the free cash flow decline:
The primary reason for the decline in free cash flow versus last year is the timing of merchandise inventories and payments this year versus last year. We expect to continue being an incredibly strong free cash flow generator going forward. We remain committed to returning meaningful amounts of cash to our shareholders. (Source)
Free Cash Flow: $1.008B -> $2.655B in 5 yr (21.37% CAGR increase) or $36/sh -> $136/sh (30.5% CAGR) |
Free cash growth over the past 5 years is consistent and compounding at very high rates for an incredible result that directly has benefited shareholders significantly. Score: 1/1
Now for the component of valuation with regards to AutoZone: Let’s look at two methods: free cash flow, and earnings.
AutoZone, based on the $42.26B market cap, is selling for 15.9 times free cash flow for the trailing twelve months – representing a 6.29% initial rate of return based on free cash flow with a 21.37% CAGR free cash flow growth over the past 5 years.
AutoZone, based on the $42.26B market cap, is selling for 17.57 times earnings for the trailing twelve months – representing a 5.69% initial rate of return based on earnings with a 13.55% CAGR earnings growth over the past 5 years.
By my standard metrics of looking for growth companies selling for under 20 times free cash flow, the valuation of AutoZone is very appealing from both aspects noted above especially when considering the dynamic growth. This valuation gives me great confidence: I am buying a compounding company with strong free cash flow growth and mitigating measures to combat future concerns with e-commerce and electric vehicles.
Valuation: 15.9x FCF; 17.57x EPS; 5.7-6.3% implied initial return w/21% CAGR FCF & 13% CAGR Earnings |
Very appealing valuation on both aspects considering the dynamic growth, management’s incredible capital allocation strategies, and the shareholder friendly buyback policy. Score: 1/1
Overall AutoZone Recap & Valuation
Looking at all of these metrics and making assumptions based on the future is the key to creating assumptions on future returns and growth. We know that management is going to continue expanding the commercial program aggressively, opening 11 more Mega-Hubs just this year. This business represents lower margins, but is capturing business from competitors overall. Frankly, when management allocates capital at a 70%+ return on invested capital, you can trust the expertise in the marketplace to make and commit to the right decisions.
Let’s take a series of assumptions based on earnings over a 5 year period:
– 14.5% annual compounded free cash flow increases (well below the present 5-year growth of 21.37%)
– 6.90% annual share count reduction (exactly at the same pace as the present share count reduction rates over the past 5 years – management has shown this is their primary way of creating value and I don’t see this changing)
– 12.5 times free cash flow terminal multiple (significantly below the 16x free cash flow valuation the business has right now)
What does this give investors in terms of returns over the next 5 years?
Roughly a 17% annual return for AutoZone based on the present share price. I strongly believe management will continue growth, continue buying back shares with vigor, and deliver internally compounding results to shareholders generously over the next 5 years – leading to a 5 year share price of $4,800 by 2027. I want to highlight that this assumes a slowing free cash flow growth rate and a much less generous valuation to free cash flow than exists at present, and yet the compounding machine still is able to return 17% annually based on these assumptions – this is the margin of safety that leaves me with great confidence for AutoZone shares and why it’s a primary holding in my portfolio.
Please see this blog post here to understand the methodology behind the 10-step analysis.
Revenue Growth: $10.77B -> $15.82B over 5 years, 8% CAGR // 16.14% per share CAGR |
Income Growth: $1.274B -> $2.405B over 5 years, 13.5% CAGR // 22.11% per share CAGR |
Assets v Liabilities: $6.255B current assets v. $8.064B current liabilities / negative but common for retail |
Long Term Debt: Growing, But Funding Future Growth and Below Historical Norms with Great Liquidity |
Invested Capital & Equity Returns: 47.17% ROIC avg 5 years & currently 77.6% – Incredible Numbers |
Buybacks: 28.03MM -> 19.487MM shares over 5 years, 30% decrease in shares – A++ and Unparalleled |
Dividend: $0 dividend annual, 0% fwd yield // Management returns through share buybacks |
Valuation: 15.9x FCF; 17.57x EPS; 5.7-6.3% implied initial return w/21% CAGR FCF & 13% CAGR Earnings |
Valuation: 15.9x FCF; 17.57x EPS; 5.7-6.3% implied initial return w/21% CAGR FCF & 13% CAGR Earnings |
Management & Moat: Incredible Mgmt Deploys Capital With Great Talent & Sticks to the Buyback Plan |
Based on 10-Step Analysis: 9.5 out of 10 |
Be the first to comment