

da-kuk
Portfolio Changes in May
May
Following a massive May where I managed to invest a record $3,500 in net capital, investment activity has come down in-line with historical averages and amounted to around $1,300. I would have loved to invest more but the exceptionally strong US Dollar is making purchases of US companies more and more expensive as a European investor. On the flip side my dividend income will get a nice boost in EUR.
Overall with EUR/USD parity reached this week the big question is how long that pair will trade as such a historically low level as I want to avoid buying too many US stocks at such unfavorable exchange rates.
I am seeing some very attractive deals in the tech space, especially Advanced Micro Devices (AMD), and am waiting to pull the trigger. Financial stocks are also getting cheaper and cheaper every week and as a dividend investor this is great news.
I am waiting for more good deals on solid dividend stocks to cushion the impact of inflation while I keep running my savings plans on dividend stocks with a yield of at least around 3%. The only out of the ordinary purchase this month was tied to Medical Properties Trust (MPW) as the stock dipped below $15 and reached a juicy yield of above 7.5%. I am aware of the interest rate risk this company is exposed to but with a rather low payout ratio and strong balance sheet that price is certainly worth the rather limited risk. Apart from that all other purchases were triggered by the almost weekly savings plans.
Due to the nature of how the monthly investment plan process works, I am investing relatively equally into these stocks at two points of time during the month – at the beginning of the month and mid-month – which breaks down as shown below. Figures are in Euro and show that, for instance, at the beginning of the month, I am investing between 50 and 75 EUR each into Microsoft, The Home Depot (NYSE:HD), Visa (NYSE:V), W. P. Carey (WPC), and BP (NYSE:BP). Mid-month, I am adding between 33 and 40 EUR each into STAG Industrial (NYSE:STAG), AT&T (T), NextEra Energy (NYSE:NEE), Toronto-Dominion Bank (NYSE:TD), Main Street Capital (NYSE:MAIN) and JPMorgan (NYSE:JPM).
I have added several investment plans starting mid-September 2020 which include AGNC Investment Corp. (NASDAQ:AGNC), Ares Capital (NASDAQ:ARCC), Medical Properties Trust (NYSE:MPW), The Bank of Nova Scotia (NYSE:BNS) and The Trade Desk (NASDAQ:TTD). Investments here will be focused on high-yield as well as high-growth stocks in the technology, therapeutic and renewables sectors.
All those purchases substantially raised my forward annual dividend income, breaking down as follows:
Added Dividend Income (Designed by Author)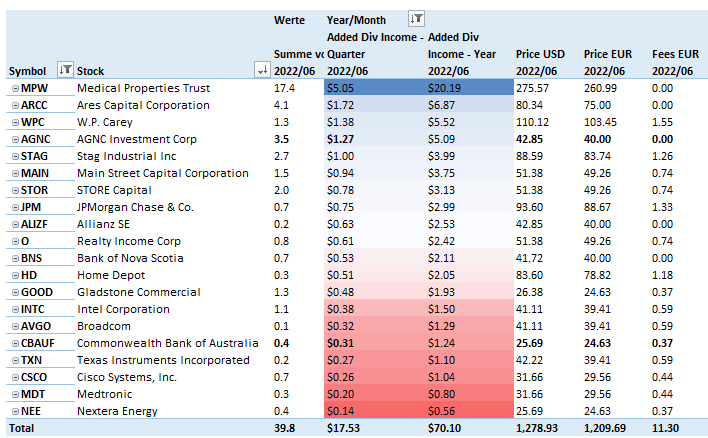
All net purchases in June can be found below:
Net Purchases in June (Designed by author)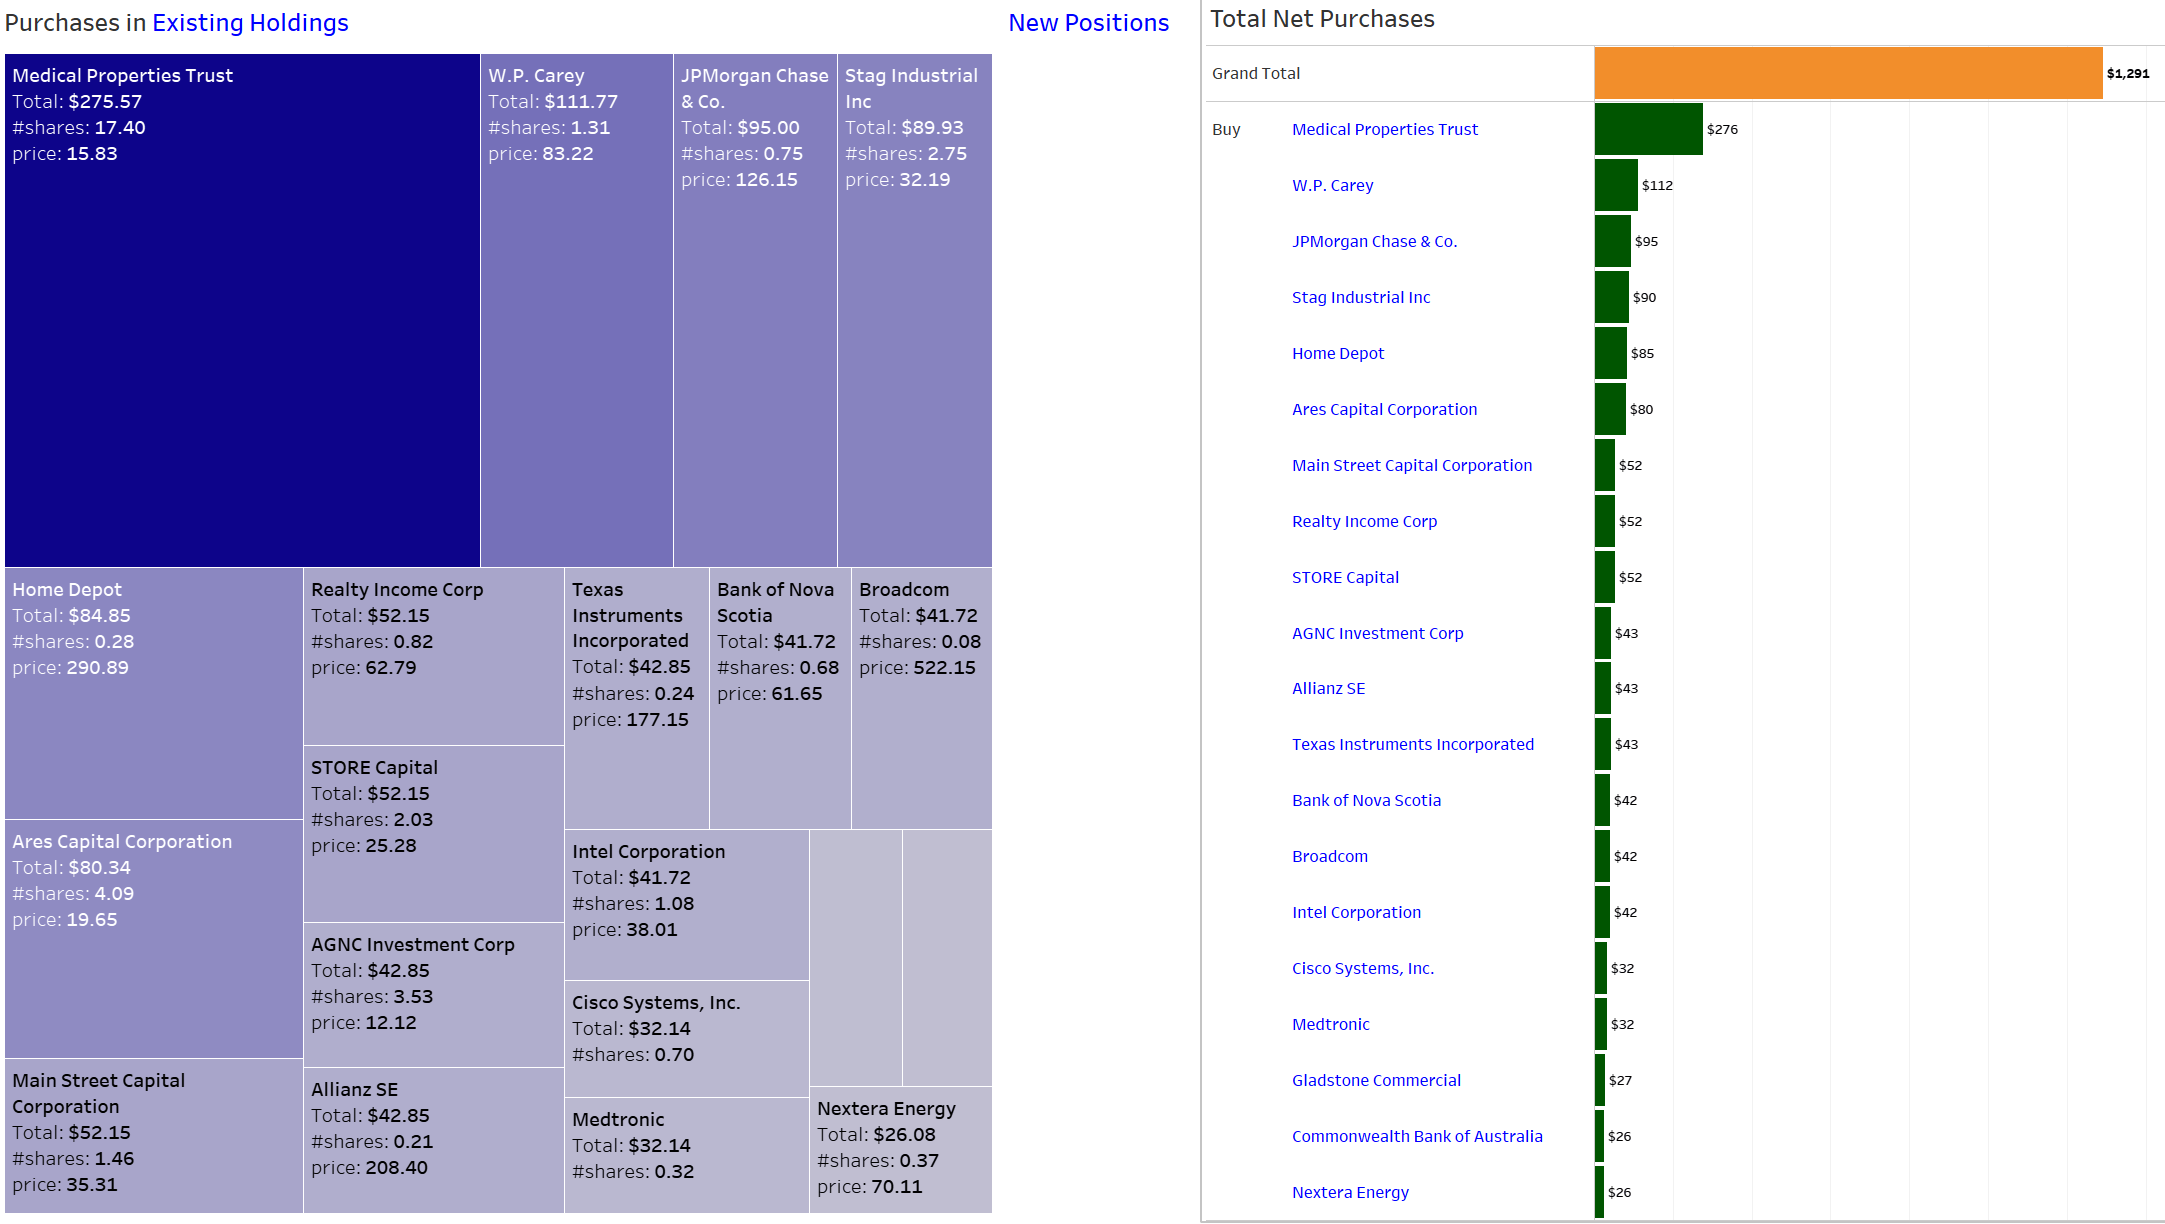
Dividend Income: What Happened on The Dividend Side?
Dividend income hit a new June record of $570 and is up an explosive 60% annually and down 1% sequentially. Adjusting for the semi-annual dividend payment of the Commonwealth Bank of Australia (OTCPK:CBAUF) in March 2022, dividend income is up 17% sequentially.
On an annual basis, the biggest income driver is the Ares Capital Corporation (ARCC), a stock I am running on a bi-weekly savings plan and where my contributions quickly translated into meaningful dividend income. The goal is to accumulate that position until it generates at least $100 in quarterly dividends which is a psychologically important level for me that no single stock has reached so far on a quarterly basis.
Dividend Income (Designed by Author)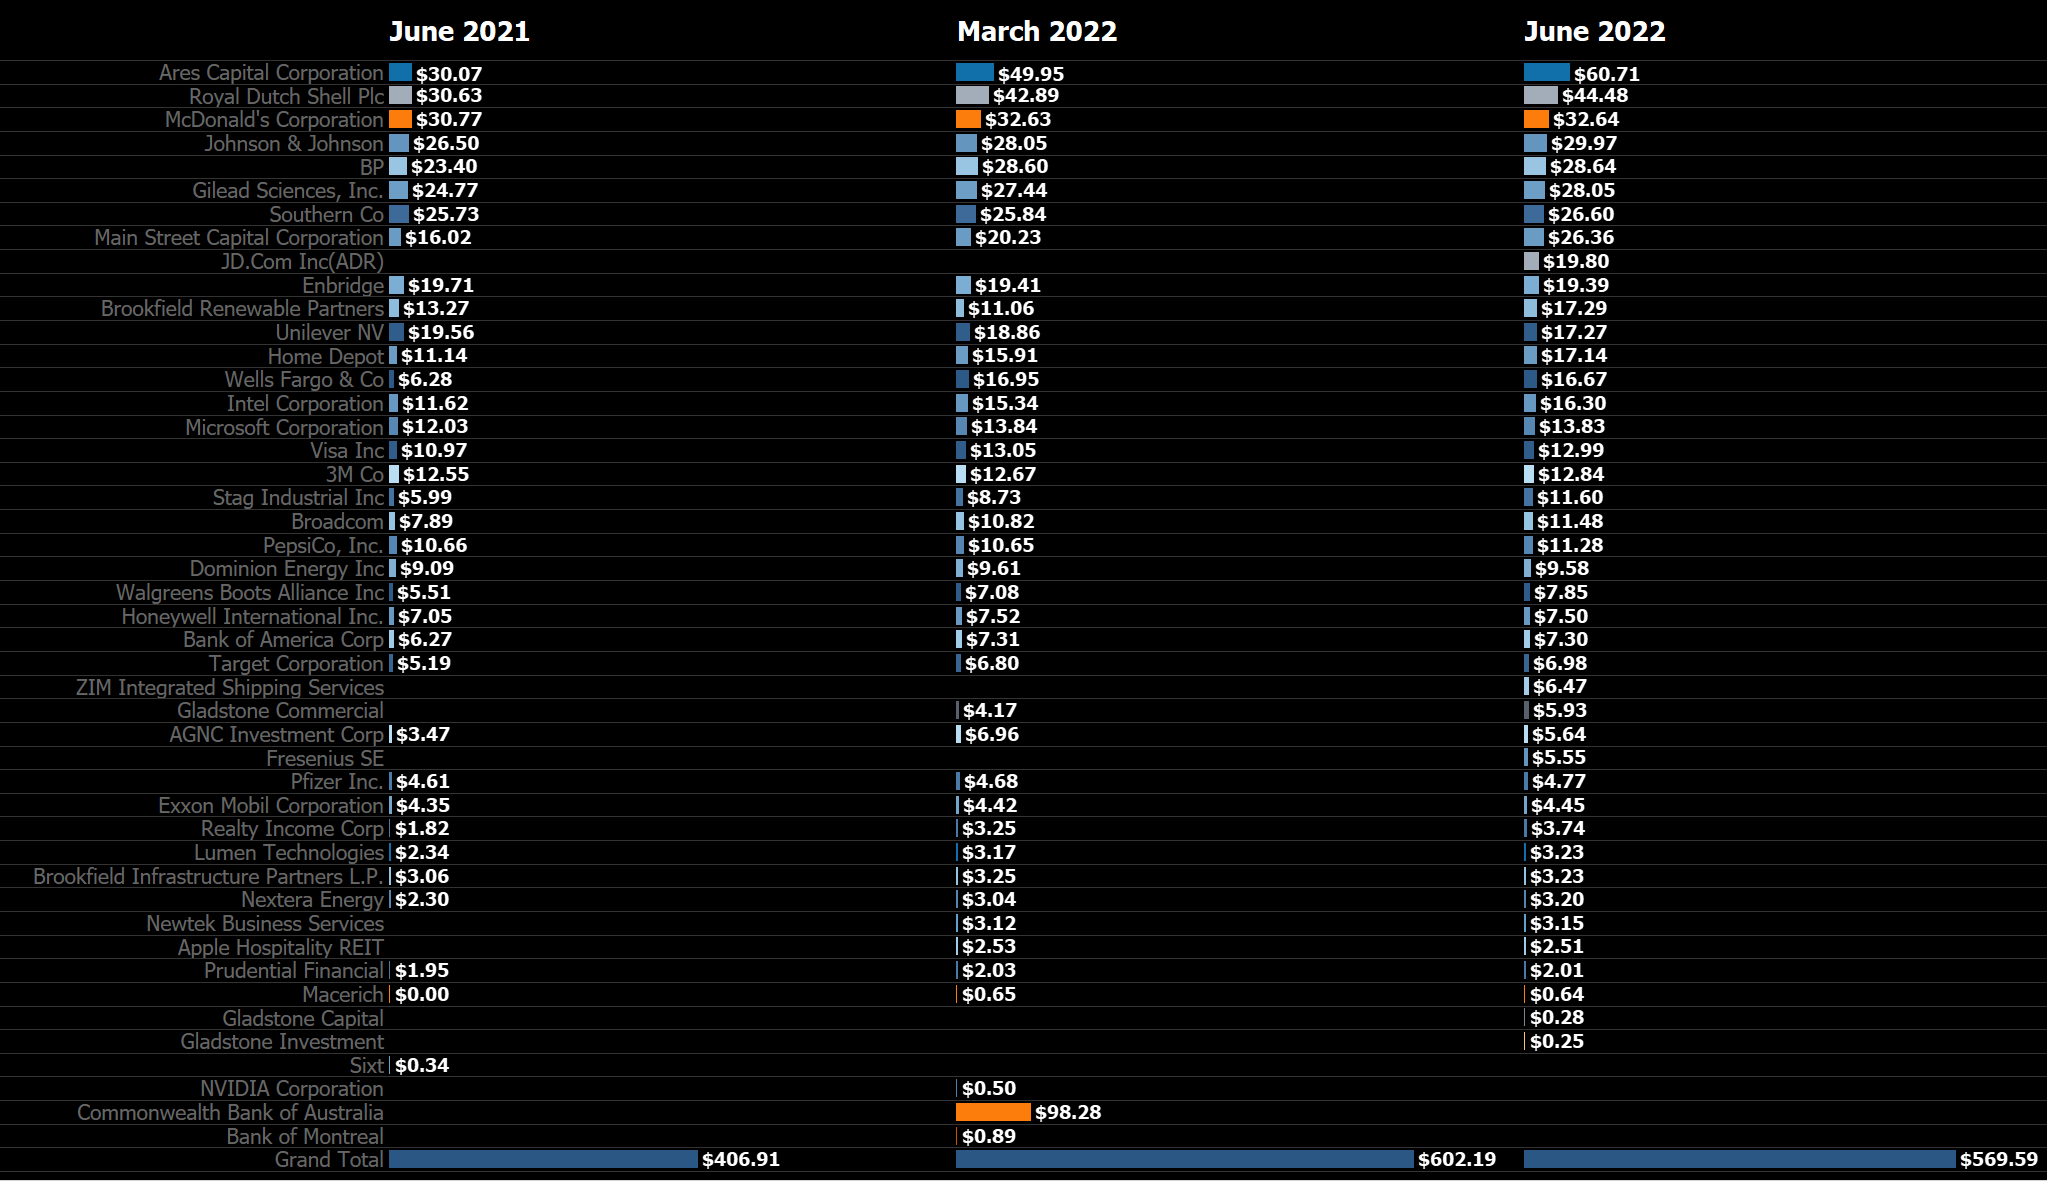
The growing share of ARCC dividends can also be seen when just looking at the top three dividend payers in March and other quarter-ending months. After two years where the average dividend from the top three 3 stocks didn’t reach past heights, March and June 2022 set new records with an average dividend from those three stocks together worth $132 on average on a 2022 YTD basis and amounting to a total of $137 for the June 2022 as seen below:
Top 3 Regular Dividend Payers (Designed by Author)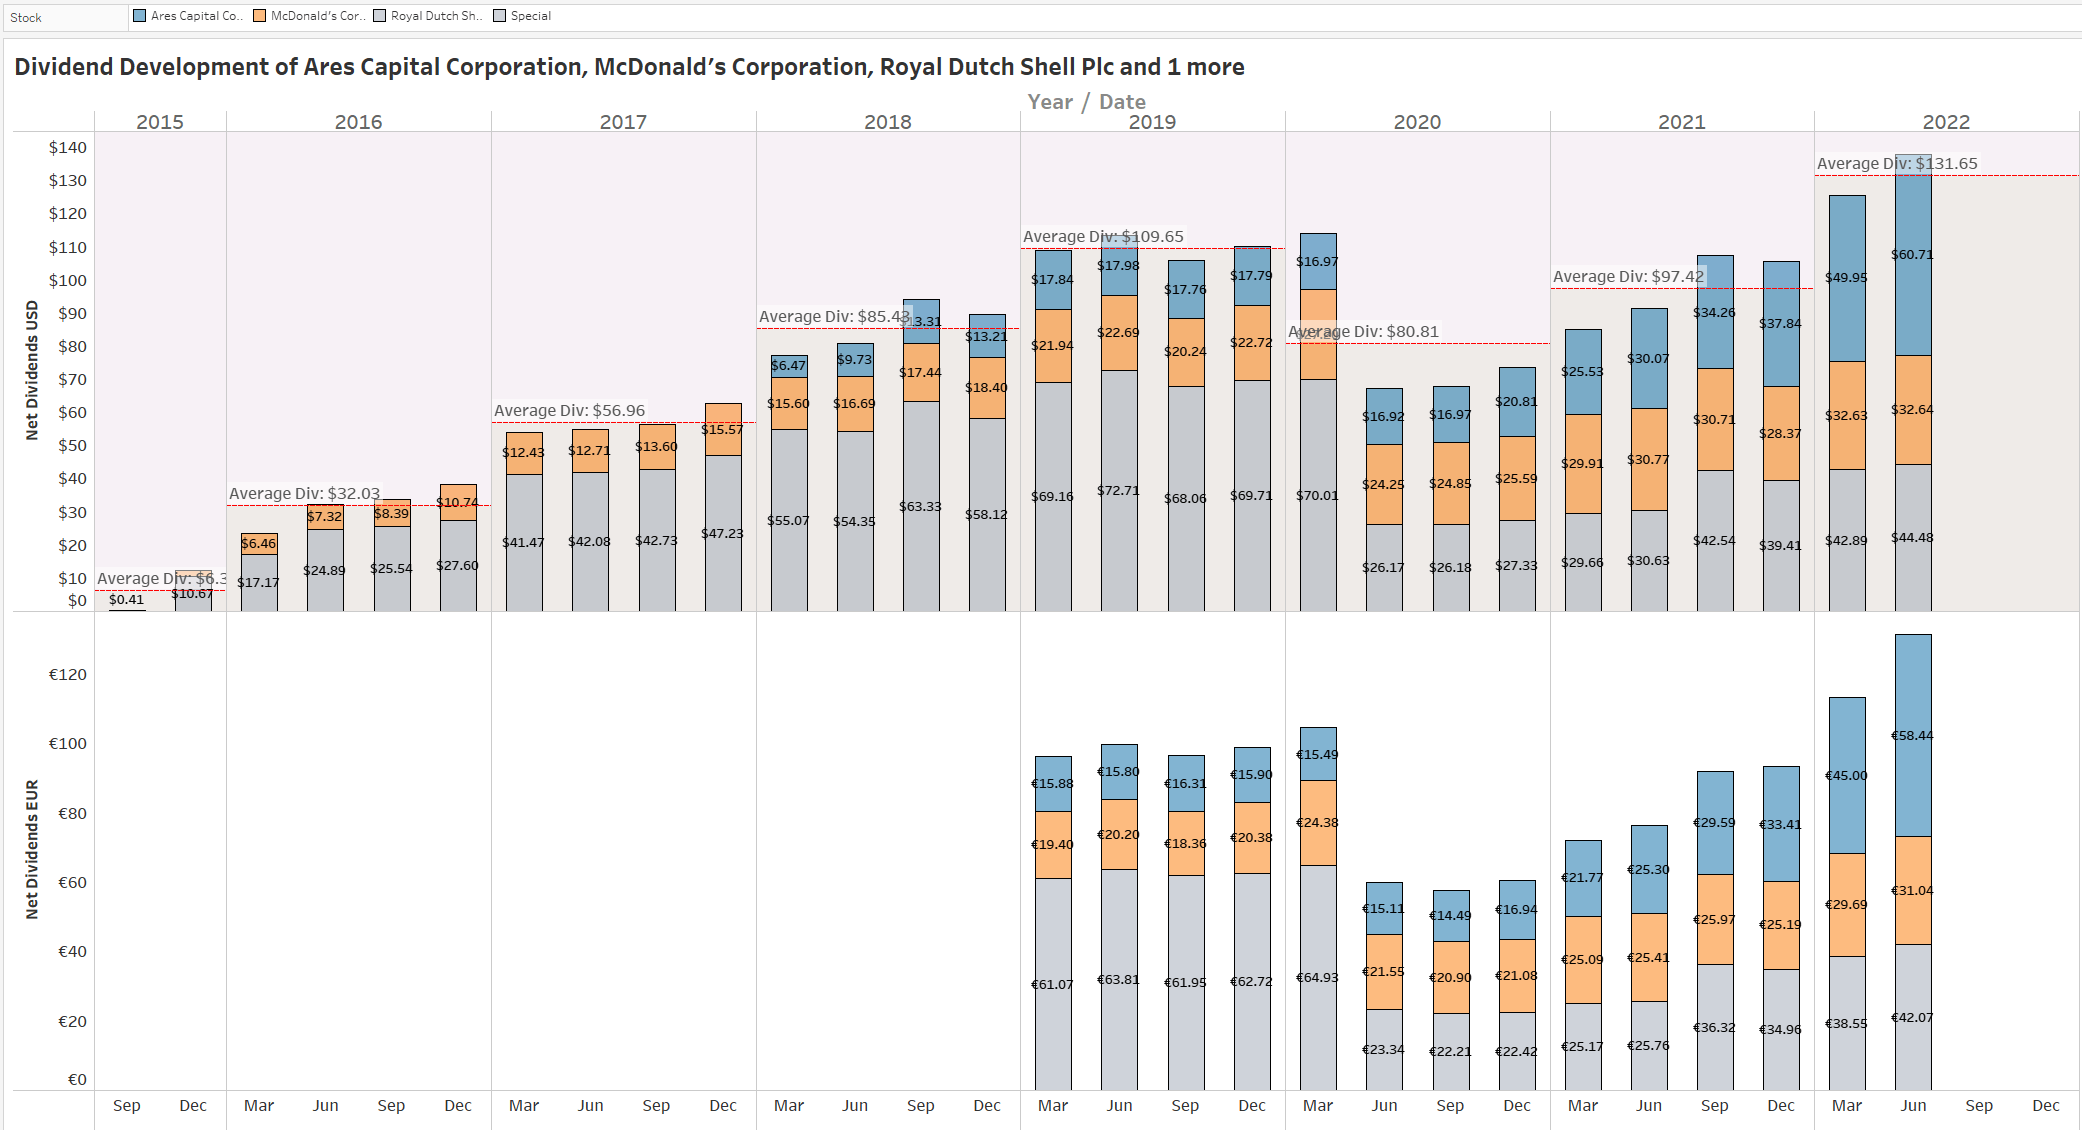
Here is a look at my favorite chart: the net dividend income development by month over time between 2015 and 2022, where you can easily see the development of my dividend income as well as the average annual dividend in a given year:
All-time Dividend Development (Designed by Author)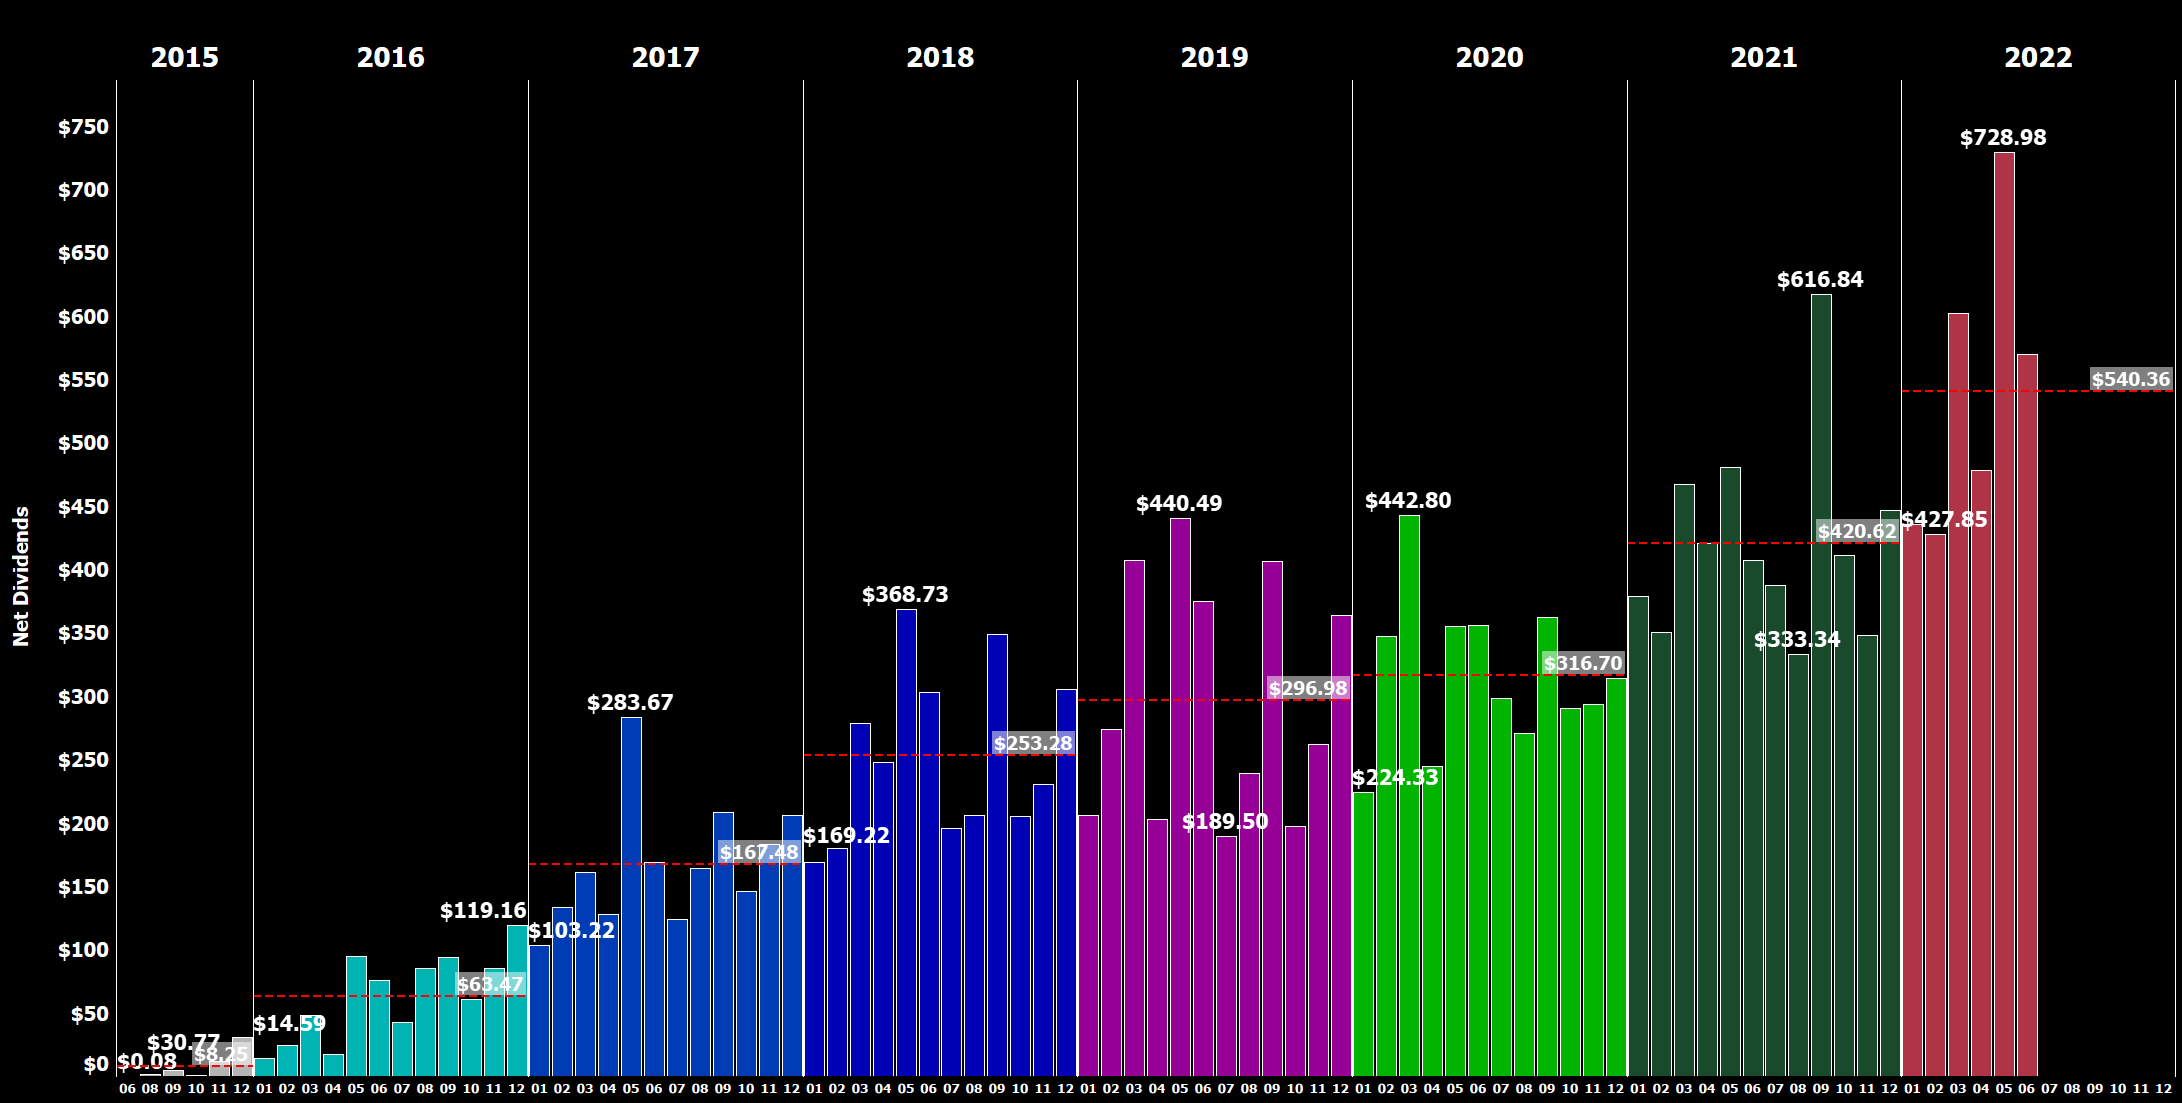
Next, I have scattered all the individual dividend payments I have ever received and colored them by year, rearranging the years side by side rather than horizontally as in previous updates:
Dividend Payment Bubbles (Designed by Author)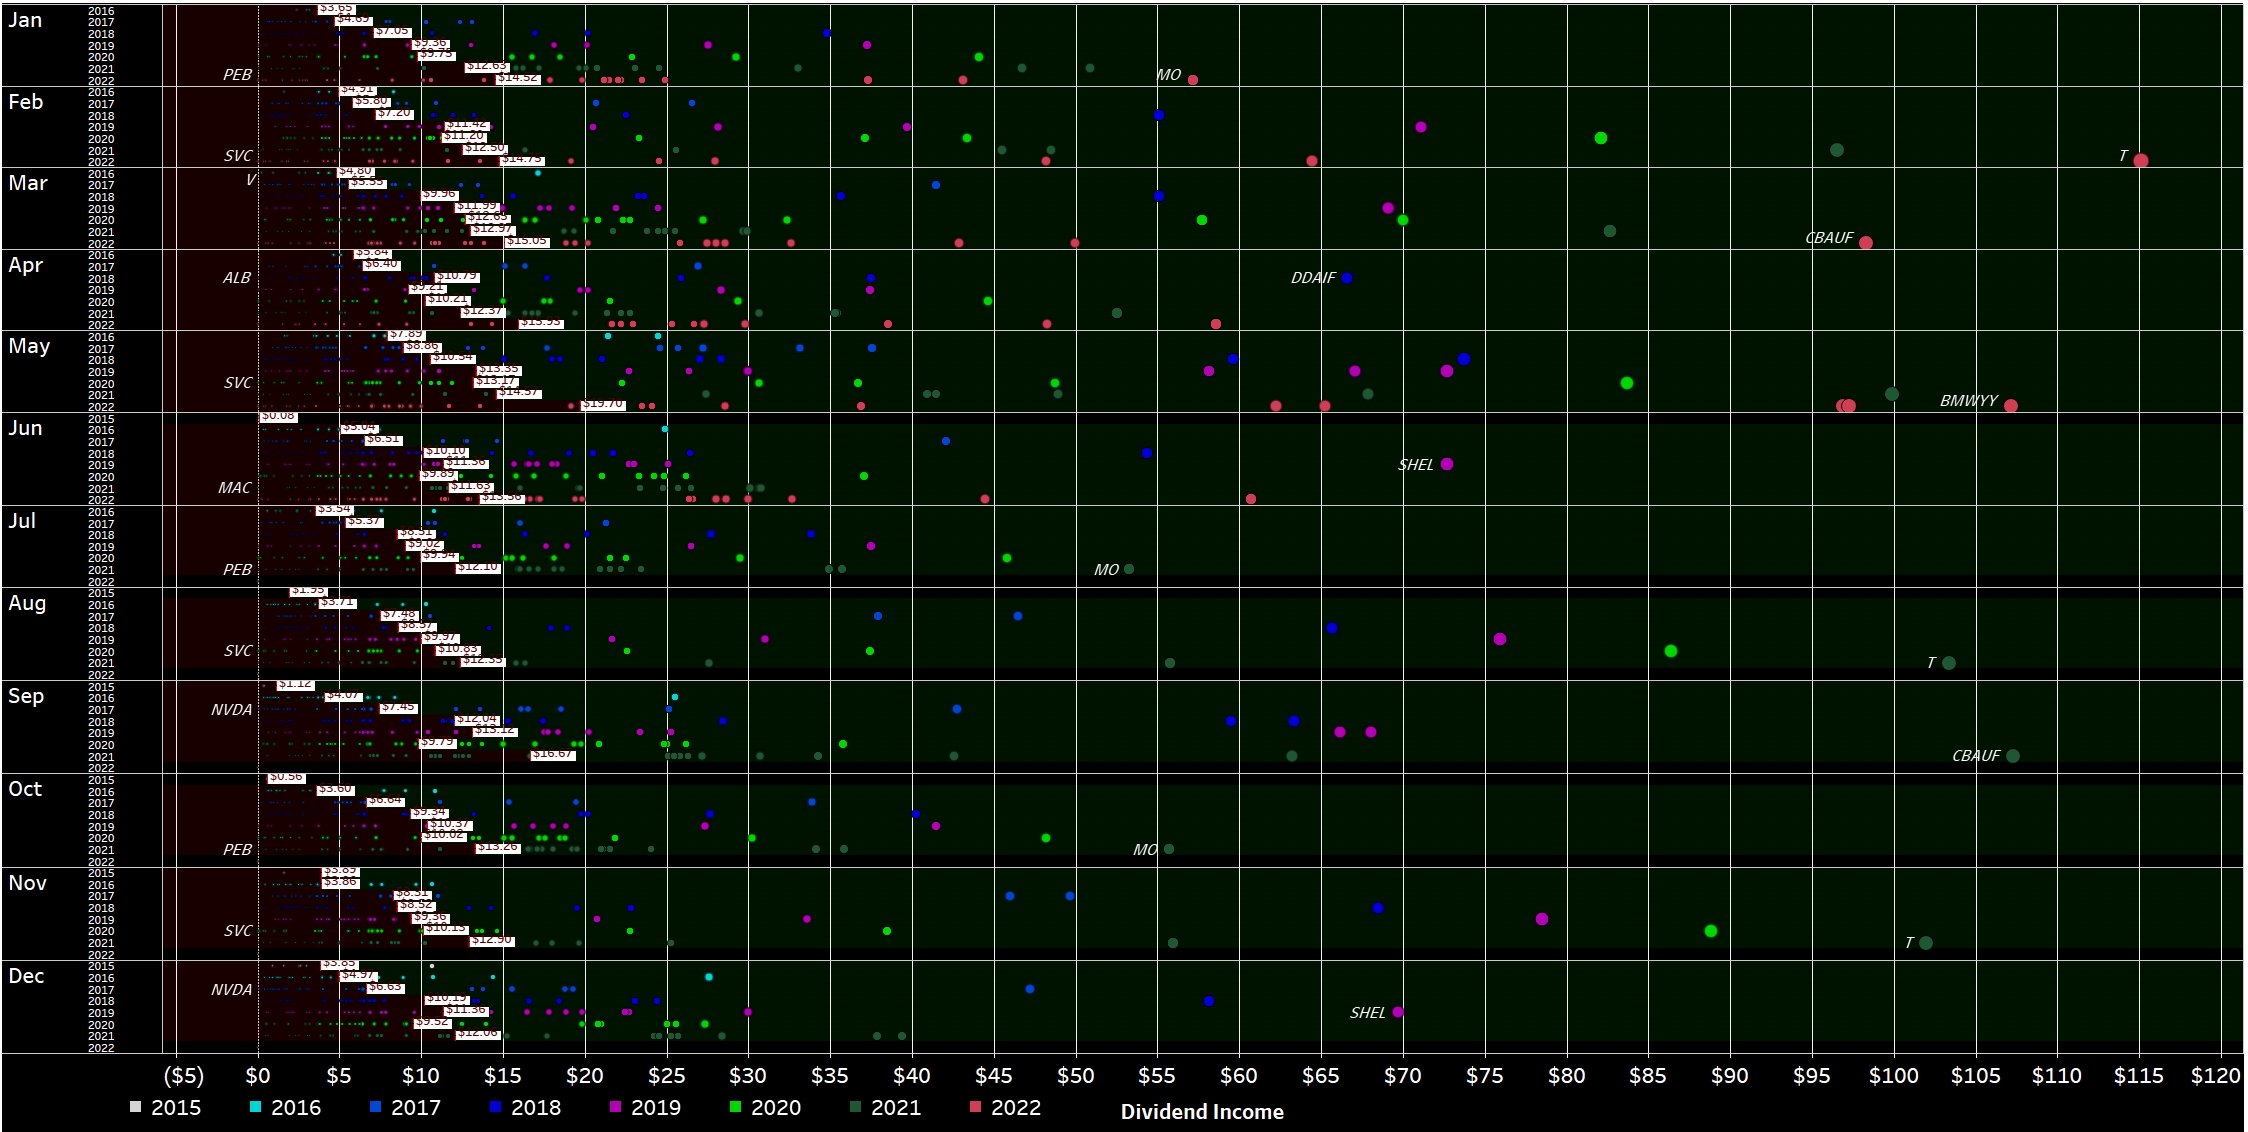
This view looks very cluttered at first, but it is very rich in information. It shows every single dividend payment I have received since I started my journey in 2015 in the shape of a circle colored differently by year and size, based upon their contribution. The view is broken down by month and by year (not by year and by month), and thus allows to better see the development over time. For every year of a certain month, a white rectangle indicates the average monthly dividend. The area where dividends fall below that average is filled dark red, whereas the area above is colored dark green. Personally, I absolutely love this redesigned view of my old “bubbles chart,” as it is much clearer to identify developments and trends in my dividend income.
June 2022 Dividends (Designed by Author)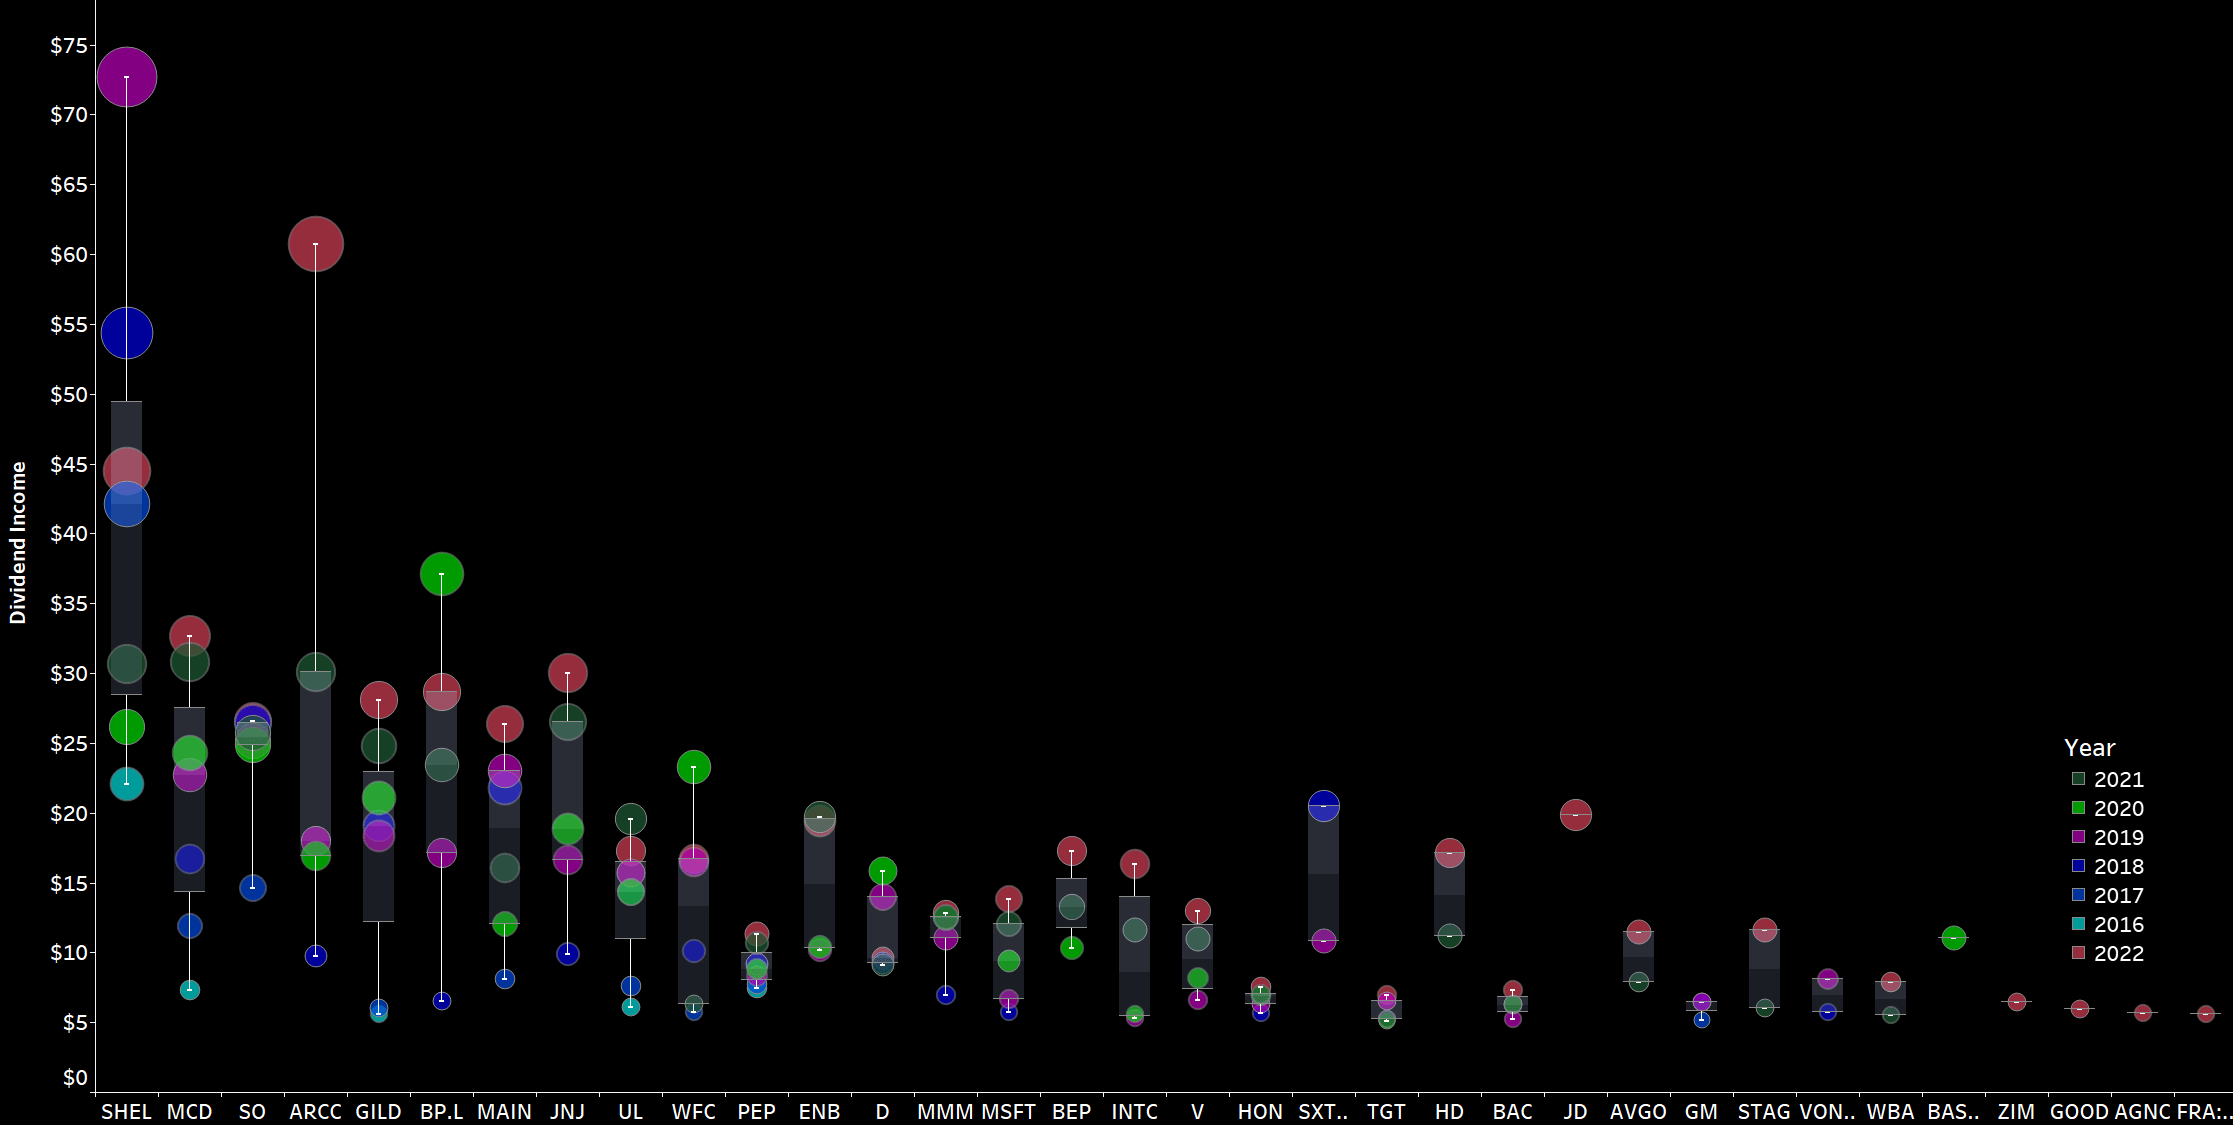
Now, zooming in on June, we can immediately see a number of big green circles in a sea of black. The bigger the circle and the bigger the distance to the previous circle for the same stock, the bigger is the change in dividend income compared to the prior years.
The biggest jump in annual dividend income is attributable to the Ares Capital Corporation which is driven exclusively by ongoing investments over the last 12 months. Regarding Shell (SHEL), we can easily see that despite the big dividend hike last year, dividend income still significantly trails the records set between 2017 and 2019 despite not having sold any shares. What’s more, we can also easily identify the big jump vs. 2020 as Shell is back on track of growing its dividend and, given very favorable macroeconomic conditions throughout the year, I do expect another significant bump in dividend income this year.
Another way to express the monthly dividend income is in terms of Gifted Working Time (GWT).
I am assuming an average hourly rate of $30.8 for 2022 here:
- In 2018, I generated 121 hours in GWT, equaling slightly more than $3,000 in annual net dividends.
- In 2019, I generated 142 hours in GWT, equaling almost $3,600 in annual net dividends.
- In 2020, I generated 152 hours in GWT, equaling roughly $3,800 in annual net dividends.
- In 2021, I generated 180 hours in GWT, equaling roughly $5,050 in annual net dividends.
- In 2022, I am targeting to reach at least $5,500 in annual net dividends, which equals roughly 179 hours in GWT. Despite the projected increase in annual net dividends I expect overall GWT to decrease following higher calculated hourly rates, a figure I project to rise by 10% given soaring inflation. The annual target of $5,500 is on the very cautious side as I need more visibility into how the year is progressing, particularly as I expect ongoing monthly investments to decline given elevated stock levels and rising inflationary and geopolitical pressures.
Across the years, the YTD Dividend Race as I like to call it looks as follows. While 2020 was fairly disappointing, 2021 was phenomenal as it benefited from a rather low baseline from the prior year. For 2022, I am targeting a conservative high single-digit growth rate for now, which is a very cautious estimate to begin with. YTD growth based on the first 6 months is shattering my expectations coming in at 29% Y/Y, and while I expect some moderation over the course of the year, solid double-digit growth in annual dividend income is almost guaranteed already for this year. At this stage it becomes more and more likely that not only will I easily meet my initial goal of $5,500 in net dividend income but in fact exceed the $6,000 milestone comfortably. That would equate to at least $500 in net dividends per month which is a big number for me and more than enough to for instance pay all the utility bills which are soaring due to the war in Ukraine and its repercussions.
YTD Dividend Growth (Designed by Author)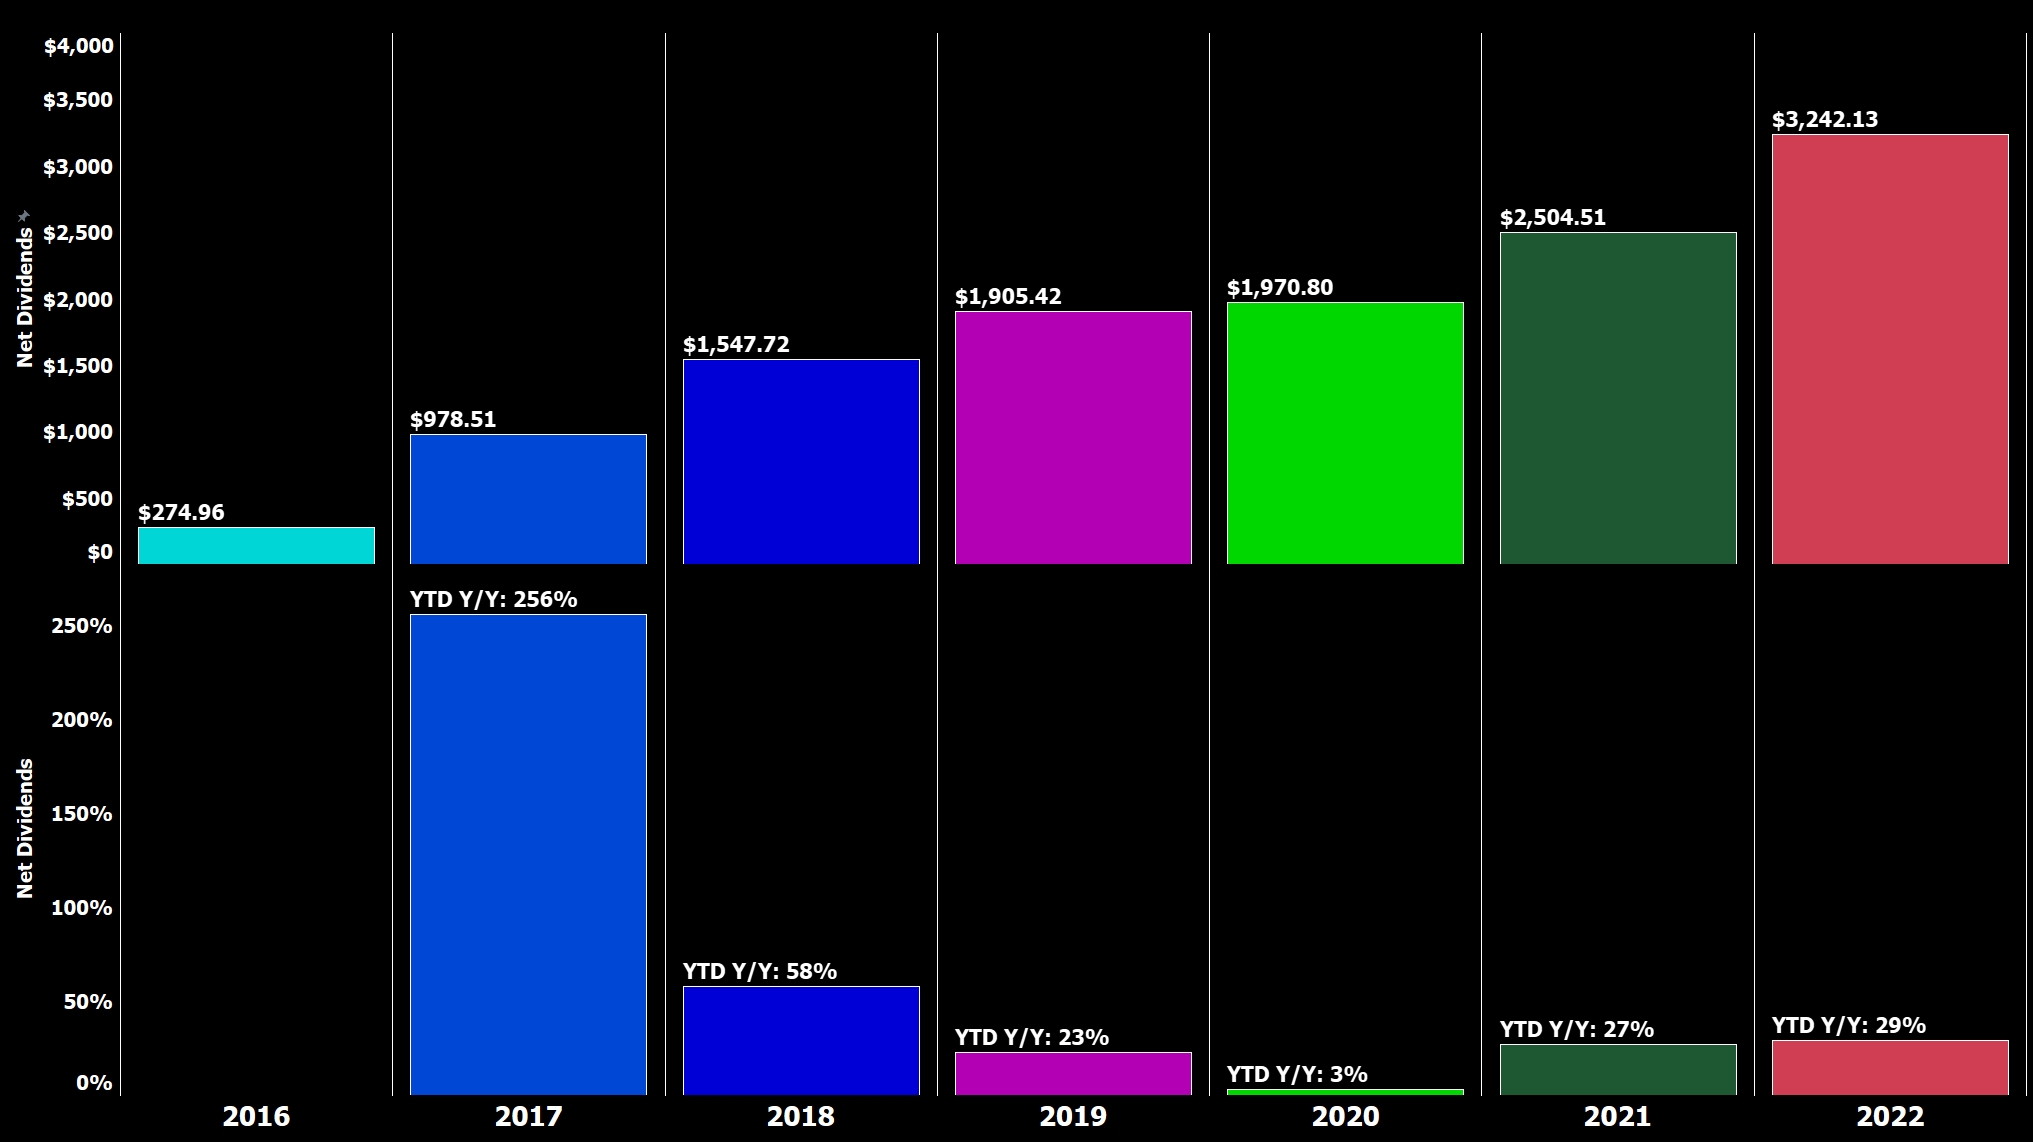
I have modified the YTD Dividend Race chart. Top left shows the YTD Dividend Race in the old format. At the top right, we can see how YTD dividend income developed on a daily basis and whereby we can easily identify that most of my dividend income is generated mid-month and towards the end of the month. At the bottom, that development is broken down by every individual month for the current year which makes big jumps clearly identifiable.
YTD Dividend Race (Designed by Author)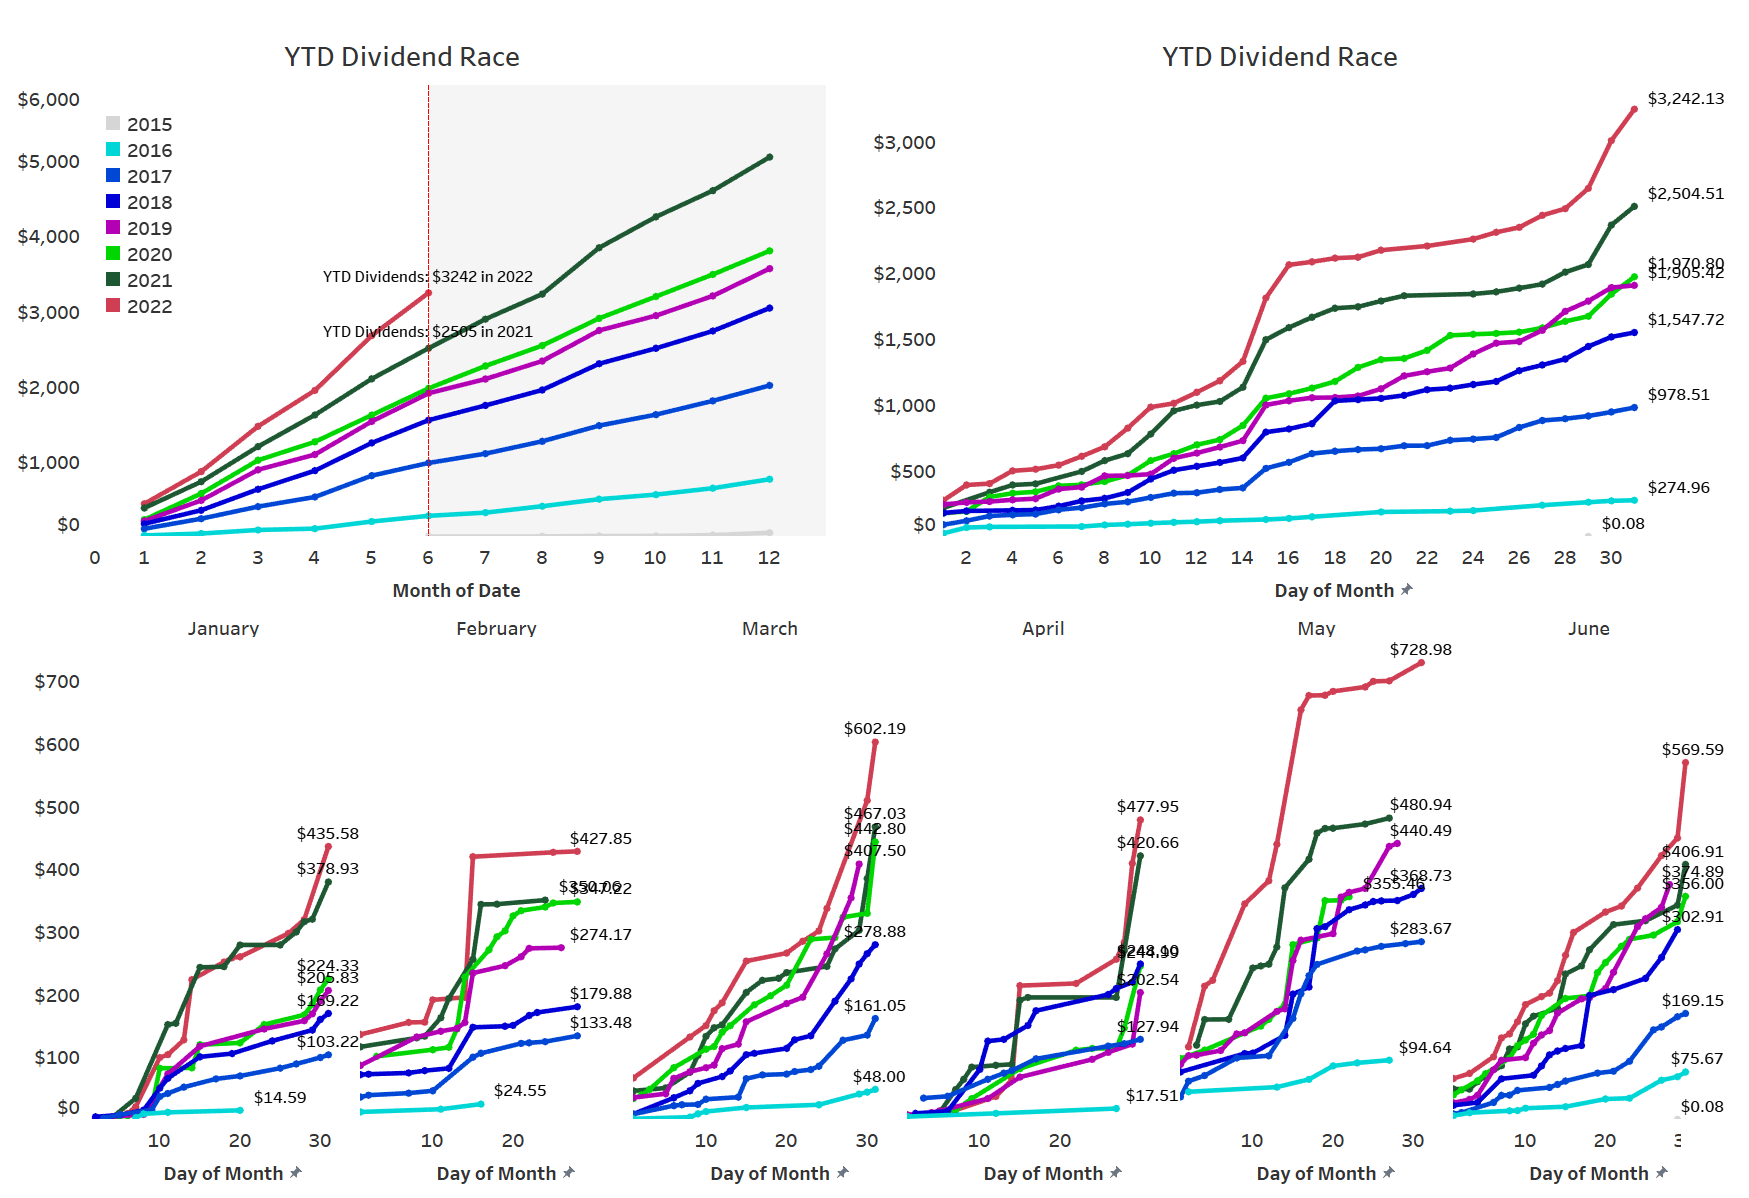
Expressed in GWT, it presents itself as follows:
Gifted Working Time (Designed by Author)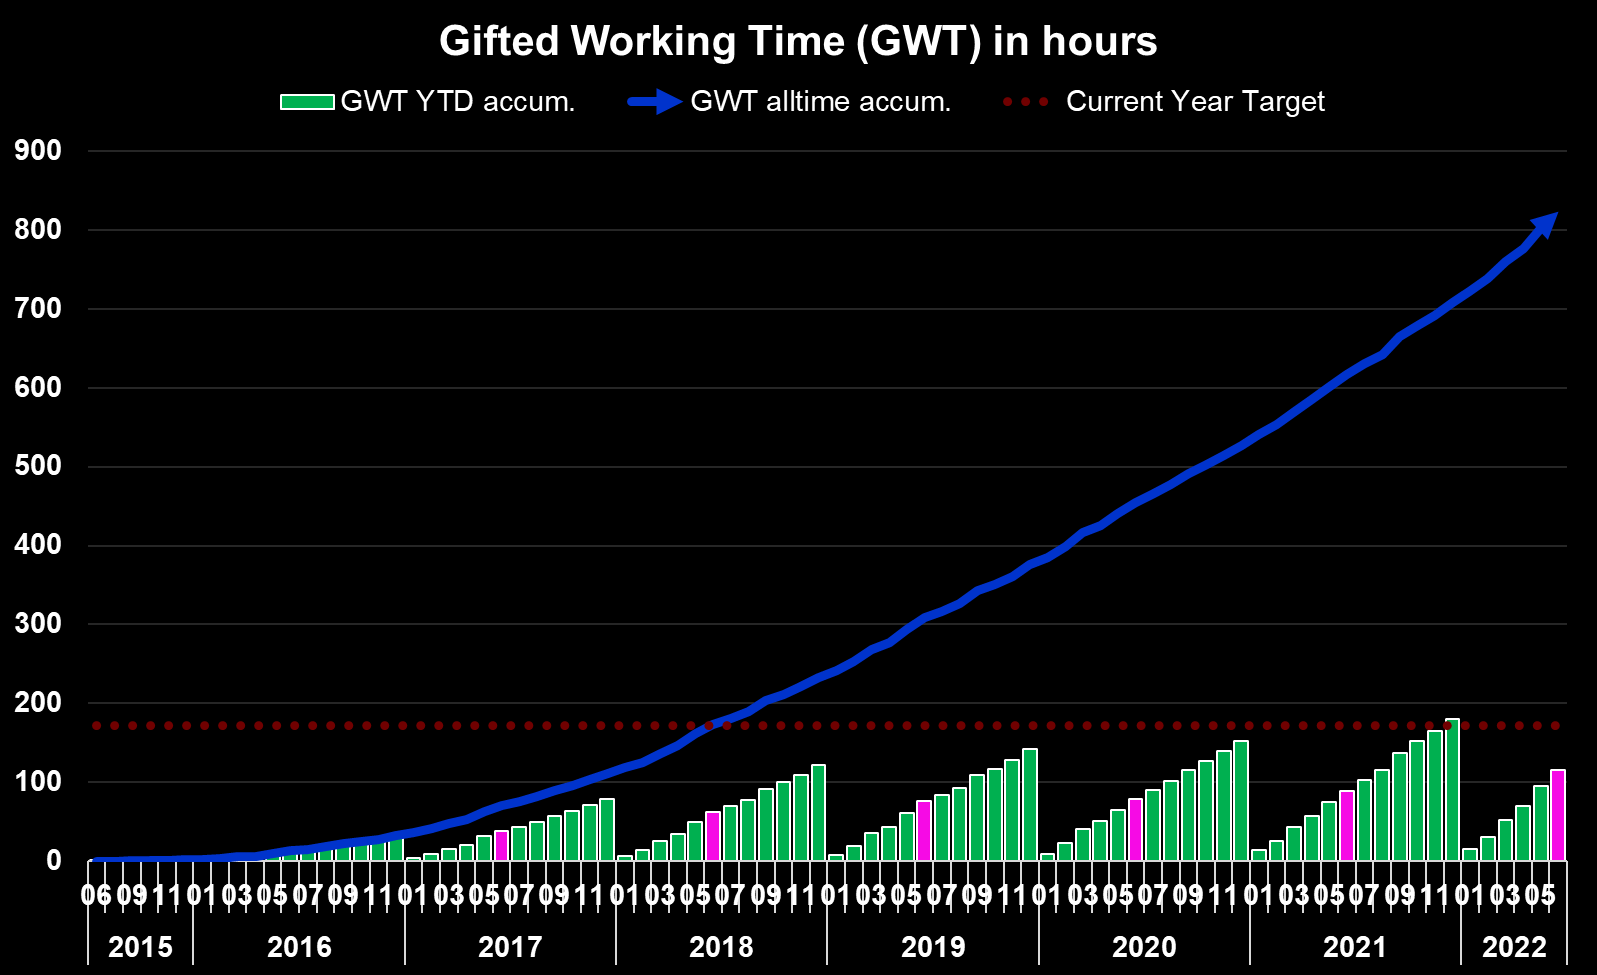
What this shows is as follows:
- All time (blue area) – Around 823 hours, or 103 days, of active work have been replaced with passive income since the start of my dividend journey. Assuming a five-day workweek this translates into more than 20 weeks of vacation funded via dividends.
- YTD (green bars) – Around 116 hours, or 14.5 days, of active work have been replaced with passive income in 2022 already, which equals almost 3 weeks’ worth of active work funded via dividends.
- Highlighted in pink is the accumulated YTD total at the end of the current reporting month (June).
Upcoming July Dividends
As every month, July is packed with dividend payments heavily concentrated around the 15th and at month-end when the dividend checks from Canada’s big banks as well as JPMorgan will be arriving over a period of just 3-4 days.
Given the majority of my savings plans feature companies that pay dividends in January such as W. P. Carey, Altria (MO), Cisco Systems (CSCO), JPMorgan, Toronto-Dominion Bank, Bank of Nova Scotia, Stryker (SYK), Medtronic (MDT) as well as ongoing investments into stocks like New Residential Investment Corp. (NRZ) and Annaly Capital (NLY), it surely is going to be a big month that should easily set a new all-time dividend record for the month of July.
The snapshot below is taken from my newly and free-for-all released Dividend Calendar (make sure to follow instructions in the video) and shows my expected dividend payments in July.
My Dividend Calendar (Designed by Author)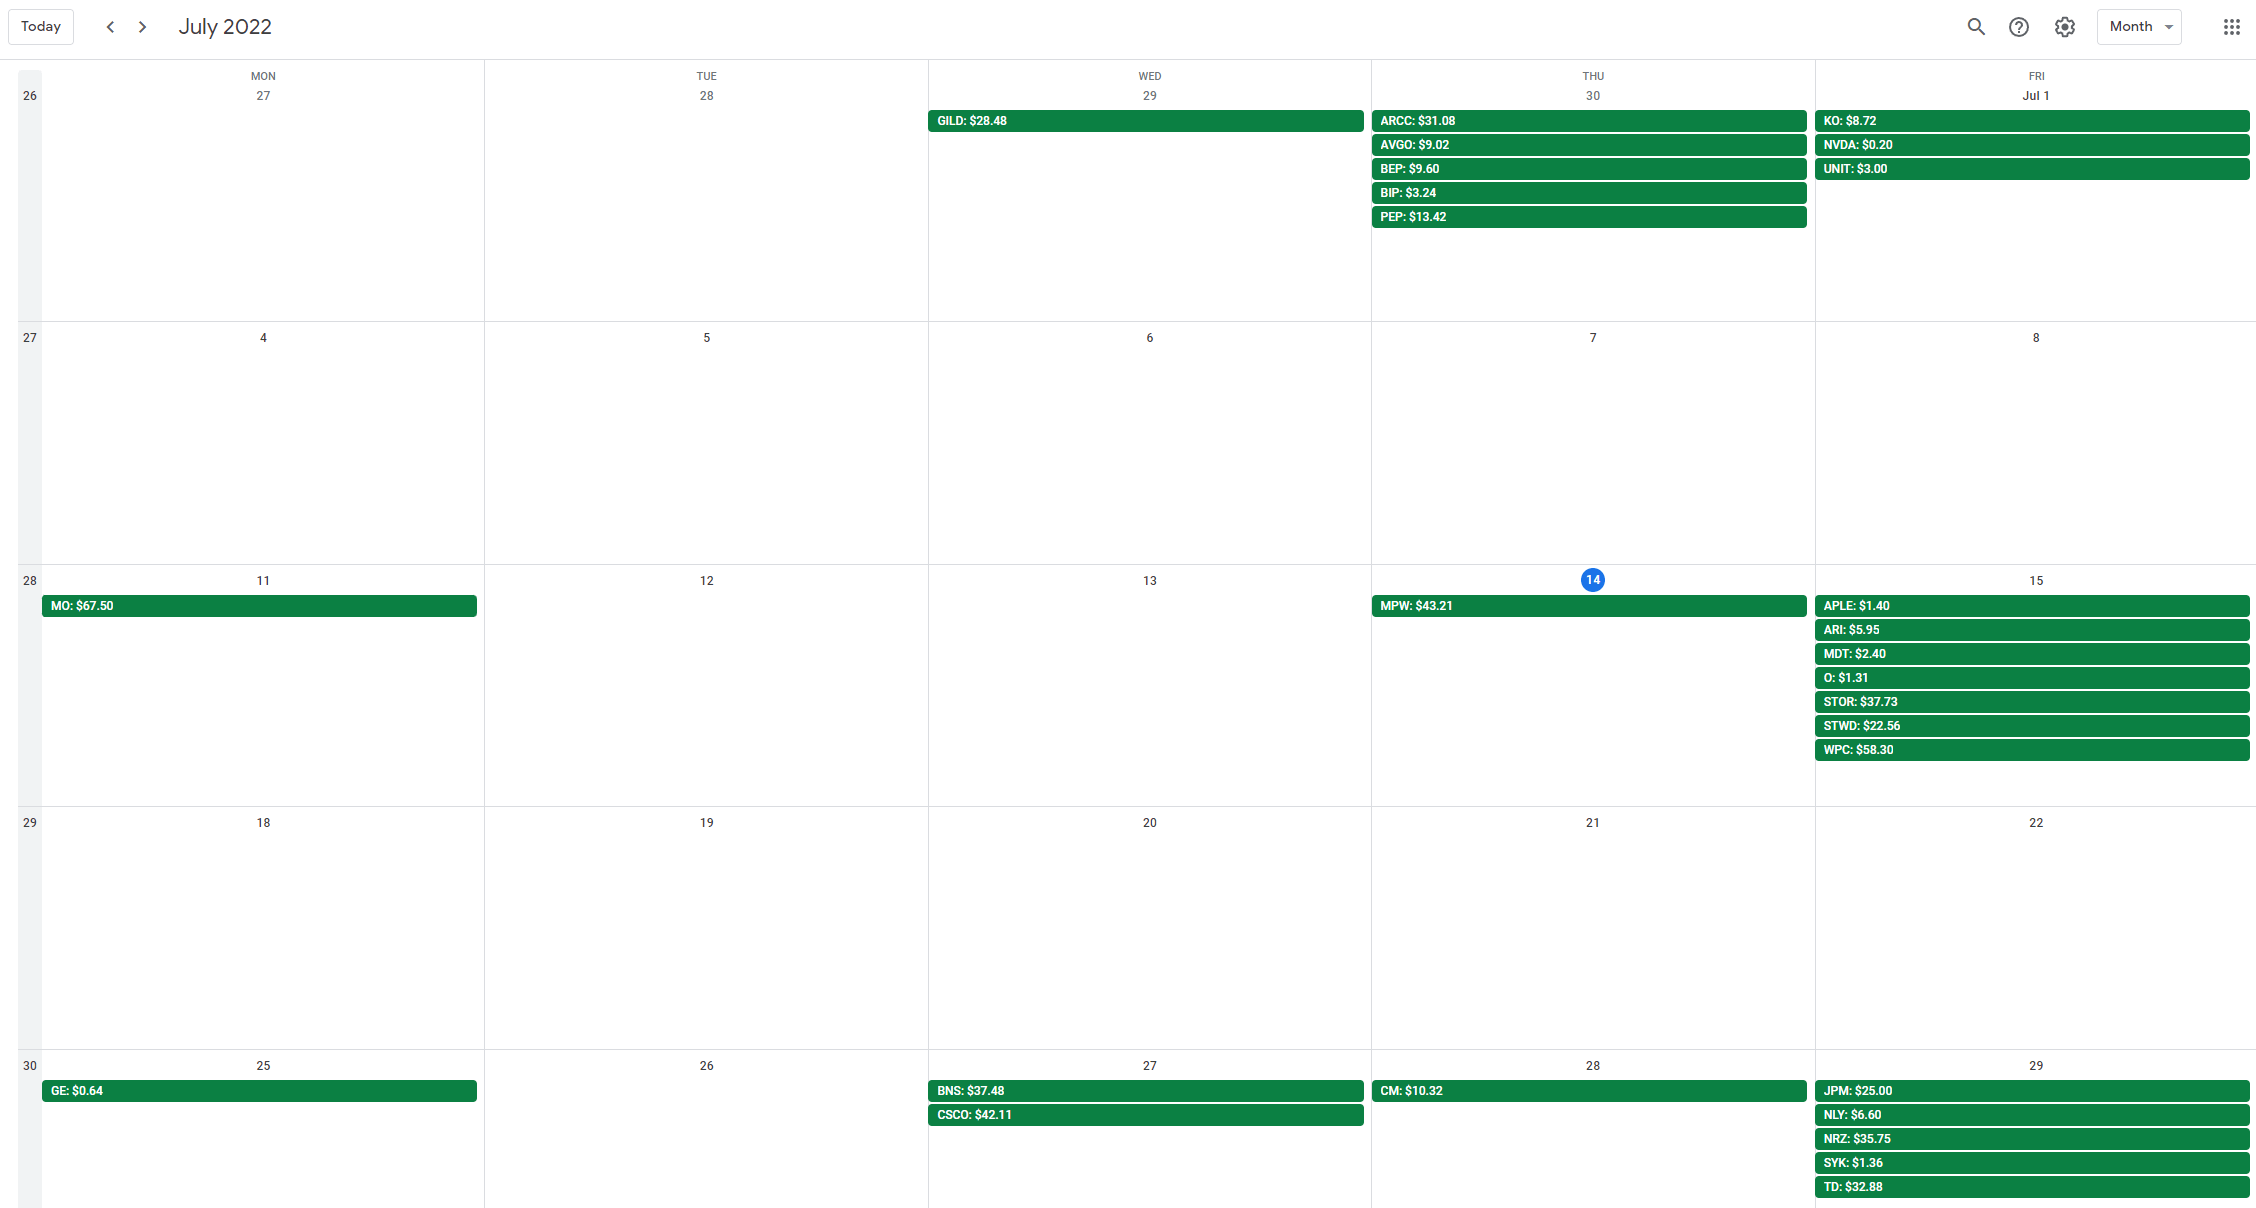
At the end of June, my dividend portfolio is composed as follows:
| Company Name | Ticker | % Market Value | Market Value (€) |
| Apple Inc. | (AAPL) | 11.88% | 21,942 |
| Visa Inc | (V) | 4.51% | 8,325 |
| AbbVie Inc | (ABBV) | 4.33% | 8,000 |
| McDonald’s Corp | (MCD) | 3.77% | 6,968 |
| Microsoft Corporation | (MSFT) | 3.54% | 6,540 |
| Johnson & Johnson | (JNJ) | 2.92% | 5,390 |
| AT&T Inc. | (T) | 2.85% | 5,262 |
| Cisco Systems, Inc. | (CSCO) | 2.72% | 5,031 |
| W.P. Carey | (WPC) | 2.45% | 4,521 |
| Commonwealth Bank of Australia | (OTCPK:CBAUF) | 2.32% | 4,292 |
| Main Street Capital Corporation | (MAIN) | 2.26% | 4,170 |
| Southern Co | (SO) | 1.98% | 3,653 |
| Shell | (SHEL) | 1.89% | 3,485 |
| STAG Industrial Inc | (STAG) | 1.79% | 3,313 |
| Texas Instruments Incorporated | (TXN) | 1.76% | 3,248 |
| Altria Group Inc | (MO) | 1.68% | 3,106 |
| Home Depot | (HD) | 1.65% | 3,049 |
| Wells Fargo & Co | (WFC) | 1.62% | 2,986 |
| Toronto-Dominion Bank | (TD) | 1.55% | 2,867 |
| JPMorgan Chase & Co. | (JPM) | 1.55% | 2,864 |
| Ares Capital Corporation | (ARCC) | 1.52% | 2,817 |
| Gilead Sciences, Inc. | (GILD) | 1.47% | 2,723 |
| STORE Capital | (STOR) | 1.42% | 2,618 |
| Bank of Nova Scotia | (BNS) | 1.41% | 2,613 |
| Medical Properties Trust | (MPW) | 1.39% | 2,574 |
| NVIDIA Corporation | (NVDA) | 1.35% | 2,501 |
| Siemens Healthineers | (OTCPK:SEMHF) | 1.22% | 2,250 |
| Intel Corporation | (INTC) | 1.08% | 1,987 |
| PepsiCo, Inc. | (PEP) | 1.08% | 1,987 |
| Sino AG | (XTP.F) | 1.05% | 1,947 |
| Allianz SE | (OTCPK:ALIZF) | 1.05% | 1,933 |
| Procter & Gamble Co | (PG) | 1.01% | 1,871 |
| Blackstone Group LP | (BX) | 0.97% | 1,785 |
| Morgan Stanley | (MS) | 0.93% | 1,717 |
| BMW | (OTCPK:BMWYY) | 0.88% | 1,618 |
| Enbridge | (ENB) | 0.84% | 1,555 |
| Philip Morris International Inc. | (PM) | 0.84% | 1,553 |
| Brookfield Renewable Partners | (BEP) | 0.84% | 1,544 |
| Broadcom Inc | (AVGO) | 0.83% | 1,538 |
| Bank of America Corp | (BAC) | 0.73% | 1,354 |
| Honeywell International Inc. | (HON) | 0.73% | 1,352 |
| New Residential Corporation | (NRZ) | 0.72% | 1,339 |
| 3M Co | (MMM) | 0.69% | 1,275 |
| Daimler | (OTCPK:DDAIF) | 0.67% | 1,240 |
| The Coca-Cola Co | (KO) | 0.66% | 1,226 |
| BP1 | (BP) | 0.66% | 1,214 |
| Dominion Energy Inc | (D) | 0.64% | 1,176 |
| Target Corporation | (TGT) | 0.63% | 1,165 |
| B&G Foods, Inc. | (BGS) | 0.61% | 1,130 |
| BP2 | (BP) | 0.61% | 1,126 |
| Realty Income Corp | (O) | 0.60% | 1,106 |
| Verizon Communications Inc. | (VZ) | 0.59% | 1,086 |
| NextEra Energy Partners LP | (NEP) | 0.56% | 1,033 |
| Unilever NV ADR | (UL) | 0.55% | 1,007 |
| Gladstone Commercial Corporation | (GOOD) | 0.54% | 999 |
| Starwood Property Trust, Inc. | (STWD) | 0.53% | 986 |
| Royal Bank of Canada | (RY) | 0.50% | 918 |
| Apple Hospitality REIT | (APLE) | 0.49% | 909 |
| CVS Health Corp | (CVS) | 0.49% | 903 |
| Stryker | (SYK) | 0.41% | 750 |
| Canadian Imperial Bank of Commerce | (CM) | 0.39% | 722 |
| Pfizer Inc. | (PFE) | 0.39% | 718 |
| Walgreens Boots Alliance Inc | (WBA) | 0.37% | 688 |
| AGNC Investment Corporation | (AGNC) | 0.36% | 673 |
| NextEra Energy | (NEE) | 0.36% | 663 |
| Medtronic | (MDT) | 0.35% | 650 |
| BASF | (OTCQX:BASFY) | 0.31% | 568 |
| Alibaba Group Holding Ltd | (BABA) | 0.28% | 516 |
| Antero Midstream Corporation | (AM) | 0.27% | 505 |
| Kinder Morgan Inc | (KMI) | 0.27% | 493 |
| Exxon Mobil Corporation | (XOM) | 0.26% | 487 |
| Walt Disney Co | (DIS) | 0.25% | 458 |
| General Electric Company | (GE) | 0.23% | 426 |
| Annaly Capital Management | (NLY) | 0.23% | 417 |
| SIXT | (OTC:SXTSY) | 0.22% | 402 |
| Colgate-Palmolive Company | (CL) | 0.21% | 389 |
| BRT Realty Trust | (BRT) | 0.20% | 373 |
| Enterprise Products Partners L.P. | (EPD) | 0.20% | 365 |
| Omega Healthcare Investors Inc | (OHI) | 0.19% | 356 |
| Mastercard | (MA) | 0.19% | 345 |
| Bayer AG | (OTCPK:BAYZF) | 0.18% | 324 |
| MPLX LP | (MPLX) | 0.17% | 318 |
| Energy Transfer Partners | (ET) | 0.16% | 297 |
| Brookfield Infrastructure Partners L.P. | (BIP) | 0.12% | 224 |
| Apollo Commercial Real Est. Finance Inc | (ARI) | 0.12% | 218 |
| Apollo Investment | (AINV) | 0.11% | 210 |
| Uniti Group Inc | (UNIT) | 0.10% | 184 |
| Prudential Financial | (PRU) | 0.10% | 181 |
| Vonovia | (OTCPK:VONOY) | 0.10% | 180 |
| Lumen Technologies | (LUMN) | 0.09% | 159 |
| Fresenius SE | (OTCPK:FSNUF) | 0.08% | 156 |
| Boeing | (BA) | 0.06% | 107 |
| Newtek Business Services | (NEWT) | 0.05% | 96 |
| Equitrans Midstream Corporation | (ETRN) | 0.05% | 93 |
| Bank of Montreal | (BMO) | 0.05% | 91 |
| Fresenius Medical Care | (FMS) | 0.05% | 91 |
| Diversified Healthcare Trust | (DHC) | 0.04% | 73 |
| The GEO Group Inc | (GEO) | 0.02% | 44 |
| Service Properties Trust | (SVC) | 0.02% | 31 |
| Macquarie Infrastructure Corp | (MIC) | 0.01% | 20 |
Be the first to comment