


Galeanu Mihai/iStock via Getty Images
In December of 2021, I authored an article providing my top five picks for 2022. In a recent article, I noted the outperformance of those stocks (on average they beat the S&P by about 14%.)
Two of those names rank among my top ten picks for 2023. In this piece I provide an overview of the remaining eight picks among my top ten.
Alpine Income Property Trust (PINE)
PINE is a small-cap net-lease REIT. With 146 properties in 35 states, PINE reported a 100% occupancy rate last quarter. Only 12% of leases rollover between now and the end of 2026, and PINE’s portfolio has 7.6 years of weighted average lease term remaining.
When PINE went public in 2019, 43% of Annualized Base Rent (ABR) was generated by office properties. Today 0% of ABR is from office spaces. The REIT’s top 10 tenants include retail stalwarts Walgreens, Dick’s Sporting Goods, Dollar Tree/Family Dollar, Lowes, Dollar General, Walmart, and Best Buy.
More than half of ABR is generated from the high-growth markets of Houston, Atlanta, Dallas and Tampa.
PINE trades at a significant discount compared to its peers, implying substantial valuation upside.
PINE dividend increased 37.5% since the beginning of 2020 with seven dividend raises since the IPO and six increases in the last two years.
The yield of 5.77% is one of the highest of its net lease peer group, and PINE has one of the lowest implied payout ratios. The midpoint of 2022 guidance has the payout ratio at 63% of 2022 estimated FFO per share.
PINE has no debt maturities until May 2026.
I’ve been building a position in PINE over the last month and rate the REIT as a BUY.
Essential Properties Realty Trust, Inc. (EPRT)
EPRT has a great deal in common with PINE. Both are net lease REITs. EPRT went public a year before PINE’s IPO.
EPRT has 100% of properties under lease, and the REIT’s weighted average lease term is 13.8 years.
The firm has a solid financial profile with an average interest rate of 2.9% and a weighted average debt maturity of 5.7 years. There are no debt maturities before 2024. EPRT’s debt to EBITDA is only 4.4x. Management guides for 4.5x to 5.5x EBITDA as the company’s target.
EPRT focuses on service oriented and experience based industries. This means most of the REIT’s clients are e-commerce resistant businesses.
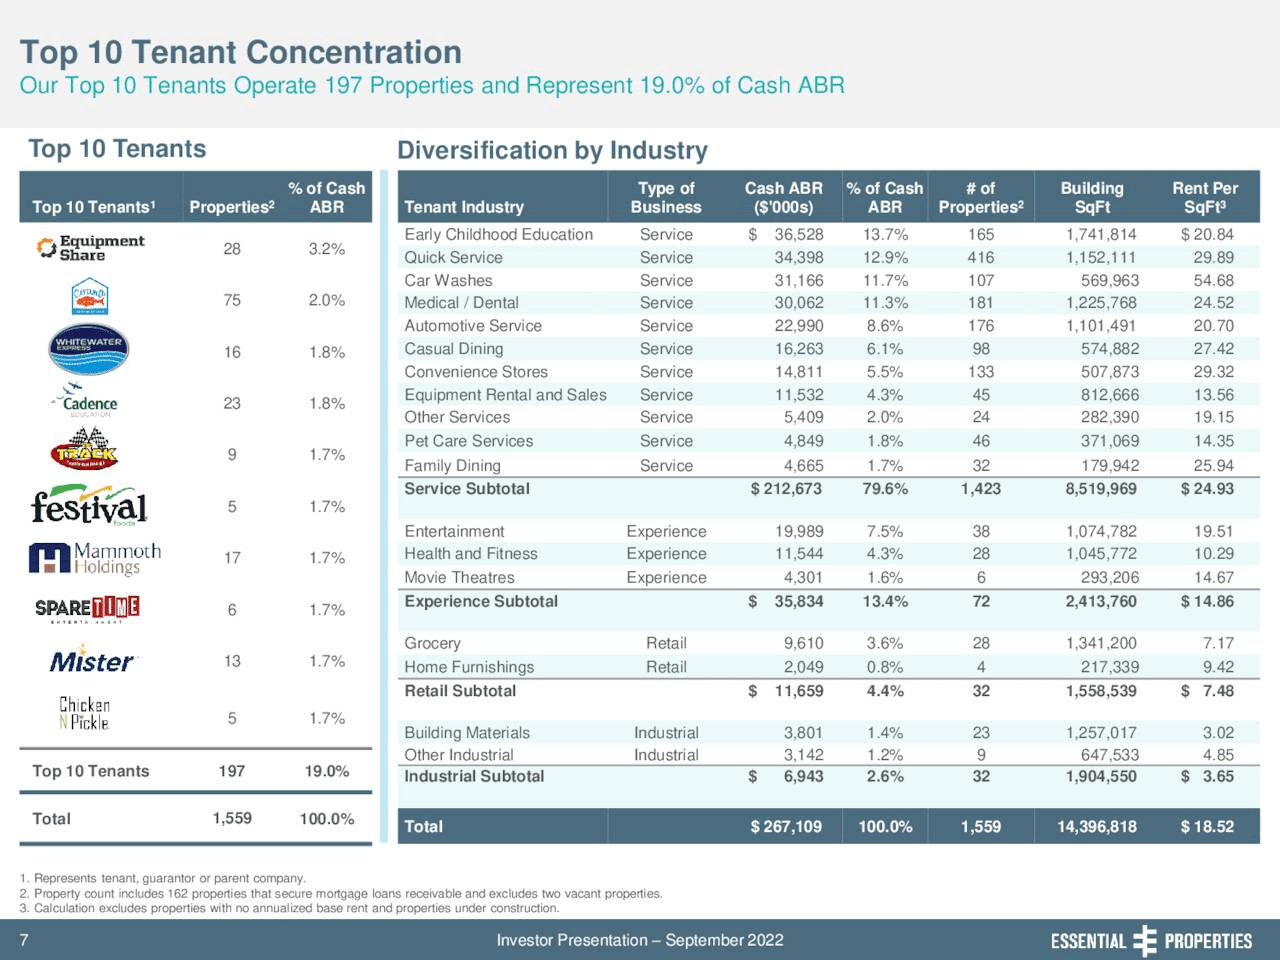
EPRT investor presentation
The top ten tenants represent 19% of ABR.
The company has annual rent escalators of 1.5% built into nearly 80% of leases.
The current yield is 4.74%. The REIT first began paying a $0.22 per quarter dividend in September of 2018. Over the last nine months, the dividend has been raised by $0.01 every other quarter for over two years. The forward AFFO payout ratio is approximately 71%.
I have a small position in EPRT and rate the stock as a BUY.
National Storage Affiliates Trust (NSA)
NSA is the third and last REIT on my list.
With 1,100 properties totaling 71.5 million square feet, National Storage is a self storage facility operator with a unique business model.
NSA uses participating regional operators (PROS) to rapidly expand its footprint. NSA’s PRO initiative targets top private operators with 20 or more properties. NSA acquires and integrates best-in-class regional operators of self storage properties by providing financial incentives in the form of common equity interests and subordinated performance units. This strategy has resulted in explosive growth.
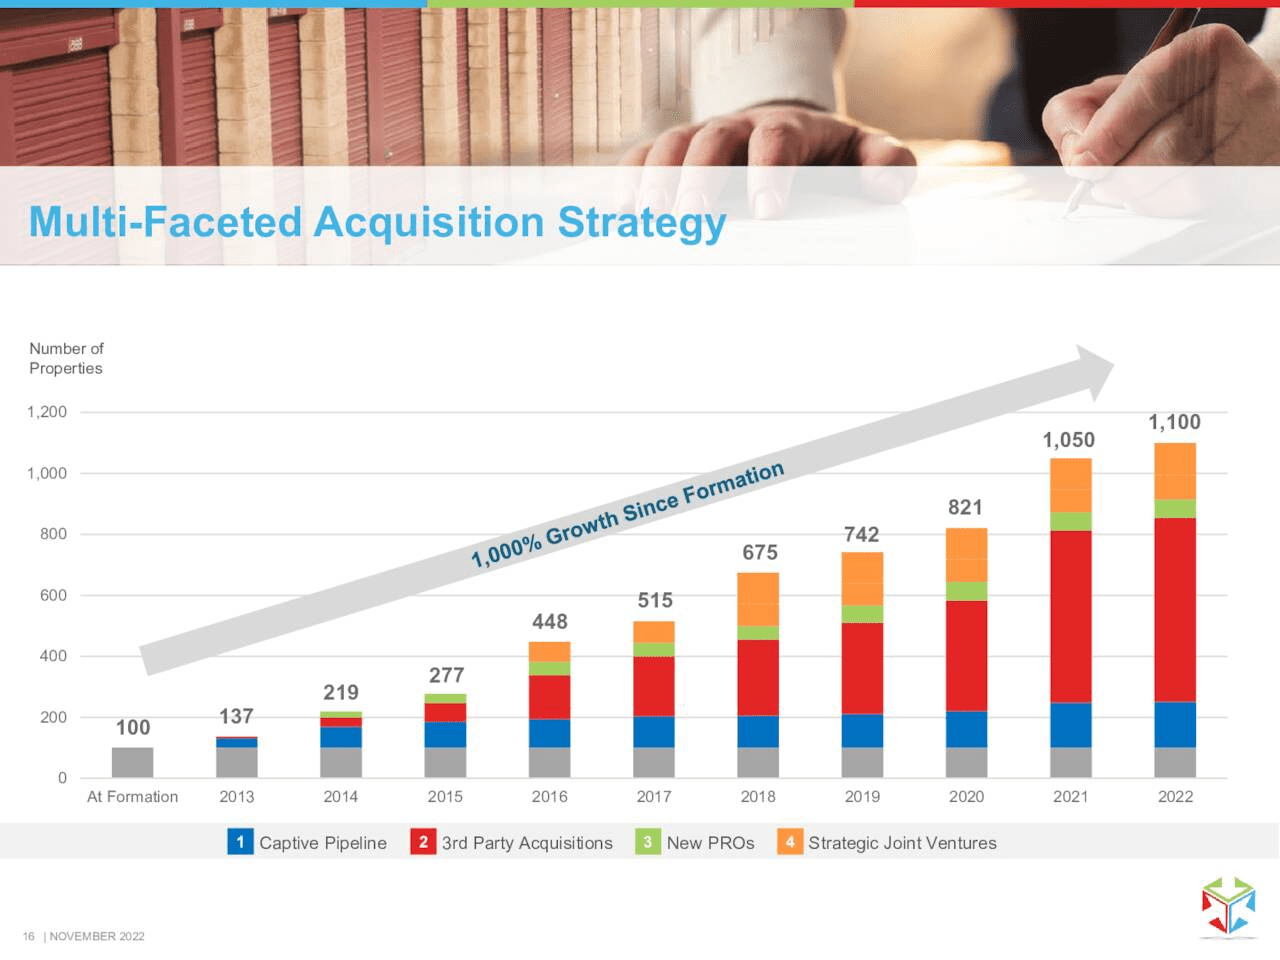
NSA Investor Presentation
With over 51,000 properties and more than 30,000 operators, the self-storage sector is highly fragmented, providing opportunities for continued growth for storage REITs.
NSA reports that storage unit demand is outpacing supply in thirteen of the firm’s fifteen top markets.
The REIT’s debt is rated BBB+ by Kroll’s bond rating agency. The debt is reasonably well laddered with a weighted average maturity of 5.4 years and an effective interest rate of 5.6%. Around 24% of the debt is subject to variable rate exposure.
NSA has a current yield of 5.8%, a 5-year dividend growth rate of 15.63%, and a forward AFFO payout ratio of 80.52%.
I recently initiated and have built a moderate sized position in NSA. I rate the stock as a BUY.
Jefferies Financial Group (JEF)
I was utterly unaware of Jefferies before Berkshire Hathaway’s (BRK.A) (BRK.B) latest 13F filing revealed a new position in the stock.
Jefferies is based in New York City and operates offices in over thirty cities around the world.
The firm’s M&A, underwriting, Equities Cash Trading, and EMEA are ranked 6th, 7th, 8th and 6th worldwide, respectively. The bank is also ranked 8th globally and 7th in the U.S. across all Investment Banking products.
Jefferies investment banking and capital markets divisions generated 83% of the firm’s net revenues in FY21.
The following chart records Jefferies growth over the years.
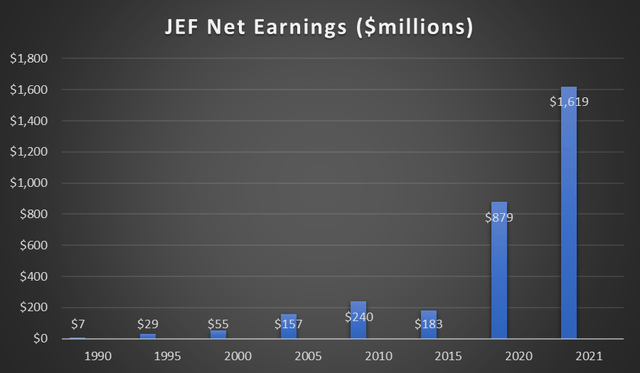
Investor Presentation/ Author
Jefferies is a stock buyback machine. The company reduced shares outstanding by 31% since 2017.
JEF has a debt rating from S&P of BBB/stable, Moody’s has a rating of Baa2/stable, and Fitch ranks the company’s debt at BBB/Positive.
At the end of the Q3 2022, JEF had a tangible book value per share of $39.00.
The stock has a current yield of 3.44%, a payout ratio just below 32%, and a 5-year dividend rate approaching 35%.
I recently initiated and built a small position in Jefferies. I rank the stock as a BUY.
Broadcom Inc. (AVGO)
I authored my first article on Broadcom two months ago, listing the stock as a Strong Buy. The shares have since appreciated by 27%, while the S&P 500 has trudged up 4% in that time frame.
Investors fear the current economic environment will weigh on semiconductor stocks. Although it is true that a significant portion of Broadcom’s revenue (about one-quarter) is related to wireless products, the long term demand for smartphones will at worst be pushed down the road as consumers upgrade to 5G.
Meanwhile, Broadcom dominates the networking, broadband, and wireless connectivity markets, and there is evidence those areas are experiencing continued healthy demand.
Early this month, AVGO posted Q4 2022 earnings. Revenue of $33.2 billion surged 21% FY22. This year’s operating profit also grew by 28%, and FCF per share increased by 25%.
During the earnings call, management guided for flat revenue in wireless for Q1 2023, but forecasts year-over-year growth of 20% in networking, a 50% increase in revenue for storage connectivity, and 30% growth in broadband for the coming quarter.
According to a study conducted by FORTUNE BUSINESS INSIGHTS, the global semiconductor market is projected to grow at a 12.2% CAGR from 2022 through 2029.
Broadcom scrubs the company’s backlog by estimating customer demand. AVGO will not sell clients product in quantities that would result in inventory exceeding a given quarter’s needs, nor are customers allowed to cancel orders.
Broadcom’s proposed acquisition of VMware (VMW), a provider of multi-cloud services, is expected to close in 2023. Management guides for $8.5 billion in annual EBITDA from the deal within three years of closing.
Market Research Future forecasts the enterprise software market will increase at a CAGR of 8.5% through 2030.
Broadcom’s current yield is 3.30%, the payout ratio is a tad below 45%, and the 5-year dividend growth rate is 32.08%.
I have a large position in AVGO that I initiated late this year. I now rate the stock as a Buy.
Cisco Systems, Inc. (CSCO)
Here is Morningstar’s overview of Cisco:
We view Cisco Systems as the dominant force in enterprise networking and expect it to retain its strength in both legacy and future networks. Cisco holds leading market shares across switching, routing, and wireless access, with strong complementary positions in security and collaboration. We believe Cisco’s portfolio is positioned appropriately to benefit from trends toward hybrid work and cloud environments. It offers the most comprehensive suite of capabilities across converging networking and security markets, and we deem its intertwined products as sticky and worthy of a wide economic moat.
The first quarter of 2023 began with the company reporting the largest quarterly revenue and second highest quarterly non-GAAP earnings per share in Cisco’s history.
During last month’s earning’s call, management noted the firm’s backlog is at an all time high.
Backlog levels for both our hardware and software continue to far exceed historical levels.
Even if our orders are down 10% this year, which is not our forecast, we will still — we project today that we will end the fiscal year with two times to three times our historic year-end normal backlog. That normal backlog is typically $4 billion to $5 billion.
In addition to record backlog, Cisco derives 44% of revenue from recurring subscription based offerings.
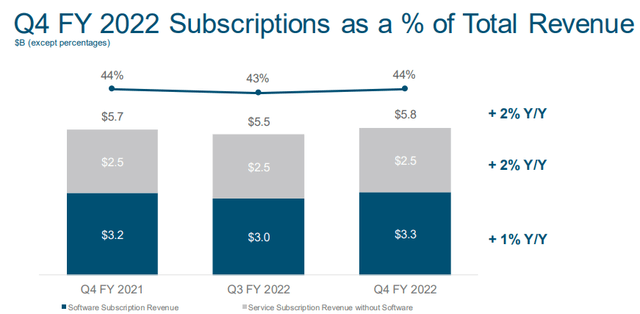
Investor Presentation
In part, that is due to management’s strategy to shift the portfolio of products away from hardware and toward an integrated mix of software, hardware, and services solution
In Q1 of 2023, annualized recurring revenue (ARR) hit $23.2 billion, up 8% year-over-year. That was driven by a 2% increase in service ARR and a 12% growth in product ARR.
Management has a policy of returning a minimum of 50% of FCF to shareholders. That resulted in the company buying back stock at an average of $1.1 billion per quarter over the last three years.
The company’s debt is rated AA. Cisco held $19.78 billion in cash at the end of fiscal 1Q23 and had debt of $8.88 billion.
The current yield is 3.16%, the payout ratio is just below 45%, and the 5-year dividend growth rate is about 6%.
I recently initiated and built a small position in CSCO. I rate the stock as a BUY.
Corning Incorporated (GLW)
Those unfamiliar with Corning likely view the making of glass as a rather prosaic process. In fact, GLW leads all other rivals due to a technological advantage known as the fusion draw process.
Fusion draw provides the company with a tremendous competitive advantage: management estimates the process saves approximately $1 billion in investment costs and creates significant savings associated with refining and polishing.
Due to fusion draw, Corning has corralled half of worldwide demand for the display market. Furthermore, the company’s technological advantages means GLW garners gross margins in the upper 30’s, around ten points above that of rivals.
Corning operates three of the world’s four Gen 10.5 plants. Gen 10.5 plants are used for production of 65-inch and 75 inch-television screens, and Gen 10.5 reduces the cost of TV panel production by 30% over the prior technology.
Corning is also the sole supplier of Ceramic Shield for Apple (AAPL) iPhones.
Most of Corning’s production facilities are adjacent to customer’s manufacturing operations. This is to reduce loss of product due to the fragile nature of glass.
To open a new production facility, GLW requires customers to enter into long term contracts and to fund 75% of building costs. This results in very long term, stable relationships with customers.
The current yield is 3.29%, the payout ratio is a bit below 49%, and the 5-year dividend growth rate is 11.
GLW is one of my larger positions, and I rate the stock as a STRONG BUY.
Taiwan Semiconductor Manufacturing Company Limited (TSM)
Well before Buffett’s stake in TSM was announced, I authored an article rating the stock as a Strong Buy.
While I acknowledge the cyclical nature of semiconductors and the threat posed by China, few companies dominate an industry as does TSM, and few industries are as essential to everyday life and the economy as is the semiconductor industry.
Yes, PC demand has dropped and smartphone shipments are shrinking, in part due to supply chain disruptions. Nonetheless, Taiwan Semiconductor delivered record 3Q22 EPS and revenue as sales surged at a mid-30% pace, and EPS increased more than 60%.
The company also notched growth in demand across all geographies, end-markets, and advanced process nodes.
That followed a Q2 that recorded a year-over-year revenue surge of 43.5% while net income and diluted EPS both increased 76.4%.
Despite this sustained, strong performance, the stock is now trading at roughly half its 52 week high.
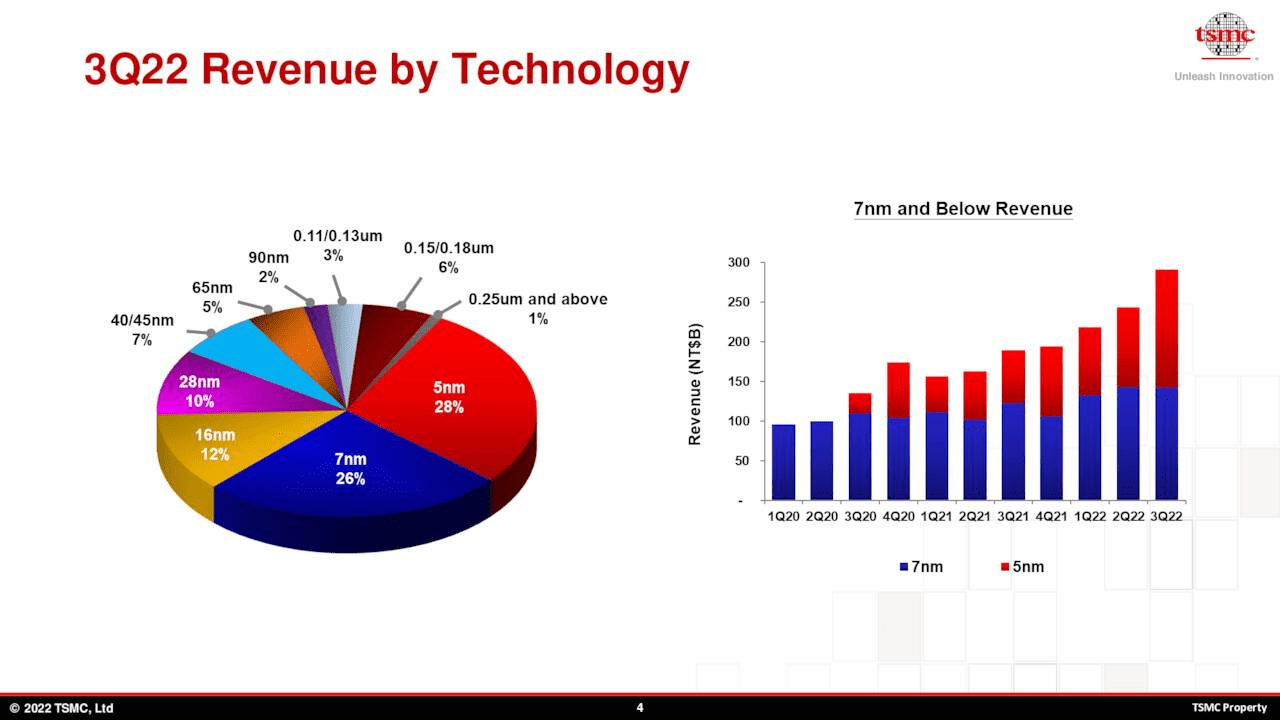
Investor Presentation
TSM is acknowledged as the largest and most advanced contract chipmaker, and is the number one producer of 7nm and 5nm nodes. Last quarter, TSM’s advanced technologies, defined as 7-nanometer and below, accounted for 54% of wafer revenue, up from 51% in Q2.
Revenue from 5 nm products increased over 50% from the prior year.
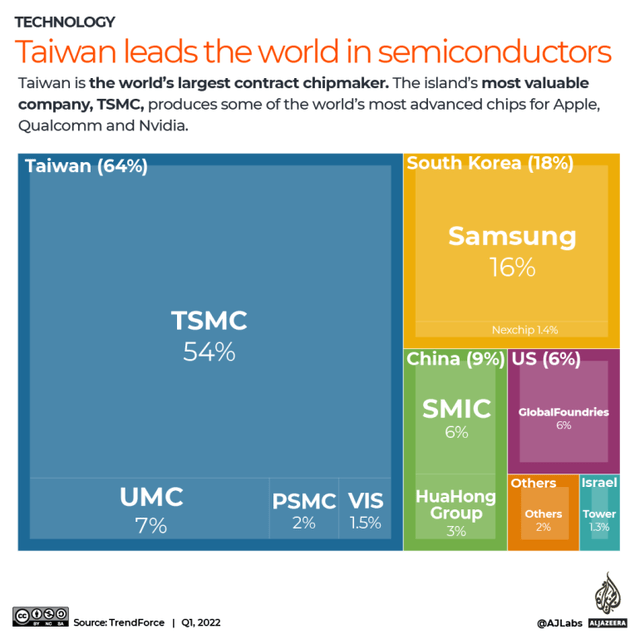
Trendforce
Like Broadcom, TSM holds customers to their contractual obligations. For example, TSM recently refused to cancel a Nvidia (NVDA) order for gaming chips that led to the latter company taking a $1.3 billion inventory hit.
S&P rates the company’s debt AA-/stable and Moody’s has an Aa3/stable rating. At the end of Q3, TSM had $49.57 billion in cash and equivalents. Debt totaled $26.4 billion at the end of 2021.
The current yield is 2.35%, the payout ratio is 32.20%, and the 5-year dividend growth rate is 9.63%.
I hold a moderate sized position in TSM, and I rate the stock as a STRONG BUY.
Summation
The average forward AFFO payout ratio of the three REITs is in the low 70’s, a very conservative figure.
The average payout ratio for the other seven stocks is about 40%, and the average 5-year dividend growth rate is 15.6%.
The average yield for the eight featured stocks is nearly 4%.
I own positions in each name. My strategy during this environment is to continue to invest in solid companies trading at reasonable valuations; however, I invest using smaller tranches, and I spread those buys out over a longer time frame.
Be the first to comment