

Galeanu Mihai/iStock via Getty Images
Dividend Kings
The Dividend Kings are an elite group of companies that have all paid and increased dividends for at least 50 consecutive years. There are multiple lists of the kings on the internet, some that include more than 48 companies. I have chosen to use the list provided by Suredividend.com that was updated on January 4, 2023 and did change from the prior month.
The list no longer includes Computer Services (OTCQX:CSVI), but does include Nucor Corporation (NUE). I did not find an explanation for when Computer Services dropped from the list and Nucor joined, but I have updated my personal list to reflect the changes. Nucor was added to the list after selections were made for the month of January, as such it was not included in the process.
The 48 companies on the dividend king list span 9 unique sectors, offer an average dividend yield of 2.50% and have an average 5-year dividend growth history of 6.88%. Even though all 48 of these companies share the status of an elite dividend stock, not all will offer great returns going forward. So, how can an investor identify the dividend kings that have a higher chance of offering better returns?
In my prior article, I shared a method for selecting the dividend kings that present the best opportunity for better than average future returns. The method leverages a long-term pattern of correlation between share price appreciation and long-term earnings growth. The pattern is more evident when applied to a group of stocks and measured over a longer time period. While this method may not work for all stocks, it can help identify a group of stocks that collectively can outperform a universe of stocks.
First, let me explain in more detail how and why this strategy may work, and then I’ll share the real results.
EPS Growth Combined With Valuation
Forecasted EPS growth rates are a useful indicator of future returns, but this factor can be strengthened when combined with the current valuation of a given stock. My preferred method of valuation for dividend stocks is dividend yield theory. The premise is simple: if the current dividend yield exceeds the trailing dividend yield, a stock is considered to be potentially undervalued and vice versa.
I have decided to test this theory on the dividend king universe of stocks going forward. Each month, I will select roughly the top quarter of dividend kings that present the best-forecasted EPS growth rate combined with current valuation. I will be using analyst forecasted 5-year EPS growth rates from FinViz.com. Current valuation will be computed using current and trailing dividend yields obtained from Seeking Alpha.
I will assume that a given stock can return to fair valuation within a 5-year period that aligns with the forecasted EPS growth rate. Potentially undervalued stocks will be awarded a boost to their forecasted EPS growth rate equivalent to the annualized rate of return necessary to bring the share price back to fair value within the 5-year period. Overvalued stocks will be penalized using the same principle in reverse.
The best way to apply and measure the success of this strategy is through a buy-and-hold portfolio. I have been tracking how such a portfolio is working out, and I will share those results later on in the article.
Past Performance
The table below shows the returns for the chosen dividend kings using this methodology for the time period of July 2021 through December 2022.
|
Ticker |
Jul 21 |
Aug 21 |
Sep 21 |
Oct 21 |
Nov 21 |
Dec 21 |
Jan 22 |
Feb 22 |
Mar 22 |
Apr 22 |
May 22 |
Jun 22 |
Jul 22 |
Aug 22 |
Sep 22 |
Oct 22 |
Nov 22 |
Dec 22 |
|
ABM |
4.83% |
6.52% |
-9.11% |
-1.82% |
2.25% |
-9.22% |
2.52% |
7.53% |
2.70% |
-0.78% |
-10.20% |
6.68% |
||||||
|
ABT |
-5.37% |
-1.87% |
0.62% |
-5.74% |
||||||||||||||
|
BDX |
6.42% |
1.06% |
||||||||||||||||
|
CINF |
-0.39% |
-6.98% |
||||||||||||||||
|
CWT |
12.86% |
1.75% |
3.98% |
3.50% |
||||||||||||||
|
FUL |
1.86% |
4.57% |
-4.45% |
9.50% |
3.76% |
10.72% |
-11.40% |
-3.36% |
1.22% |
6.57% |
6.97% |
1.03% |
-7.34% |
|||||
|
GRC |
2.63% |
|||||||||||||||||
|
GWW |
19.45% |
3.49% |
-7.76% |
|||||||||||||||
|
HRL |
-1.81% |
-9.97% |
3.81% |
-2.17% |
17.90% |
|||||||||||||
|
LEG |
1.60% |
5.51% |
-8.29% |
|||||||||||||||
|
LOW |
-0.25% |
5.81% |
-0.51% |
15.68% |
4.61% |
5.68% |
-7.87% |
-6.86% |
-1.82% |
-10.56% |
10.26% |
1.36% |
-3.26% |
4.37% |
9.03% |
-6.26% |
||
|
MMM |
-9.57% |
0.15% |
-3.13% |
|||||||||||||||
|
MO |
-3.33% |
5.00% |
2.87% |
14.59% |
0.67% |
0.16% |
||||||||||||
|
MSA |
6.04% |
-5.04% |
6.00% |
-7.06% |
-8.06% |
22.84% |
5.39% |
2.26% |
||||||||||
|
NDSN |
-0.19% |
6.74% |
0.63% |
-8.90% |
-2.39% |
0.26% |
-5.02% |
-7.09% |
-6.56% |
6.00% |
5.11% |
0.80% |
||||||
|
NWN |
-0.91% |
-4.37% |
13.13% |
|||||||||||||||
|
PH |
1.60% |
-4.60% |
1.01% |
-9.60% |
17.49% |
-2.66% |
||||||||||||
|
PPG |
-9.42% |
-14.23% |
-1.78% |
-2.35% |
-0.71% |
-9.61% |
13.08% |
-1.31% |
-12.83% |
3.15% |
||||||||
|
SJW |
8.89% |
|||||||||||||||||
|
SWK |
-1.92% |
-8.92% |
2.52% |
-2.33% |
-7.41% |
-6.84% |
-13.64% |
-14.05% |
-1.22% |
-11.07% |
-7.18% |
-9.48% |
-13.83% |
4.36% |
5.13% |
-8.08% |
||
|
SYY |
-3.98% |
7.35% |
-0.85% |
-2.04% |
-8.92% |
12.15% |
0.08% |
11.45% |
-5.72% |
4.69% |
-1.52% |
1.21% |
0.22% |
-3.16% |
-14.00% |
23.23% |
-0.06% |
-11.63% |
|
TGT |
-12.76% |
15.68% |
-1.27% |
-7.45% |
10.69% |
2.33% |
||||||||||||
|
TNC |
-3.24% |
-4.80% |
13.13% |
-9.60% |
-6.28% |
2.99% |
9.53% |
-3.09% |
||||||||||
|
TR |
1.42% |
-3.85% |
||||||||||||||||
|
VFC |
-14.35% |
|||||||||||||||||
|
Return |
3.40% |
2.21% |
-4.73% |
4.19% |
-1.31% |
7.18% |
-5.17% |
-3.28% |
-2.91% |
-2.66% |
1.36% |
-6.91% |
7.39% |
-1.85% |
-8.39% |
10.30% |
4.43% |
-5.35% |
|
Benchmark |
1.71% |
0.83% |
-5.33% |
4.05% |
-1.68% |
8.79% |
-3.88% |
-2.25% |
0.97% |
-2.41% |
-0.10% |
-5.39% |
5.52% |
-1.21% |
-8.34% |
10.85% |
6.60% |
-3.95% |
|
Alpha |
1.70% |
1.37% |
0.60% |
0.13% |
0.36% |
-1.61% |
-1.29% |
-1.04% |
-3.88% |
-0.25% |
1.46% |
-1.52% |
1.87% |
-0.63% |
-0.05% |
-0.55% |
-2.17% |
-1.40% |
Five out of the 11 chosen dividend kings for December finished last month with a return better than the average dividend king universe return. The selected kings for December finished the month with a loss of 5.35%, underperforming the average dividend king universe return by 1.40%. The main drivers of underperformance were: V.F. Corporation (VFC) -14.35%, Sysco (SYY) -11.73%, Leggett & Platt (LEG) -8.29%, Stanley Black & Decker (SWK) -8.08% and W.W. Grainger (GWW) -7.76%. 3 of the chosen stocks posted positive gains last month, they were: MSA Safety Inc. (MSA) +2.26%, Nordson (NDSN) +0.80% and Altria Group (MO) +0.16%. This watchlist doesn’t beat the average dividend king universe return every month, but in the long run it is still performing well. A better measure for this strategy is with a buy-and-hold approach that is discussed later in this article.
Part of this long-term strategy is to identify Dividend Kings that are out of favor. Because of this, the initial results for this watchlist can be lower than the Dividend King universe. I believe this strategy can generate alpha if given enough time to benefit from targeting out of favor stocks.
11 Best Dividend Kings For January
Since this method relies on two factors that are constantly changing, it is likely that we will experience a high turnover rate with this strategy. I have updated the analysts’ expected future earnings growth rates for all the dividend kings and applied the necessary valuation adjustments. Here are the 11 dividend kings with the best expected future growth rates for January.
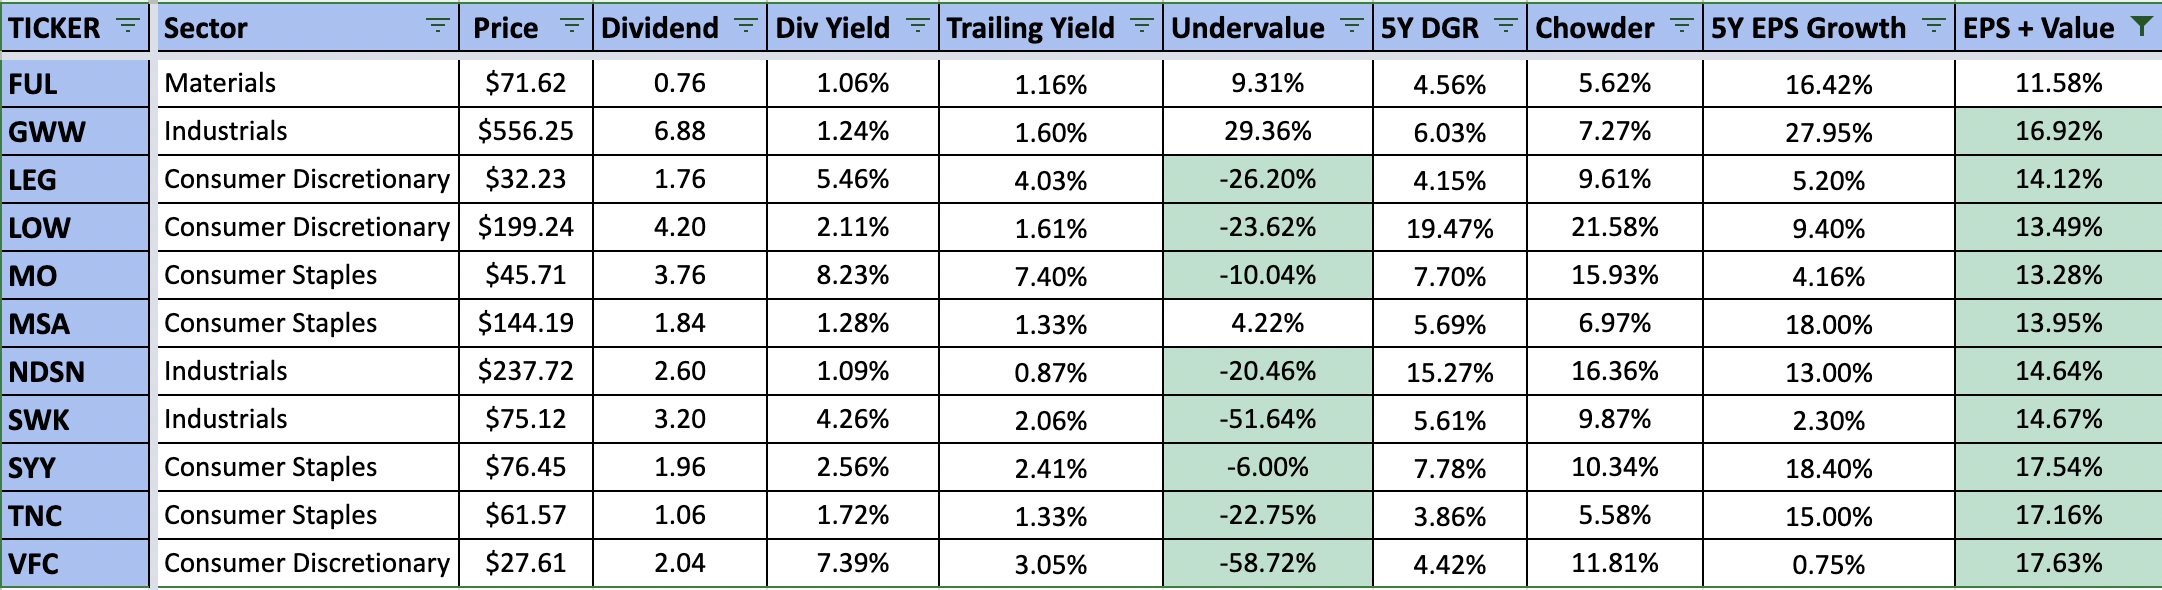
Created by Author
There is only one change from the prior month: Parker-Hannifin (PH) is replaced by H.B. Fuller (FUL). Since H.B. Fuller previously appeared in the top 11 list, this change will not have an impact on the number of holdings in the buy-and-hold portfolio.
H.B. Fuller posted a loss of 10.82% in December that was much worse than the loss of the average dividend king. It is one of the larger holdings in the buy-and-hold portfolio, and the position will be expanded during January.
Please note that this stock selection strategy focuses solely on quantitative data. Further due diligence is necessary to ensure there are no major negative catalysts for each dividend king.
Buy And Hold Strategy
In addition to tracking the returns for the best dividend kings each month, I also track how a buy-and-hold portfolio has performed for this stock selection method.
|
EPS + Value |
Benchmark |
Alpha |
|
|
Jul 21 |
3.40% |
1.71% |
1.70% |
|
Aug 21 |
1.99% |
0.83% |
1.16% |
|
Sep 21 |
-5.05% |
-5.33% |
0.28% |
|
Oct 21 |
4.54% |
4.05% |
0.48% |
|
Nov 21 |
-0.07% |
-1.68% |
1.60% |
|
Dec 21 |
7.75% |
8.79% |
-1.03% |
|
Jan 22 |
-4.89% |
-3.88% |
-1.02% |
|
Feb 22 |
-0.26% |
-2.25% |
1.99% |
|
Mar 22 |
-2.14% |
0.97% |
-3.11% |
|
Apr 22 |
-2.20% |
-2.41% |
0.21% |
|
May 22 |
0.79% |
-0.10% |
0.89% |
|
Jun 22 |
-7.12% |
-5.39% |
-1.73% |
|
Jul 22 |
6.01% |
5.52% |
0.49% |
|
Aug 22 |
-1.82% |
-1.21% |
-0.61% |
|
Sep 22 |
-10.01% |
-8.34% |
-1.67% |
|
Oct 22 |
12.00% |
10.85% |
1.15% |
|
Nov 22 |
6.49% |
6.60% |
-0.11% |
|
Dec 22 |
-5.72% |
-3.95% |
-1.77% |
|
Total |
0.89% |
2.55% |
-1.66% |
|
2021 |
12.72% |
8.06% |
4.66% |
|
2022 |
-10.50% |
-5.10% |
-5.39% |
|
Cumulative |
0.89% |
2.55% |
-1.66% |
|
Annualized |
0.59% |
1.69% |
-1.10% |
The buy-and-hold portfolio for this strategy finished December with a loss of 5.72%. It underperformed both the average dividend king universe return and the monthly watchlist. As a result, the alpha generated by this strategy shrunk down to -1.10% from +0.17% on an annualized basis. This portfolio performed very well in 2021 but did not do so well in 2022.
The 4 largest positions in this portfolio made up 40.72% of the total market value at the start of December. Their average return last month was a loss of 8.64% and was a major driver in the underperformance. The 4 largest holdings at the end of November, their allocation and December returns were:
- Sysco (SYY) 11.96%. -11.63%
- H.B. Fuller (FUL) 10.32%. -10.82%
- Lowe’s (LOW) 9.80%. -6.26%%
- ABM Industries (ABM) 8.64%. -5.85%.
Here is the current allocation of the buy-and-hold portfolio as of December 31, 2022. I’ve also included the November 30, 2022, allocation to show you how it has shifted as a result of contributions and market activity.
|
TICKER |
December |
November |
|
ABM |
8.17% |
8.64% |
|
ABT |
2.34% |
2.28% |
|
BDX |
1.53% |
1.49% |
|
CINF |
1.10% |
1.18% |
|
CWT |
2.91% |
3.10% |
|
FUL |
9.24% |
10.32% |
|
GRC |
0.49% |
0.52% |
|
GWW |
1.55% |
1.16% |
|
HRL |
3.81% |
3.92% |
|
LEG |
1.47% |
1.09% |
|
LOW |
9.70% |
9.80% |
|
MMM |
1.71% |
1.78% |
|
MO |
3.58% |
3.04% |
|
MSA |
5.01% |
4.37% |
|
NDSN |
7.72% |
7.11% |
|
NWN |
2.35% |
2.47% |
|
PH |
3.79% |
3.37% |
|
PPG |
5.86% |
6.27% |
|
SJW |
0.93% |
0.86% |
|
SWK |
6.01% |
6.00% |
|
SYY |
11.07% |
11.96% |
|
TGT |
2.97% |
3.31% |
|
TNC |
4.33% |
3.94% |
|
TR |
1.92% |
2.01% |
|
VFC |
0.44% |
0.00% |
A buy-and-hold approach is a much easier and more tax-friendly investing approach to adopt. Unless a portfolio is held in a tax-free or tax-deferred account, the impact of taxes as a result of moving in and out of positions each month would significantly impact total returns.
Performance For All Dividend Kings In 2022
All 48 dividend kings had an average loss of 6.58% in 2022. 28 dividend kings are outpacing the dividend king universe of stocks this year and are driving the return. The remaining 20 dividend kings are all trailing the dividend king universe return.
Best 5 Dividend Kings in 2022:
- Genuine Parts Company (GPC) +26.81%
- AbbVie (ABBV) +24.04%
- Tootsie Roll (TR) +22.24%
- Lancaster Colony Corp. (LANC) +21.63%
- Nucor (NUE) +17.38%
Worst 5 Dividend Kings in 2022:
- V.F. Corporation (VFC) -60.40%
- Stanley Black & Decker (SWK) -58.93%
- The Gorman-Rupp Company (GRC) -41.18%
- Target (TGT) -34.28%
- Middlesex Water Company (MSEX) -33.76%
Best 5 Dividend Kings in December:
- Farmers & Merchants Bancorp (OTCQX:FMCB) +9.62%
- SJW Group (SJW) +8.70%
- Becton Dickinson (BDX) +2.36%
- MSA Safety Incorporated (MSA) +2.26%
- Abbott Labs (ABT) +2.05%
MSA was part of the December top 11 list. Additionally, the buy-and-hold portfolio has a position in ABT, the 5th best king in December.
Summary
I believe that targeting the 11 best dividend kings with the highest forecasted growth rate based on EPS growth forecasts and reversion to fair value will offer excess returns over the dividend king universe of stocks. It may take time to fully see the results; an ideal evaluation period will be 5 years. For some investors, that is a long period of time, and I encourage all of you to do further due diligence on any of the companies I mentioned prior to investing. So far, this simple strategy is working out okay and I look forward to seeing what this method has to offer in the future.
Be the first to comment