

photovs/iStock via Getty Images
Investment Thesis
D.R. Horton, Inc. (NYSE:DHI) is a leader in the homebuilding market with no signs of slowing down in growing market share. It has consistently improved profitability and grown earnings since 2014. I sought to model future earnings to arrive at a reasonable valuation of the company, which turned out to be very favorable. However, this year will bring real challenges to the housing market, so for now I recommend a “Hold” rating. Those watching carefully could find great buying opportunities for this growing company in 2023, especially if they look for the buy signal I describe below.
Introduction
D.R. Horton is America’s largest homebuilder for the 21st year in a row. Homebuilding is its core business, constituting over 95% of its revenue. It currently serves 106 markets in 33 states. Though the number of houses it has sold has varied with the changing market, its share as a percentage of the market has consistently grown and even accelerated in the past couple of years, as the company showed in its latest investor presentation.
D.R. Horton Investor Presentation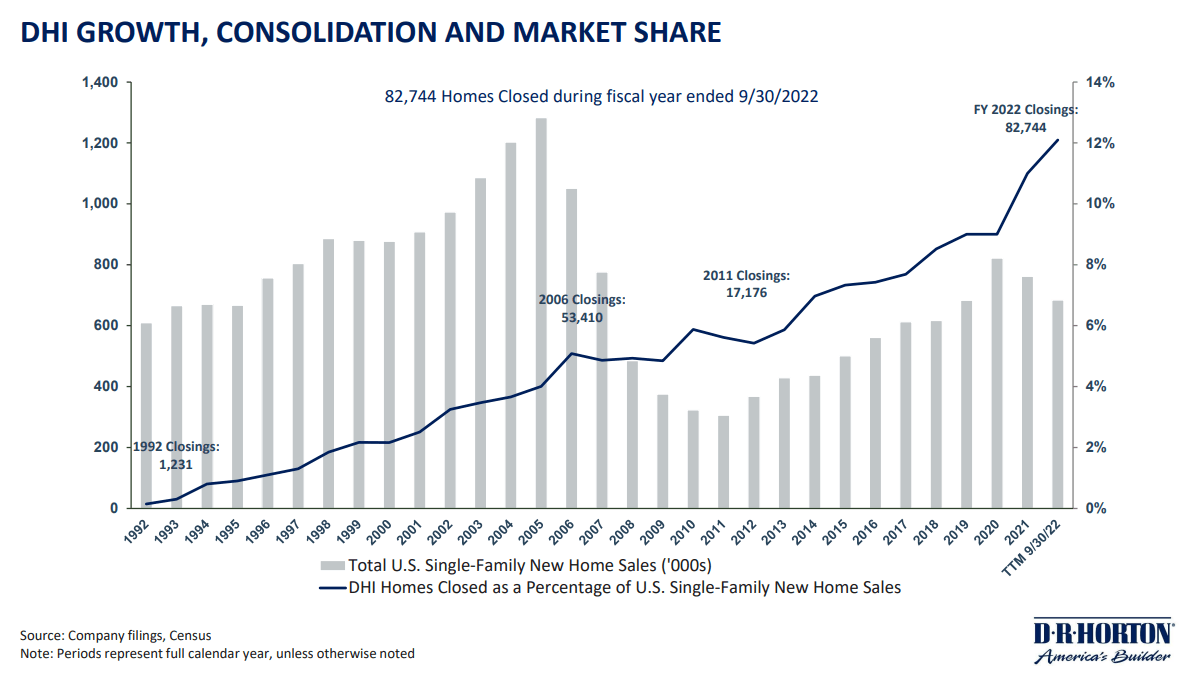
With this compelling story of growth and leadership, I wanted to see what the company’s future could look like and attempted to model the most reasonable scenario I could.
The New House Market
In a recent article ‘What 50 Years Of Supply And Demand Shifts For New Houses Can Tell Us‘, I detailed the economic factors that drive the new house market that D.R. Horton competes in. If my assessment is correct, then in 2023 a rising Federal Funds Rate will reduce supply and a resulting recession will reduce demand. In the worst-case scenario, this looks like a housing market collapse that could result in as few as 300,000-400,000 houses sold per year and prices falling considerably. Following that, however, supply would stabilize and demand would continue its steady march upward, gradually raising prices and quantities again.
For the purposes of this analysis, I used this worst-case scenario of a housing market collapse as a conservative basis, assuming new houses sold will fall to 400,000 next year. Then, I assumed new houses sold would rise by 50,000 houses per year–the average rate for 1991-2005 and 2011-2020. I cannot predict future recessions or rate hikes, so once the quantity reached the historical average of 650,000 per year, I used that as an ongoing estimate of new house sales.
Created by Author using FRED Economic Data from the St. Louis Fed and the Author’s projections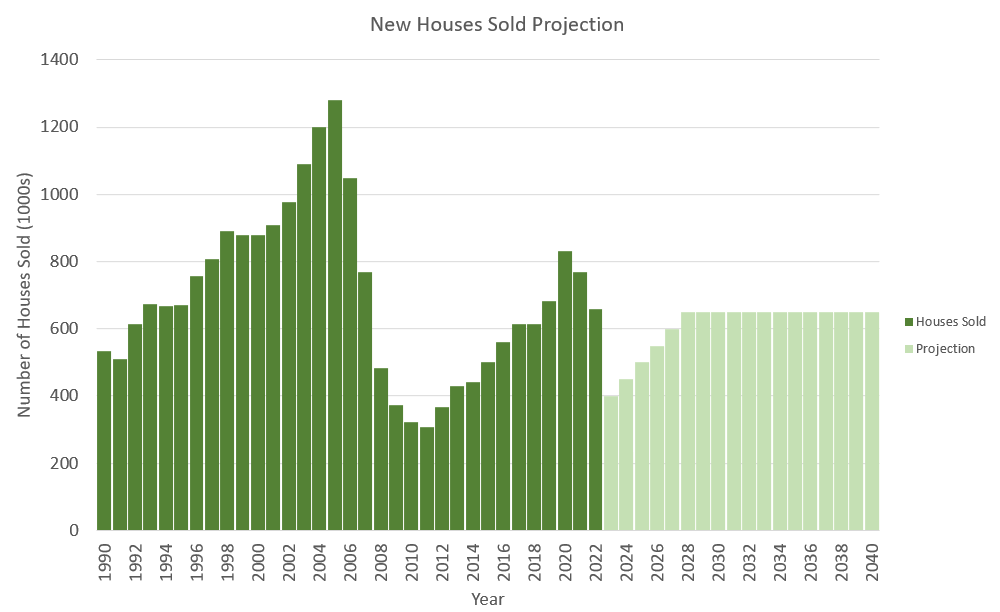
In terms of estimating prices, I looked at a simple trendline for inflation-adjusted median house prices. The trend has been fairly consistent over the past several decades, as can be seen in the chart below.
Created by Author using FRED Economic Data from the St. Louis Fed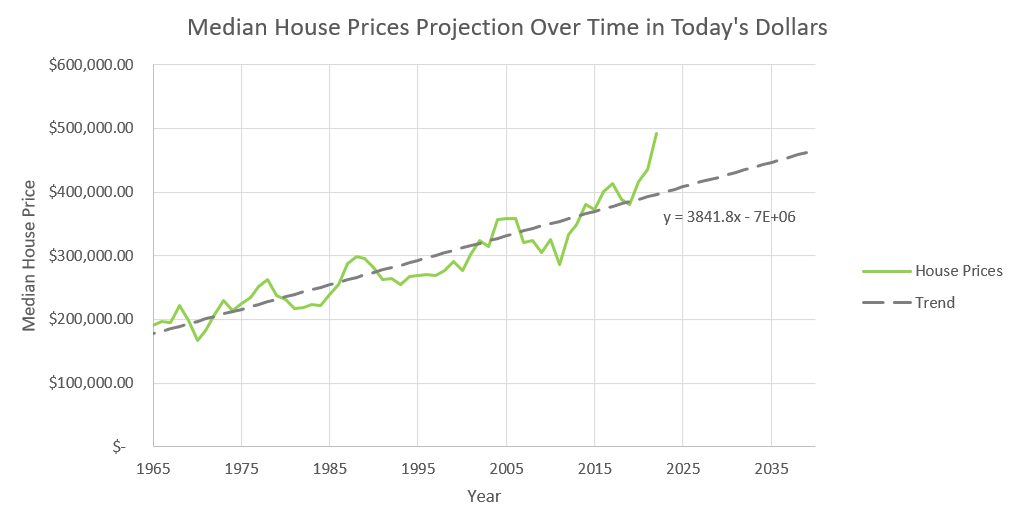
Clearly, prices in the past couple of years have gone up above the historical trend, so using this trendline for the model represents almost a 20% drop in prices for 2023 compared with the actual prices for 2022. While I do expect prices to fall, the decline will likely not be that steep. It is more likely that prices will ramp down much more slowly; some suggest a decline of 10% over two years. For the purposes of this model, though, a lower price simply builds in a bit more conservatism.
D.R. Horton’s Valuation
With that housing market backdrop, the next challenge was to determine how much market share D.R. Horton could conceivably gain. One crude way of estimating this is to say that at 33 states, the company has 12.6% market share, so at 50 states it should have about 19.1% market share (50 / 33 * 12.6% = 19.1%). To estimate this growth trajectory, I used an S-curve equation:
y = max / (1 + ((max – initial) / initial) * e^(-c * x))
where max is 19.1%, initial is 0.2% (in 1991), and c is adjusted to match the company’s growing market share as closely as possible–in this case 0.16. The forecast compared to D.R. Horton’s actual market share percentage is shown below. It has the company reaching its maximum market share between 2040 and 2050.
Created by Author using data from DHI investor relations documents and the Author’s projections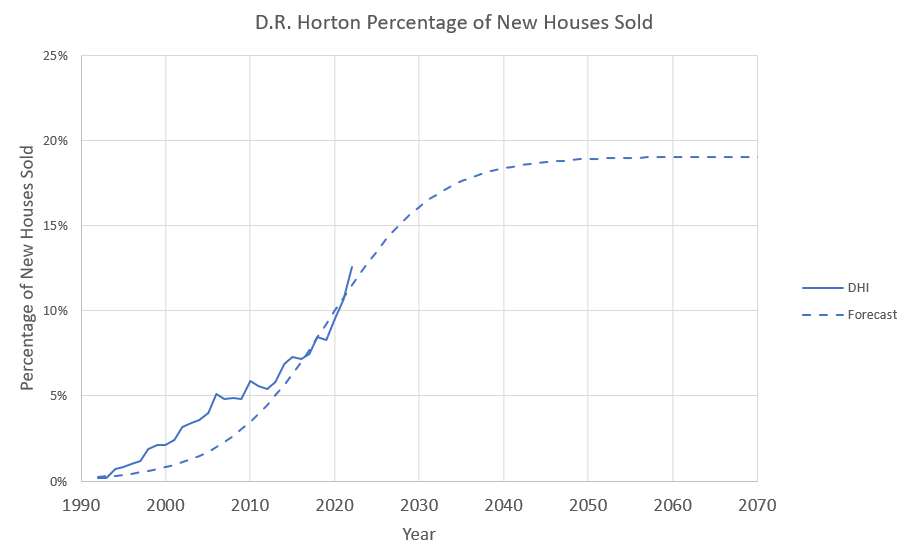
To be able to translate this market share into financial numbers, I looked at how D.R. Horton’s selling price compares to the median house price and saw that selling prices over the past few years have run at about 90% of the median price of single family houses.
|
Year |
Median House Price |
DHI Average Selling Price |
% of Median Price |
|
2016 |
$306,500.00 |
$292,300.00 |
95% |
|
2017 |
$321,633.33 |
$298,400.00 |
93% |
|
2018 |
$323,125.00 |
$298,800.00 |
92% |
|
2019 |
$319,266.67 |
$297,800.00 |
93% |
|
2020 |
$334,991.67 |
$300,900.00 |
90% |
|
2021 |
$393,966.67 |
$323,300.00 |
82% |
|
2022 |
$445,333.33 |
$385,100.00 |
86% |
|
Average: |
90% |
Next, I looked at earnings. The company has improved profitability every year since 2014. Net income has gone up from below 7% of total revenue in 2014 to up to 17.5% of total revenue in 2022.
|
Year |
Revenue (in millions) |
Net Income (in millions) |
% of Revenue |
|
2014 |
$8,024.00 |
$533.50 |
6.6% |
|
2015 |
$10,824.00 |
$750.70 |
6.9% |
|
2016 |
$12,157.40 |
$886.30 |
7.3% |
|
2017 |
$14,091.00 |
$1,038.40 |
7.4% |
|
2018 |
$16,068.00 |
$1,460.30 |
9.1% |
|
2019 |
$17,592.90 |
$1,618.50 |
9.2% |
|
2020 |
$20,311.10 |
$2,373.70 |
11.7% |
|
2021 |
$27,774.20 |
$4,175.80 |
15.0% |
|
2022 |
$33,480.00 |
$5,857.50 |
17.5% |
Since I expect selling prices to go down in 2023, net income could go down a bit as well as a percentage of revenue. That percentage could certainly vary more in the future, but D.R. Horton has clearly figured out how to profitably build houses at scale given its track record, so for simplicity’s sake, I assumed an average percent net income of 15% for the model. Multiplying the number of houses by the forecasted market share up to 19.1%, the average selling price at 90% of the projected median house price, and 15% net income and then dividing by 350M shares produced a forecast for earnings per share shown below.
Created by Author using data from Macrotrends.net and the Author’s projections Created by Author using data from Macrotrends.net and Yahoo Finance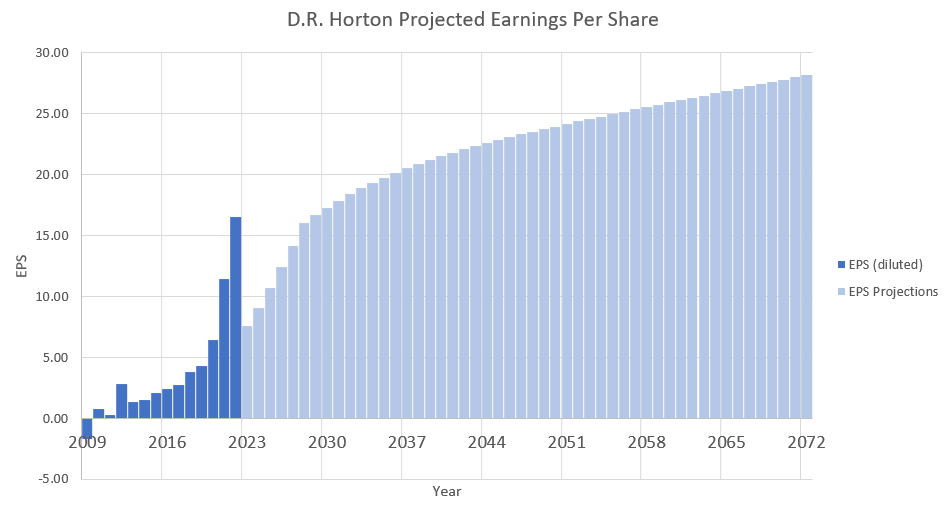

I discounted those projected earnings over 50 years with the average real stock market rate of return of 7%. This gave a total value of $261.53 compared with a stock price today of around $90. At the current trailing 12-month EPS of $16.51, that is a P/E ratio of 15.7 as compared to the current P/E ratio of about 5.4. The details of this analysis are listed in the table below.
|
Year |
2009 |
2010 |
2011 |
2012 |
2013 |
2014 |
2015 |
2016 |
2017 |
2018 |
2019 |
2020 |
2021 |
2022 |
2023 |
2024 |
2025 |
2026 |
2027 |
2028 |
2029 |
2030 |
2031 |
2032 |
2033 |
2034 |
2035 |
2036 |
2037 |
2038 |
2039 |
2040 |
2041 |
2042 |
2043 |
2044 |
2045 |
2046 |
2047 |
2048 |
2049 |
2050 |
2051 |
2052 |
2053 |
2054 |
2055 |
2056 |
2057 |
2058 |
2059 |
2060 |
2061 |
2062 |
2063 |
2064 |
2065 |
2066 |
2067 |
2068 |
2069 |
2070 |
2071 |
2072 |
|
Houses Sold (thousands) |
374 |
321 |
306 |
368 |
430 |
440 |
503 |
561 |
615 |
614 |
683 |
831 |
769 |
658 |
400 |
450 |
500 |
550 |
600 |
650 |
650 |
650 |
650 |
650 |
650 |
650 |
650 |
650 |
650 |
650 |
650 |
650 |
650 |
650 |
650 |
650 |
650 |
650 |
650 |
650 |
650 |
650 |
650 |
650 |
650 |
650 |
650 |
650 |
650 |
650 |
650 |
650 |
650 |
650 |
650 |
650 |
650 |
650 |
650 |
650 |
650 |
650 |
650 |
650 |
|
DHI Market Share |
4.46% |
6.50% |
5.45% |
5.13% |
5.62% |
6.51% |
7.23% |
7.19% |
7.44% |
8.45% |
8.28% |
9.44% |
10.62% |
12.58% |
12.20% |
12.89% |
13.54% |
14.14% |
14.70% |
15.22% |
15.69% |
16.11% |
16.48% |
16.82% |
17.12% |
17.38% |
17.61% |
17.81% |
17.98% |
18.13% |
18.27% |
18.38% |
18.48% |
18.56% |
18.63% |
18.69% |
18.75% |
18.79% |
18.83% |
18.86% |
18.89% |
18.92% |
18.94% |
18.96% |
18.97% |
18.98% |
19.00% |
19.00% |
19.01% |
19.02% |
19.03% |
19.03% |
19.03% |
19.04% |
19.04% |
19.04% |
19.05% |
19.05% |
19.05% |
19.05% |
19.05% |
19.05% |
19.05% |
19.05% |
|
DHI Selling Price |
$ 213,400.00 |
$ 206,100.00 |
$ 212,200.00 |
$ 223,300.00 |
$ 249,400.00 |
$ 272,200.00 |
$ 285,700.00 |
$ 292,300.00 |
$ 298,400.00 |
$ 298,800.00 |
$ 297,800.00 |
$ 300,900.00 |
$ 323,300.00 |
$ 385,100.00 |
$ 360,703.98 |
$ 364,161.57 |
$ 367,619.17 |
$ 371,076.76 |
$ 374,534.35 |
$ 377,991.94 |
$ 381,449.54 |
$ 384,907.13 |
$ 388,364.72 |
$ 391,822.32 |
$ 395,279.91 |
$ 398,737.50 |
$ 402,195.10 |
$ 405,652.69 |
$ 409,110.28 |
$ 412,567.87 |
$ 416,025.47 |
$ 419,483.06 |
$ 422,940.65 |
$ 426,398.25 |
$ 429,855.84 |
$ 433,313.43 |
$ 436,771.02 |
$ 440,228.62 |
$ 443,686.21 |
$ 447,143.80 |
$ 450,601.40 |
$ 454,058.99 |
$ 457,516.58 |
$ 460,974.17 |
$ 464,431.77 |
$ 467,889.36 |
$ 471,346.95 |
$ 474,804.55 |
$ 478,262.14 |
$ 481,719.73 |
$ 485,177.33 |
$ 488,634.92 |
$ 492,092.51 |
$ 495,550.10 |
$ 499,007.70 |
$ 502,465.29 |
$ 505,922.88 |
$ 509,380.48 |
$ 512,838.07 |
$ 516,295.66 |
$ 519,753.25 |
$ 523,210.85 |
$ 526,668.44 |
$ 530,126.03 |
|
Revenue from Closed Sales (millions) |
$ 3,564.42 |
$ 4,302.34 |
$ 3,542.68 |
$ 4,217.02 |
$ 6,024.26 |
$ 7,803.97 |
$ 10,384.62 |
$ 11,782.32 |
$ 13,652.10 |
$ 15,494.87 |
$ 16,845.06 |
$ 23,608.01 |
$ 26,411.99 |
$ 31,864.71 |
$ 17,608.57 |
$ 21,122.78 |
$ 24,883.50 |
$ 28,865.71 |
$ 33,043.34 |
$ 37,390.60 |
$ 38,891.39 |
$ 40,298.50 |
$ 41,613.41 |
$ 42,839.43 |
$ 43,981.19 |
$ 45,044.21 |
$ 46,034.56 |
$ 46,958.53 |
$ 47,822.40 |
$ 48,632.26 |
$ 49,393.90 |
$ 50,112.74 |
$ 50,793.75 |
$ 51,441.47 |
$ 52,059.99 |
$ 52,652.99 |
$ 53,223.72 |
$ 53,775.07 |
$ 54,309.60 |
$ 54,829.52 |
$ 55,336.81 |
$ 55,833.16 |
$ 56,320.07 |
$ 56,798.82 |
$ 57,270.53 |
$ 57,736.17 |
$ 58,196.59 |
$ 58,652.50 |
$ 59,104.54 |
$ 59,553.25 |
$ 59,999.08 |
$ 60,442.45 |
$ 60,883.70 |
$ 61,323.12 |
$ 61,760.98 |
$ 62,197.50 |
$ 62,632.85 |
$ 63,067.21 |
$ 63,500.72 |
$ 63,933.50 |
$ 64,365.64 |
$ 64,797.25 |
$ 65,228.39 |
$ 65,659.14 |
|
Earnings Per Share |
$ (1.73) |
$ 0.77 |
$ 0.23 |
$ 2.77 |
$ 1.33 |
$ 1.50 |
$ 2.03 |
$ 2.36 |
$ 2.74 |
$ 3.81 |
$ 4.29 |
$ 6.41 |
$ 11.41 |
$ 16.51 |
$ 7.55 |
$ 9.05 |
$ 10.66 |
$ 12.37 |
$ 14.16 |
$ 16.02 |
$ 16.67 |
$ 17.27 |
$ 17.83 |
$ 18.36 |
$ 18.85 |
$ 19.30 |
$ 19.73 |
$ 20.13 |
$ 20.50 |
$ 20.84 |
$ 21.17 |
$ 21.48 |
$ 21.77 |
$ 22.05 |
$ 22.31 |
$ 22.57 |
$ 22.81 |
$ 23.05 |
$ 23.28 |
$ 23.50 |
$ 23.72 |
$ 23.93 |
$ 24.14 |
$ 24.34 |
$ 24.54 |
$ 24.74 |
$ 24.94 |
$ 25.14 |
$ 25.33 |
$ 25.52 |
$ 25.71 |
$ 25.90 |
$ 26.09 |
$ 26.28 |
$ 26.47 |
$ 26.66 |
$ 26.84 |
$ 27.03 |
$ 27.21 |
$ 27.40 |
$ 27.59 |
$ 27.77 |
$ 27.96 |
$ 28.14 |
|
Discounted EPS (7% Discount Rate) |
$ 7.55 |
$ 8.46 |
$ 9.31 |
$ 10.10 |
$ 10.80 |
$ 11.43 |
$ 11.11 |
$ 10.76 |
$ 10.38 |
$ 9.99 |
$ 9.58 |
$ 9.17 |
$ 8.76 |
$ 8.35 |
$ 7.95 |
$ 7.55 |
$ 7.17 |
$ 6.80 |
$ 6.44 |
$ 6.10 |
$ 5.77 |
$ 5.45 |
$ 5.15 |
$ 4.86 |
$ 4.59 |
$ 4.33 |
$ 4.08 |
$ 3.85 |
$ 3.63 |
$ 3.42 |
$ 3.22 |
$ 3.04 |
$ 2.86 |
$ 2.70 |
$ 2.54 |
$ 2.39 |
$ 2.25 |
$ 2.12 |
$ 1.99 |
$ 1.88 |
$ 1.77 |
$ 1.66 |
$ 1.57 |
$ 1.47 |
$ 1.39 |
$ 1.30 |
$ 1.23 |
$ 1.15 |
$ 1.09 |
$ 1.02 |
With a valuation almost three times the current stock price, normally that would make this stock a strong buy in my opinion, but there are important risks to be considered.
Risks
My concern with this stock is that it has continued to trade at a lower and lower P/E ratio, as can be seen in the figure below.
Created by Author using data from Macrotrends.net and Yahoo Finance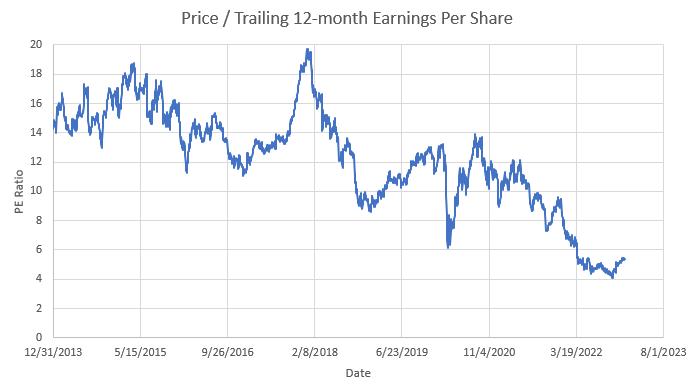
My valuation suggests that the P/E ratio belongs back in the range it was in between 2013 and 2018 around 15. However, with this declining confidence in the stock despite continually improving earnings over the same period, the price could fall further if the earnings falter. That is a real risk in 2023. D.R. Horton recognizes the changes in the housing market, stating in its 2022 annual report “In June 2022, we began to see a moderation in housing demand that persisted through the end of our fiscal year . . .” Given the situation of the housing market in the short-term, I see too much risk in the stock price to be able to recommend a buy. However, if the price does drop, that could be a great opportunity to pick up shares. I recommend a “Hold” rating, and my biggest signal for buying would be the Federal Reserve pausing interest rate hikes or even starting to bring rates back down. That would facilitate a turnaround in the housing market from the decline that has just begun in recent months. Based on current probabilities, lower interest rates do not seem likely in 2023, but it is worth watching what the Federal Reserve does, since no one really knows what it will decide to do.
To survive through the anticipated rough housing market conditions, D.R. Horton will need strong financials. The company’s long-term debt in the form of accrued expenses and other liabilities and its notes payable add up to $9.2B compared to $19.4B in stockholder’s equity, or a long-term debt-to-equity ratio of 0.47 (its $1.4B accounts payable is amply covered by its $2.5B in cash). At a ratio less than 1, this puts it in a good position to weather the storms ahead.
There are also risks with my analysis of D.R. Horton. To the upside, the housing market demand could drop more slowly than what I assumed, future stock buybacks could bolster the price (the company has bought back 14.0M shares in 2022 according to its annual report), and the company could further improve profitability. In the short-term, the market may be more forward-looking than I am giving it credit for and the share price may have already reached its low back in June or October when the share price was between $60 and $70. To the downside, a prolonged recession could result in a longer decline in demand for new houses, competition could make it difficult for D.R. Horton to reach such a high market share of 19.1% or maintain its lead, or profitability could fall more significantly with falling house prices than modeled.
Conclusion
Based on my analysis, D.R. Horton is a strong and growing company with a lot of long-term potential. It could easily warrant P/E ratios closer to what it traded historically. However, the new house market is facing declining demand, even a possible collapse. As a result, earnings could fall and the stock price could fall with them. However, the company is poised to not only survive such a market, but to also come out the other side with a continued lead in homebuilding and growing market share. Investors paying attention to the housing market and to the Federal Reserve’s decisions to raise or lower rates could find great buying opportunities for this stock in 2023.
Be the first to comment