

Guillem de Balanzo
Technical Analysis
If we pull up an intermediate chart of Murphy USA Inc. (NYSE:MUSA), we see that shares are wrestling to stay above their 40-week moving average. Although this support level has held firm in previous cycles, there are a number of worrying signs when it comes to MUSA’s intermediate technicals at present.
MUSA Technical Chart (Stockcharts.com)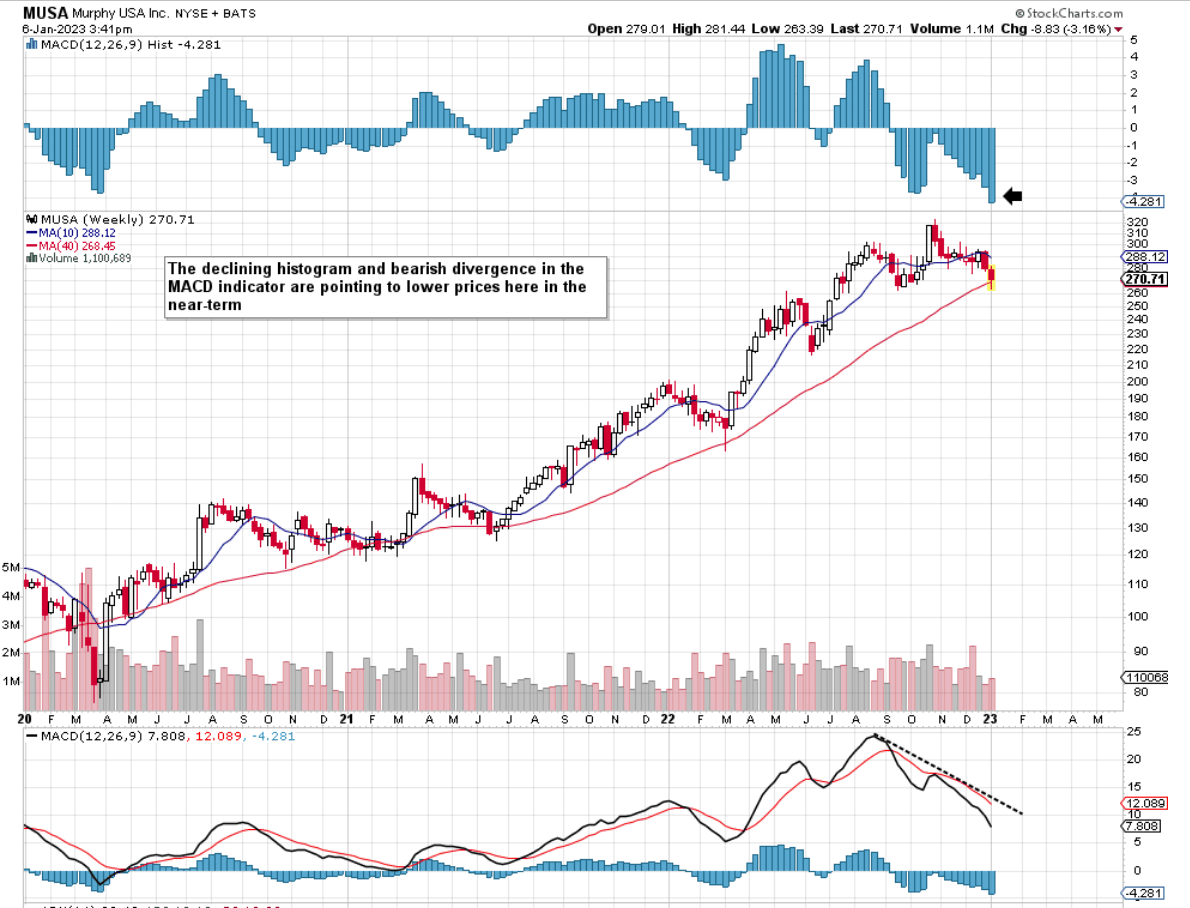
For one, the MACD histogram remains well below its corresponding zero line with the stock’s recent down move actually gaining traction to the downside instead of anything else in recent sessions. Secondly, you have the intermediate ADX trend following indicator which just recently triggered a sell signal to the downside. In saying this considering that MUSA remains in a bull market as no significant technical damage has been inflicted yet (the declining 10- week moving average remains above the 40-week for example), this ADX sell-signal could very well end up being another whipsaw which will iron itself out in due time. Therefore, let’s go to the daily chart for more insights on the future share-price direction in Murphy USA Inc.
On the daily chart, we see a potential head and shoulders topping pattern which in fact has already broken below the neckline to the downside. As we see below, the 200-day moving average stopped the decline which most likely means that shares may test that neckline once more on the upside. The worrying indicator on the daily chart is the volume trend which demonstrates how selling volume has taken precedence in recent sessions especially once support was broken through. All eyes now point to the stock’s 200-day moving average of approximately 265.61 per share. If this level fails, shares could have some distance to go before finding a firm bottom.
MUSA Daily Chart (Stockcharts.com)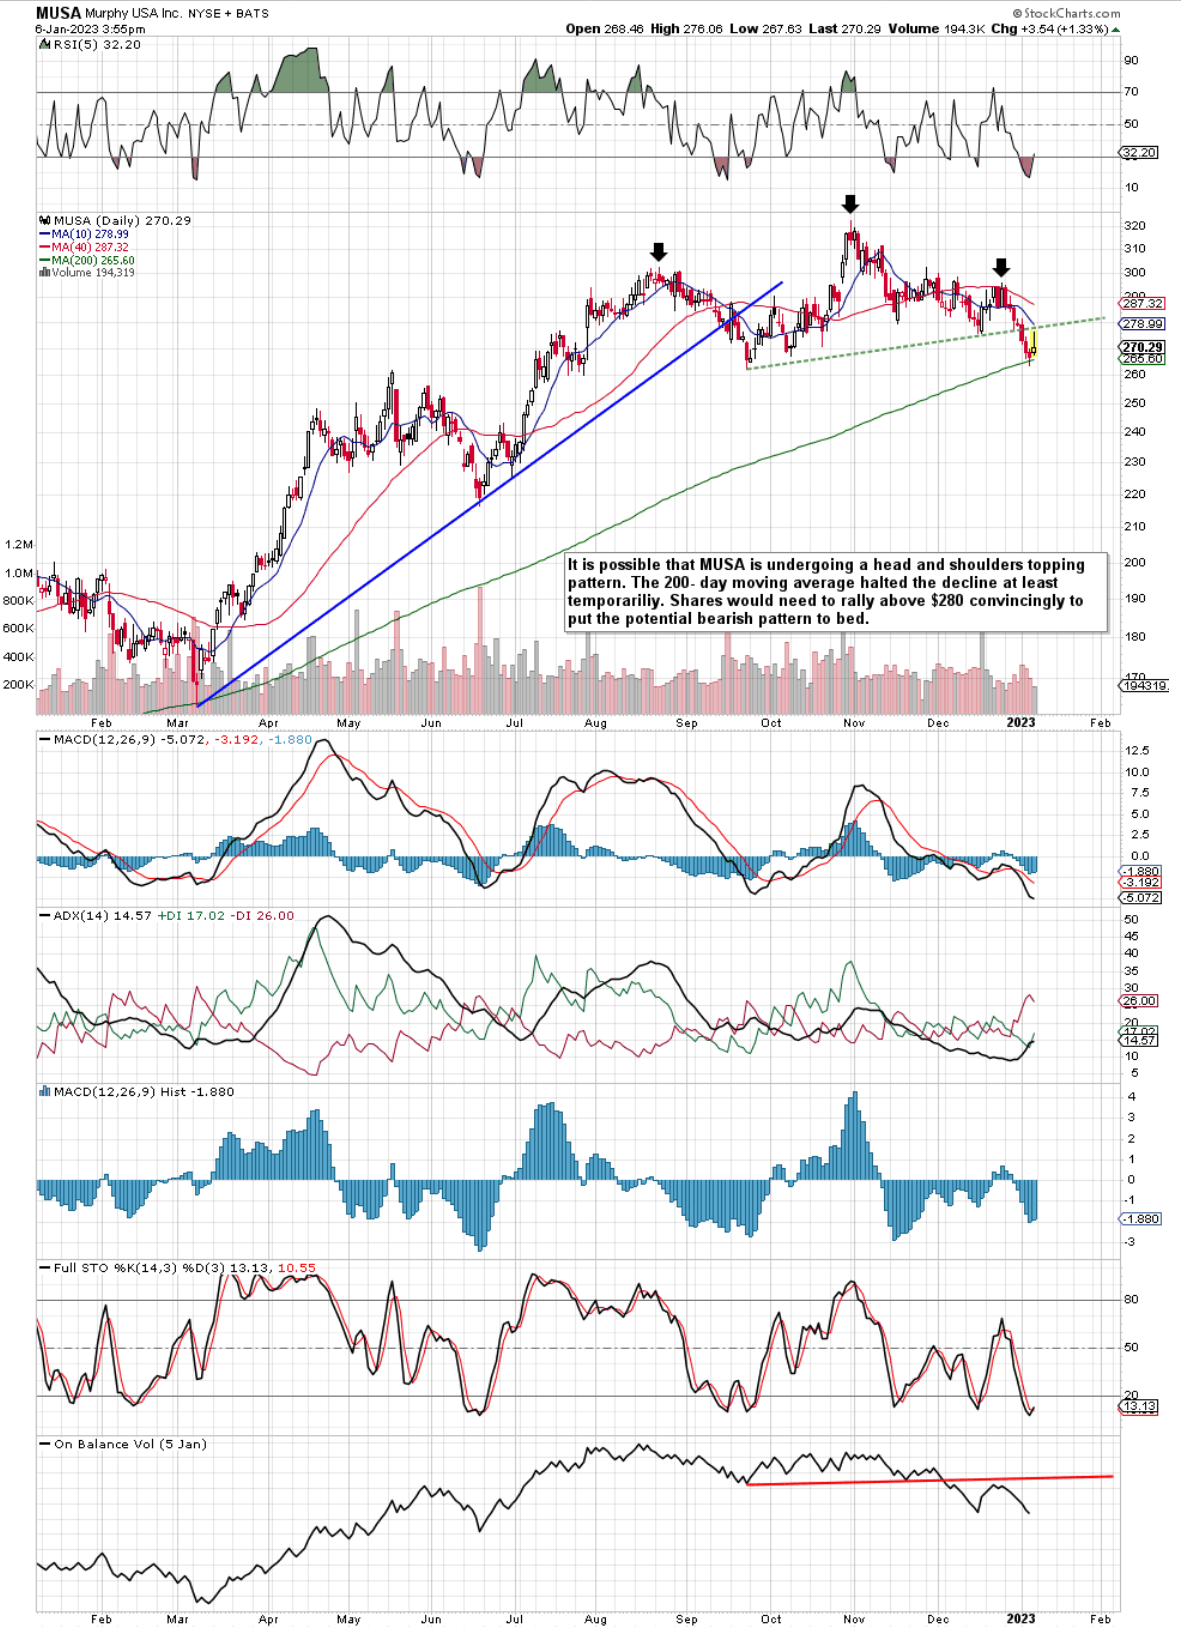
Q3 Earnings
When we delve into MUSA’s recent third-quarter earnings report, we see strong growth rates across several metrics. Sales jumped to $6.2 billion & net profit almost hit $220 million for the quarter. Although these trends produced elevated free cash flow, management depleted the company cash balance by some $47 million in the quarter.
Suffice it to say, when generated cash is going out the door primarily due to the prioritization of share buybacks ($211 million in Q3 alone), this may boost earnings per share over the near-term but forward-looking growth rates (due to not enough funds being invested over time) may not be sufficient to justify MUSA’s valuation.
Adjusted Book Multiple
Furthermore, we must remember that shares of MUSA are just off their all-time highs. Aggressive buybacks are usually done by management when undervaluation is clearly evident. MUSA’s stated book multiple for example comes in at a very overextended 7.87 but the real or “adjusted” book multiple is something much lower than the stated multiple. When we add back in the company’s sizeable treasury stock (shares already bought back but yet to be retired) of $2.394 billion to the stated shareholder equity ($766 million), we get an adjusted equity total of $3.16 billion. Therefore working off a present market cap of $6.103 billion, our adjusted trailing price to book multiple would come in at a much more reasonable 1.93. Suffice it to say, when we see the price of Murphy’s earnings and take into account the adjusted book multiple above, shares are not expensive compared from a valuation perspective to historical multiples
Adjusted ROE
However, if we used the same adjusted equity total of $3.16 billion, the company’s return on equity metric from a profitability standpoint would be in turn greatly reduced from the stated number. ROE percentages many times come in bloated due to a very low equity total on the balance sheet. Therefore, when we work off a trailing net profit tally of $664 million, the adjusted ROE would now come in at 21%. Still though, not a bad number when compared to the sector average of 12.8%.
EPS Forward-Looking Expectations
From a growth standpoint, earnings are expected to fall by over 30% in fiscal 2023 so this indeed (given the market is a forward-looking mechanism) is the area that has led to recent weakness in the share price. However, the bottom-line EPS number of $4.82 for fiscal 2023 has increased significantly in recent months so if this trend continues in earnest, any potential downswing in the share price of Musa may be limited in its duration.
MUSA Consensus Earnings Estimates (Seeking Alpha)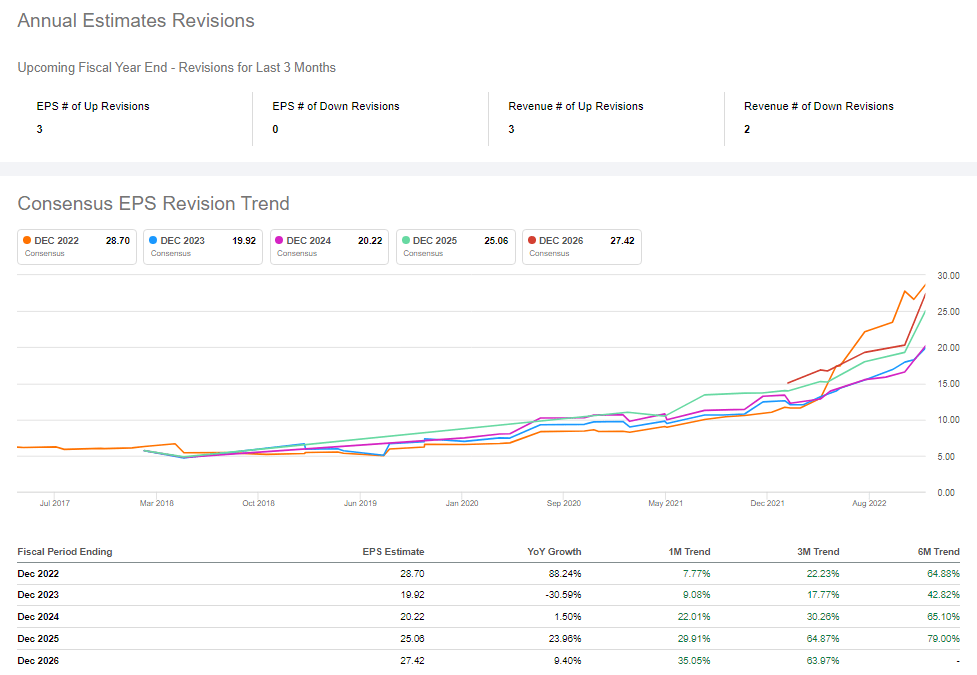
Conclusion
To sum up, from a core valuation & profitability standpoint, Murphy USA does not actually look in that bad a shape considering the gains the company has enjoyed in recent years. Growth though is expected to slow, however, which the market is beginning to price in. Let’s see if the stock’s 200-day moving average can continue to hold as we head into Murphy’s fourth-quarter earnings announcement. We look forward to continued coverage.
Be the first to comment