

metamorworks
Introduction
The current bear market has been particularly merciless to technology-oriented companies (especially those without significant earnings), but also to companies that are generally sensitive to economic cycles. Honeywell International Inc. (NASDAQ:HON) is one such example, and the stock is down more than 25% since its all-time high in mid-2021. Honeywell is a highly profitable and generally well-managed company that has been on my radar for quite some time.
The best companies rarely change hands on the cheap, and Honeywell is no exception to that rule. Buffett rightly said that great companies at a fair price should be preferred over fair companies at a low price. Honeywell is one such example and its stock currently trading at a P/E of just under 20. In this article, I’ll offer my thoughts on the company, particularly in the context of its ability to weather the coming recession and whether I think Honeywell is a good investment in the $170s.
Company Overview
Honeywell’s market capitalization and enterprise value (including pension and lease obligations) are currently around $121 billion and $132 billion, respectively, identifying Honeywell as blue-chip company with a relatively low amount of debt.
Honeywell is a company with a long history and its brand name dates back to 1906. Over the decades, it has become an industrial conglomerate that invents and commercializes technologies that address energy, safety, security, air travel, productivity, and global urbanization related topics. The COVID-19 pandemic and the associated business closures and related supply chain disruptions have fueled demand for technologies that increase efficiency, productivity and reliability. Honeywell plays a very important role in this regard, as the company is uniquely positioned to blend physical products with software to serve its customers around the world in this respect.
The company operates through four segments: Aerospace, Honeywell Building Technologies, Performance Materials and Technologies, and Safety and Productivity Solutions. A brief summary of each segment can be found in Honeywell’s 2021 10-K on pages 6 and 7. Figure 1 shows the company’s 2021 segment sales and highlights the main reason for the stock’s sharp drop in early 2020 – the company is very dependent on the aerospace sector, which is also its most profitable segment (profit margin of 28% in 2021). Sales of this segment declined 4% and 18% YoY in 2021 and 2020, respectively. Honeywell Building Technologies and Performance Materials and Technologies are similarly profitable with profit margins in the low-20% range and Safety and Productivity Solutions is Honeywell’s least profitable segment with a 2021 profit margin of only 13%.
Figure 1: Honeywell’s 2021 segment sales (own work, based on the company’s 2021 10-K)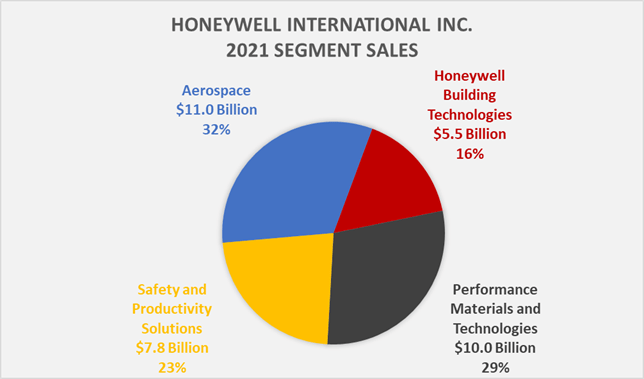
Growth and Profitability
As an industrial company, Honeywell’s sales are likely to be fairly cyclical. In 2009, net sales declined by 15%, but the company’s backlog actually increased slightly (Figure 2). Largely because of Honeywell’s significant involvement in aerospace, sales at the corporate level declined 5.4% in 2020. Thanks to a relatively much stronger backlog than during the Great Recession (80% vs. 36% of net sales in 2021 and 2007, respectively), I believe Honeywell should be able to weather also a prolonged recession relatively well. The company’s operating margin is also much stronger than it was a decade ago, improving from mostly below 10% to typically above 20%.
Figure 2: Honeywell’s net sales and order backlog since 2006 (own work, based on the company’s 2007 to 2021 10-Ks)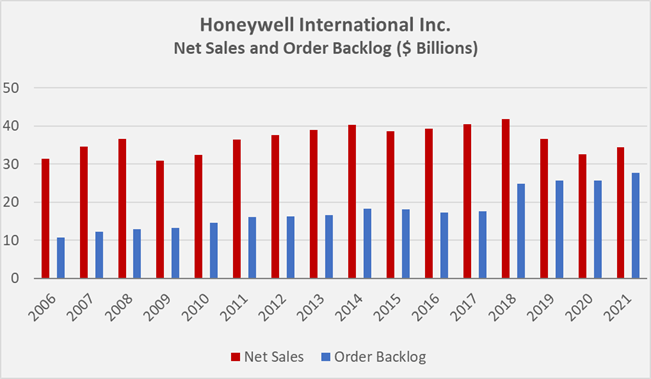
While Honeywell’s backlog continues to grow, its net sales have increased only modestly since the Great Recession, at a compound annual growth rate (CAGR) of 0.9% per year since 2010. This is partly due to Honeywell growing through portfolio optimizations, divesting underperforming or no longer important assets and acquiring assets with more promising growth prospects. In this way, the company has been able to grow its normalized free cash flow (nFCF) at a CAGR of 3.4% (Figure 3).
Part of the free cash flow growth is certainly attributable to working capital management related optimizations: Honeywell’s cash conversion cycle decreased from 70 days in 2010 to 52 days in 2021 (three-year average of 55 days).
Figure 3: Honeywell’s free cash flow since 2010, normalized with respect for working capital movements and after deducting stock-based compensation expenses and impairment charges (own work, based on the company’s 2010 to 2021 10-Ks)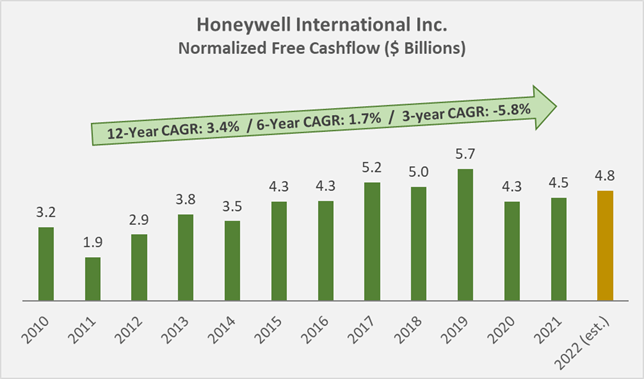
The company’s asset turnover rate has been declining over the past decade, from about 0.9 in 2010 to 0.5 in 2021. The pandemic is at least partially responsible for this trend, as Honeywell’s turnover rate was still above 0.6 in 2019. By comparison, 3M Company’s (MMM) turnover rate is still above 0.8 but has also declined slightly over the past decade. I don’t think Honeywell’s declining turnover ratio is too worrisome, as the company continues to generate very high returns on capital. Both ROIC (based on net operating profit after taxes) and CROIC (based on nFCF) are well above Honeywell’s cost of capital. Figure 4 compares ROIC and CROIC to Honeywell’s weighted average cost of capital (WACC), using a 7% equity risk premium. It should be noted that the comparison with WACC is not entirely correct in an academic sense, since profitability ratios based on free cash flow should be compared with the cost of equity. In this way, Honeywell’s excess CROIC would be somewhat lower, but given the company’s relatively modest leverage, WACC is almost identical to the cost of equity anyway. Falling interest rates over the last decade have been the main cause of the company’s growing excess ROIC and CROIC. Of course, this effect is expected to reverse as interest rates rise, but Honeywell’s profitability is still expected to remain high. Competitor MMM is still slightly more profitable than Honeywell, with average ROIC and CROIC of 19% and 14%, respectively. Of course, MMM’s weighted average cost of debt is somewhat higher (about 60 basis points), and partly due to the significant risks associated with litigation, a higher cost of equity is considered appropriate.
Figure 4: Honeywell’s (cash) return on invested capital and its weighted average cost of capital based on a 7% equity risk premium (own work, based on the company’s 2010 to 2021 10-Ks)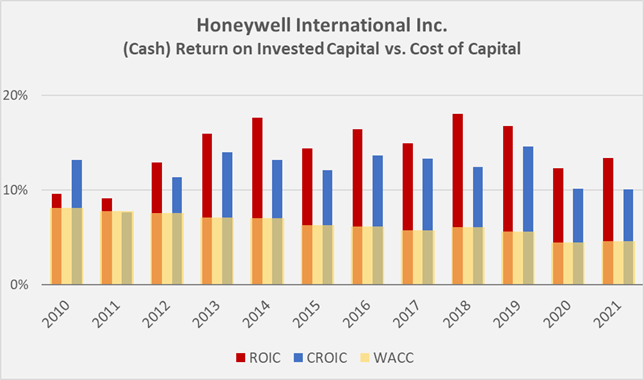
Financial Stability
Companies that grow through acquisitions can have excessive debt on their balance sheets and are often required to record impairment charges to goodwill. However, Honeywell is a very moderately leveraged company with a projected 2022 net debt to nFCF ratio of 1.8x, taking management’s 2022 free cash flow guidance into account (Figure 5). Impairment charges are also barely significant at less than 2% of nFCF generated by Honeywell between 2010 and 2021.
Honeywell’s long-term debt is rated A with a stable outlook by Standard and Poor’s, while its competitor 3M Company still has a rating one notch better, albeit with a negative outlook.
Figure 5: Honeywell’s net debt to nFCF (own work, based on the company’s 2010 to 2021 10-Ks and the Q1 2022 earnings release)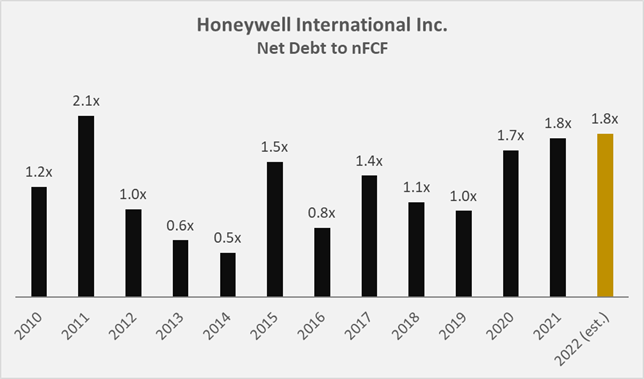
Interest coverage is very reassuring at 14 times NFCF for 2021. During the Great Recession, Honeywell’s interest coverage was below 7 times NFCF at times, which is still not a concern, but clearly shows that Honeywell’s financial stability has improved.
As a company with a long history, significant pension-related liabilities were to be expected. However, such liabilities are not significant in the case of Honeywell. While Honeywell had $1.5 billion in related liabilities on its balance sheet in 2010, this position has fallen to about $200 million by the end of 2021.
The low interest rate environment has allowed many companies to buy back shares with cheaply financed money, boosting earnings per share. Honeywell has indeed bought back a significant amount of its own stock, but certainly does not deserve the inglorious reputation of engaging in financial engineering: since 2010, the company has generated more than $48.5 billion in nFCF, but has spent only $25.7 billion on buybacks and $21.8 billion on dividends.
To estimate Honeywell’s interest rate risk, I have analyzed the company’s upcoming debt maturities (Figure 6). At first glance, the maturity profile looks worrisome, with more than 50% of the debt maturing within the next five years. However, it should be remembered that Honeywell is an A-rated company and is expected to generate nearly $5 billion in nFCF in 2022 alone. In the hypothetical (and highly unlikely) scenario that Honeywell were to suspend its dividend and cease buybacks, the company could repay all of its debt in less than two years.
Figure 6: Honeywell’s upcoming debt maturities (own work, based on the company’s 2021 10-K)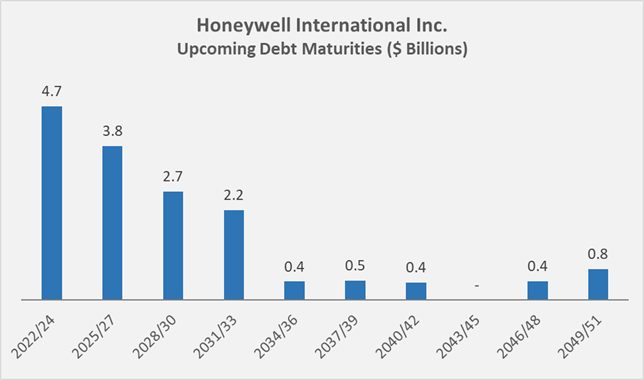
Shareholder Returns and Dividend Safety
Honeywell has paid a dividend since at least 1972, but since the company did not increase its payout in 2009, it currently has only 12 consecutive years of increases. The current annual dividend of $3.92 represents a dividend yield of approximately 2.3%, and the ten-year CAGR is a very respectable 10.7%. Growth has declined in recent years (Figure 7), but I would attribute this mostly to the pandemic. The payout ratio of about 60% of nFCF is very manageable, so it is very likely that dividend growth will return to pre-pandemic rates as the company recovers from the difficult environment. However, with an initial yield of 2.3%, it will take quite a while to achieve a significant yield on cost. For example, at an average growth rate of 8% per year, an investor would have to wait until 2030 to achieve a yield of over 4%. In the context of dividend growth, it should also be kept in mind that management did not increase the dividend during the Great Recession. However, given Honeywell’s strengthened position due to its high-demand products and services and its much higher relative order backlog compared to 2008, I see no reason why management should leave the growth path again.
In addition to dividends, the company returns excess free cash flow to shareholders via share buybacks. In this way, the number of diluted weighted average shares decreased from 781 million in 2010 to 691 million in Q1 2022, resulting in a moderate 13% increase in earnings per share over this period. As mentioned above, the company’s dividend and repurchase policy is very responsible and as a result, the company enters the likely upcoming recession with a strong balance sheet.
Figure 7: Honeywell’s dividend growth rate (own work, based on the company’s 2009 to 2021 10-Ks)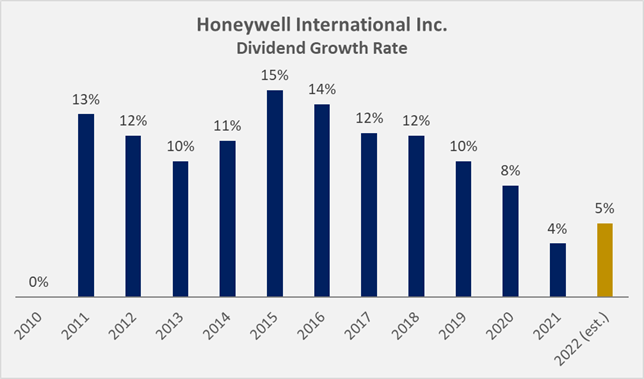
Valuation and Verdict
Honeywell is obviously a solid, well-managed and broadly diversified industrial company. The stock is down 25% from its all-time high of over $230, but considering historical valuations over the past twelve years, it is still somewhat expensive – even though the increased profitability likely warrants a certain premium.
In terms of price-to-sales, HON is currently trading at 3.5 times sales, while the historical average is only 2.4 times sales. One could argue that such a company should not be valued based on sales. But the shares are also still quite expensive in terms of price-to-nFCF (22x historical average versus 27x current). Honeywell’s free cash flow yield is currently less than 4%, compared to nearly 7% for MMM. The latter is of course weighed down by significant uncertainties related to litigation.
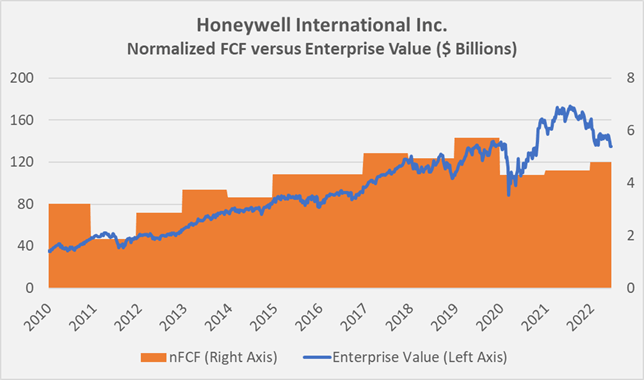
Since they are not available via FAST Graphs, I have created similar graphs based on normalized FCF. Figure 8 compares nFCF per share to the stock price, while Figure 9 considers the entire capital structure. It is clear that Honeywell is trading at a much more reasonable level now than it was a few months ago, but I still believe the stock is somewhat overvalued and therefore has not opened an entry position in the stock.
However, I believe Honeywell is an excellent company with moderate cyclicality that deserves a place in a well-diversified portfolio, and I could see opening a position in the $150 range. If the stock were to fall to pandemic lows, I definitely would be an aggressive buyer, but I think the likelihood of such a decline is relatively low given Honeywell’s strong backlog and growth prospects.
Figure 8: Overlay of Honeywell’s share price and normalized free cash flow (nFCF) per share (own work, based on the company’s 2010 to 2021 10-Ks and the weekly closing share price of HON) Figure 9: Overlay of Honeywell’s enterprise value and normalized free cash flow (nFCF) (own work, based on the company’s 2010 to 2021 10-Ks and the weekly closing share price of HON)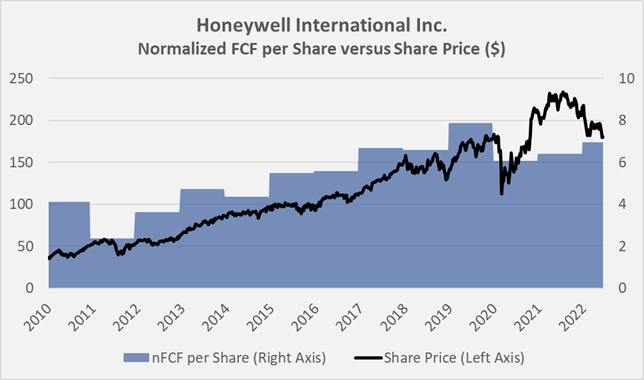
Thank you very much for taking the time to read my article. In case of any questions or comments, I’m very happy to read from you in the comments section below.
Be the first to comment