

morkeman
Murphy Oil Corp. (NYSE:MUR) is an independent global oil and natural gas exploration and production company that I have followed on Seeking Alpha since October 2017.
The company released its third-quarter 2022 results on November 3, 2022.
Note: This article is an update of my preceding article, published on October 4, 2022.
1 – 3Q22 Results Snapshot
The company posted a third-quarter 2022 adjusted net income, excluding discontinued operations and other one-off items, of $1.84 per diluted share, up significantly from $0.24 per share last year.
MUR Financial results 3Q22 Presentation (MUR Presentation)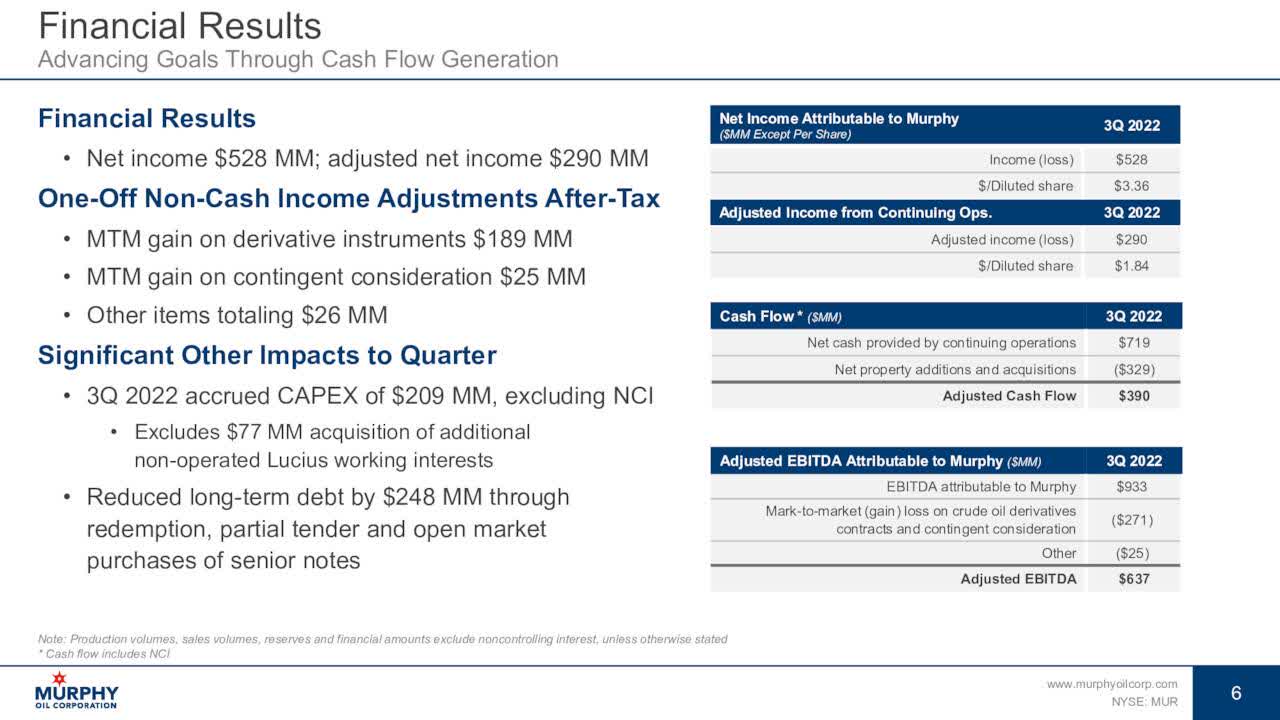
Murphy Oil’s revenues of $1,303.4 million were better than expectations. Revenues improved from the prior-year quarter of $630.7 million.
The E&P company produced 188.487k Boep/d in the third quarter, comprising 57% of liquids. Murphy Oil’s total costs and expenses were $550.3 million, up from $407.3 million in the prior-year quarter.
Murphy Oil declared a quarterly dividend of $0.25 per share in the third quarter of 2022.
Finally, Murphy Oil hedged 25K barrels of oil per day at a weighted average put price of $63.24 per barrel and a weighted average call price of $75.20 for 2022.
MUR Hedging position (MUR Presentation)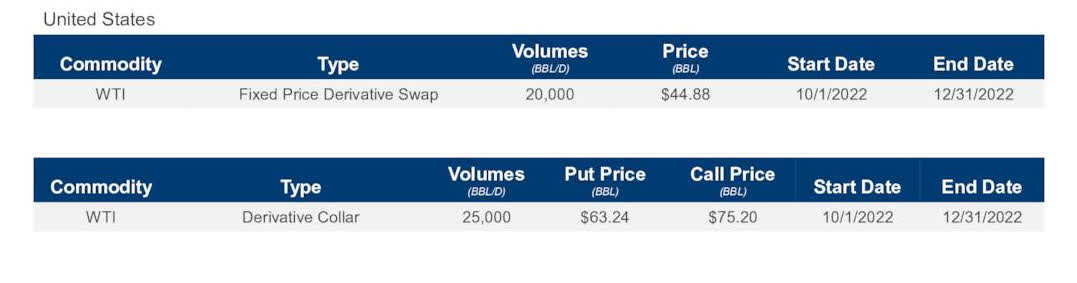
2 – Stock Performance And Commentary
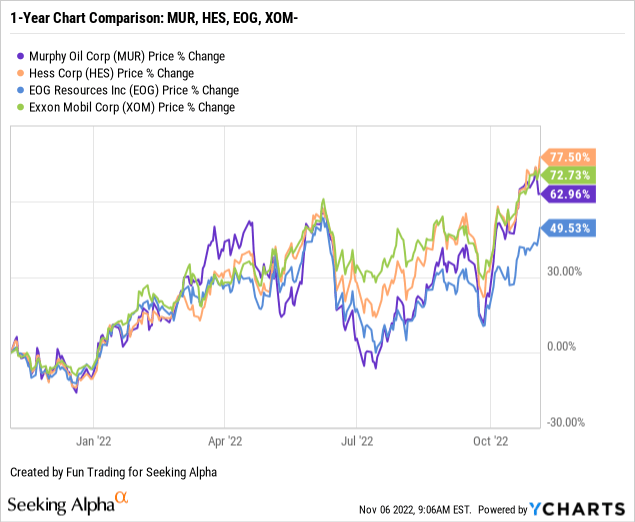
MUR is now up 63% on a one-year basis. The stock is following the general trend in this sector, rebounding from a period of consolidation.
CEO Roger Jenkins said in the conference call:
On top of an excellent quarter both operationally and financially with consensus beats across the board, Murphy continues to deliver a strong value proposition. Our ongoing execution excellence especially in our oil-weighted assets ensures that we remain a long-term sustainable company as we operate safely and with focus on continual improvement in our carbon emissions intensity.
What I like the most about this small E&P is the producing assets in the Gulf of Mexico and their growth potential.
The company now has six of seven producing wells from the Khaleesi, Mormont, and Samurai field development projects, with gross production volumes, significantly exceeding expectations and achieving a record 120K Boep/d gross at the facility.
MUR Offshore project near completion (MUR Presentation)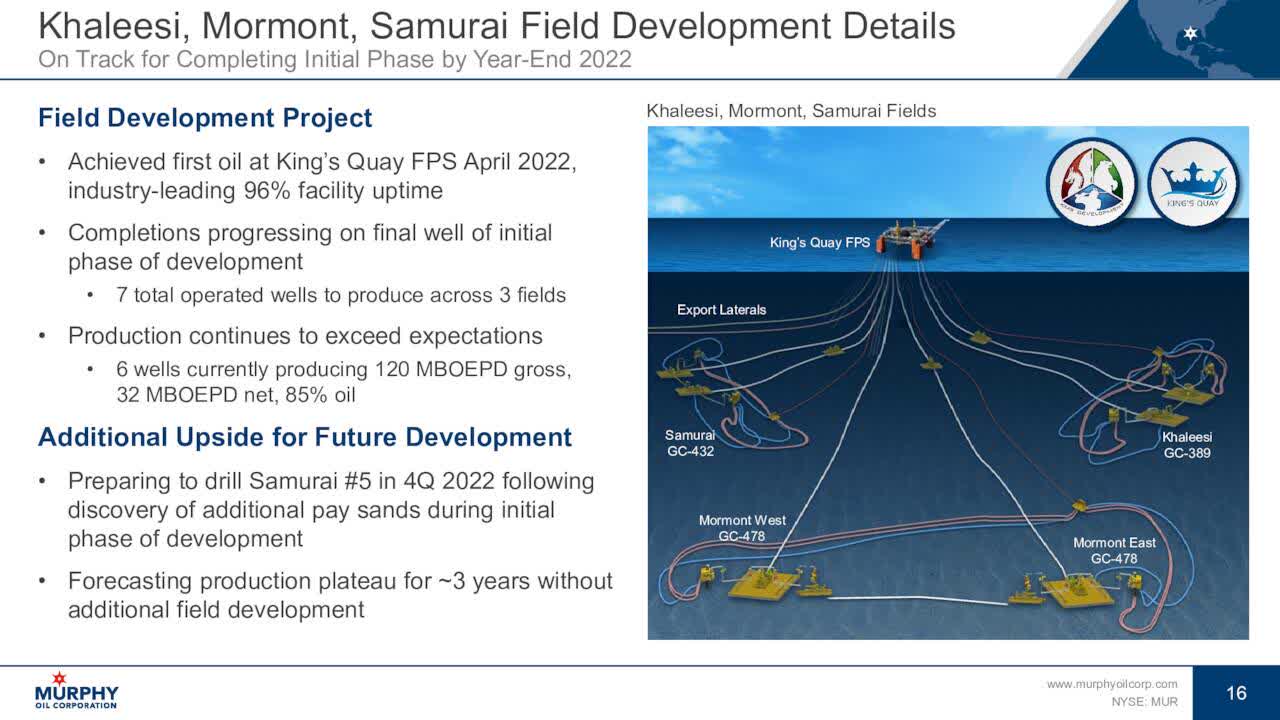
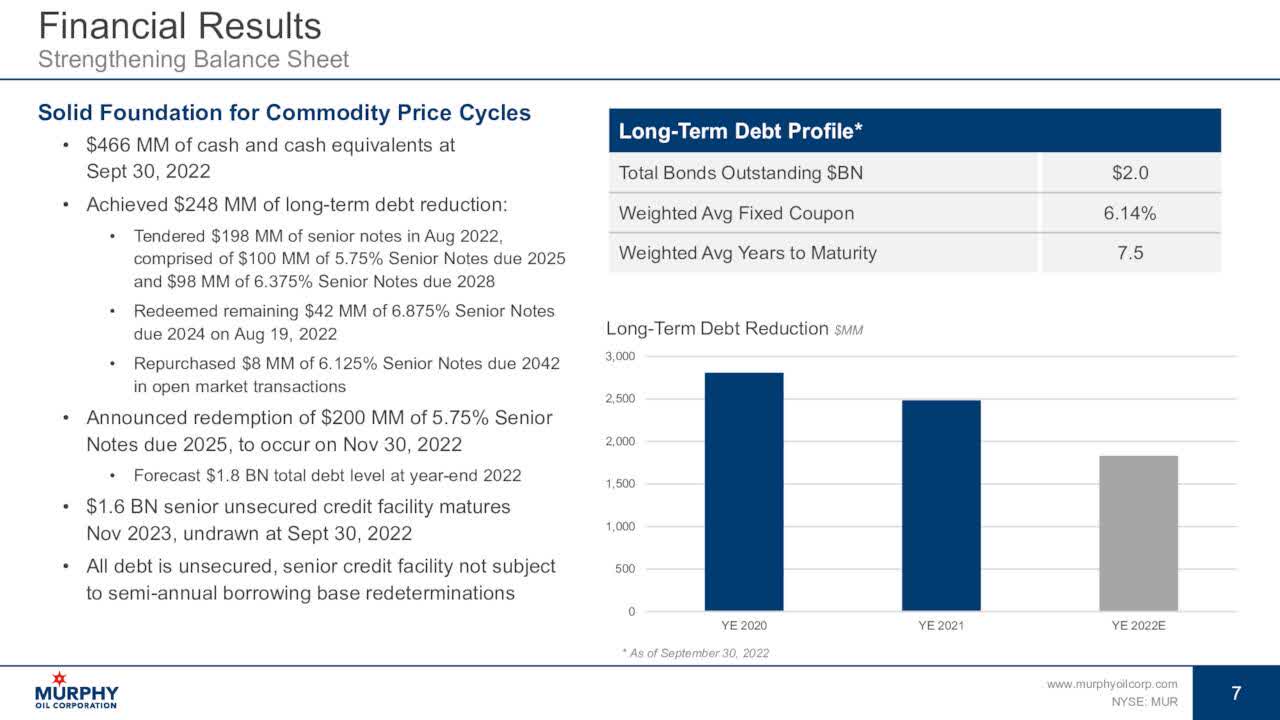
Furthermore, I believe the company is doing an excellent job of reducing its debt which is crucial.
Thus, MUR should be considered a good stock for the long term. However, because of the inherent volatility of the oil sector, I recommend trading short-term LIFO for about 40% of your position.
Murphy Oil – Financial Table 3Q22 – The Raw Numbers
| Murphy Oil | 3Q21 | 4Q21 | 1Q22 | 2Q22 | 3Q22 |
| Total oil and gas revenues in $ million | 687.55 | 762.3 | 871.37 | 1,196.24 | 1,120.91 |
| Total Revenues and others in $ Million | 630.70 | 739.0 | 552.96 | 1,101.06 | 1,303.43 |
| Net Income in $ Million | 108.46 | 168.4 | -113.34 | 350.56 | 528.43 |
| EBITDA $ Million | 413.18 | 489.76 | 119.51 | 752.77 | 1,004.21* |
| EPS diluted in $/share | 0.70 | 1.08 | -0.73 | 2.23 | 3.36 |
| Operating cash flow in $ Million | 405.00 | 330.9 | 338.33 | 620.91 | 719.49 |
| CapEx in $ Million | 118.92 | 106.2 | 244.91 | 354.41 | 327.15 |
| Free Cash Flow in $ Million | 286.09 | 224.63 | 93.42 | 266.50 | 392.33 |
| Total cash $ Billion | 0.51 | 0.52 | 0.48 | 0.43 | 0.47 |
| Long-Term Debt (including current) in $ Billion | 2.61 | 2.47 | 2.47 | 2.27 | 2.02 |
| Dividend per share in $ | 0.125 | 0.15 | 0.175 | 0.25 | 0.25 |
| Shares outstanding (diluted) in Million | 155.93 | 154.45 | 154.92 | 157.46 | 157.34 |
| Oil Production | 3Q21 | 4Q21 | 1Q22 | 2Q22 | 3Q22 |
| Oil Equivalent Production in K Boe/d | 155.0 | 150.2 | 141.0 | 164.4 | 188.5 |
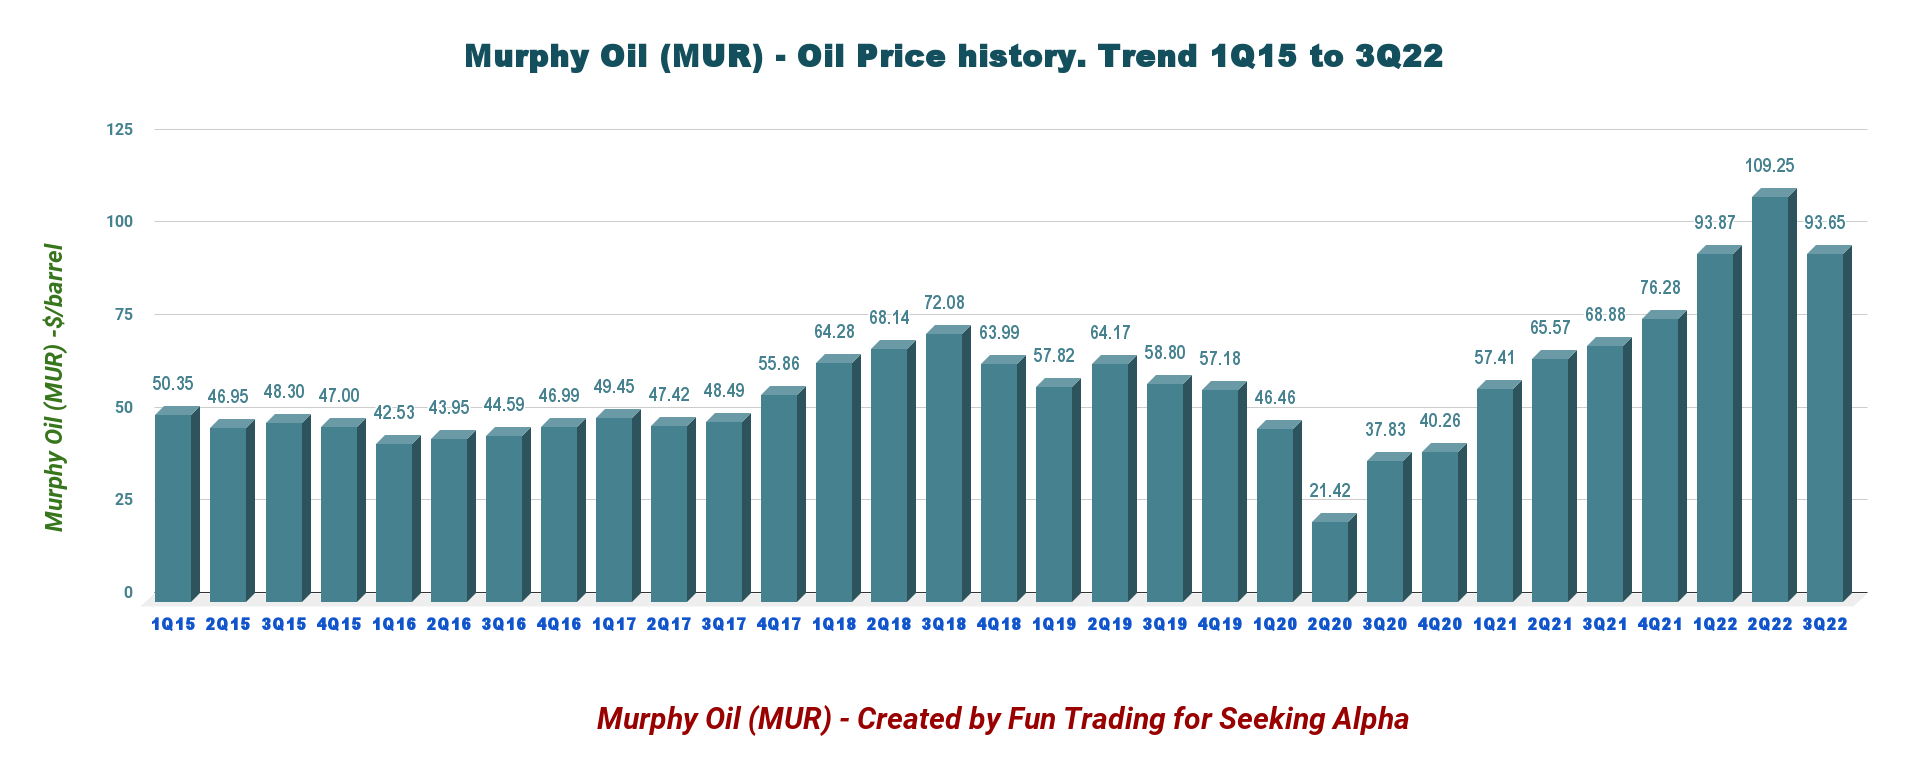
| US Onshore Crude oil price ($/b) | 68.88 | 76.28 | 93.87 | 109.25 | 93.65 |
Source: Murphy Oil 10-Q filing
* Estimated by Fun Trading from the 10Q filing
Analysis: Revenues, Earnings Details, Free Cash Flow, Debt, An Oil & Gas Production
1 – Total Revenue and Others (Hedging) was $ Million In 3Q22
MUR Quarterly Revenues history (Fun Trading) Note: Revenues from oil and gas were $1,120.91 million. MUR Quarterly revenues per segment in 3Q22 (Fun Trading) Murphy Oil reported a net income of $528.43 million, or $3.36 per diluted share, for the third quarter of 2022. This compares to $108.46 million or $0.70 per share a year ago.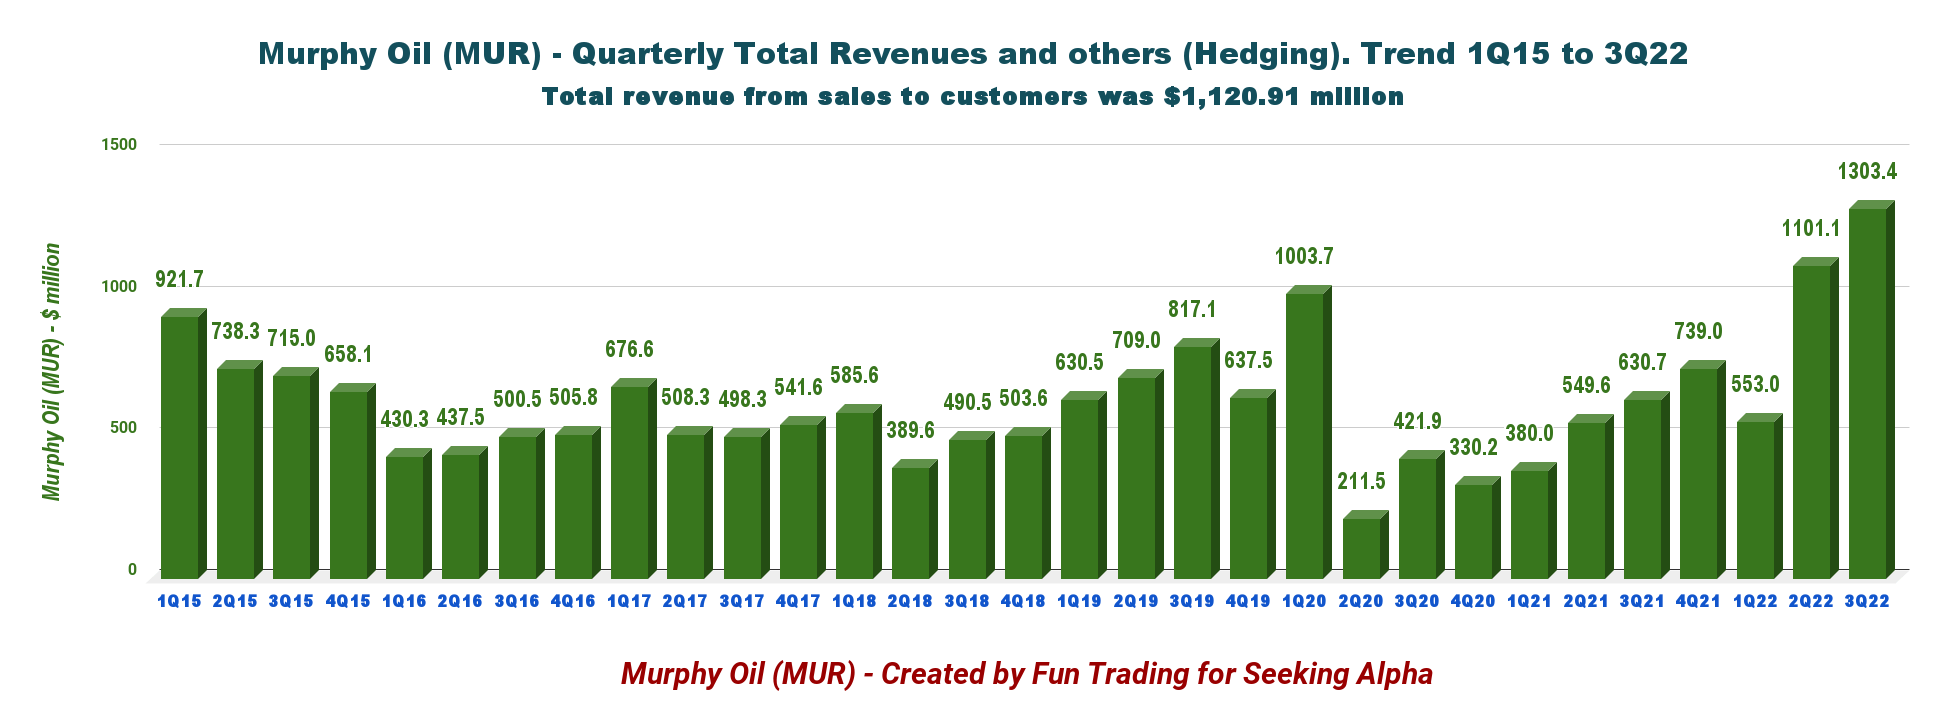
The net cash provided by continuing operations activities in 3Q22 was $719.49 million, compared with $405.0 million in 3Q21.
2 – Free Cash Flow was $392.33 Million in 3Q22
MUR Quarterly Free cash flow history (Fun Trading) Note: The generic free cash flow is cash from operating activities minus CapEx. The company has a different calculation, including divestiture.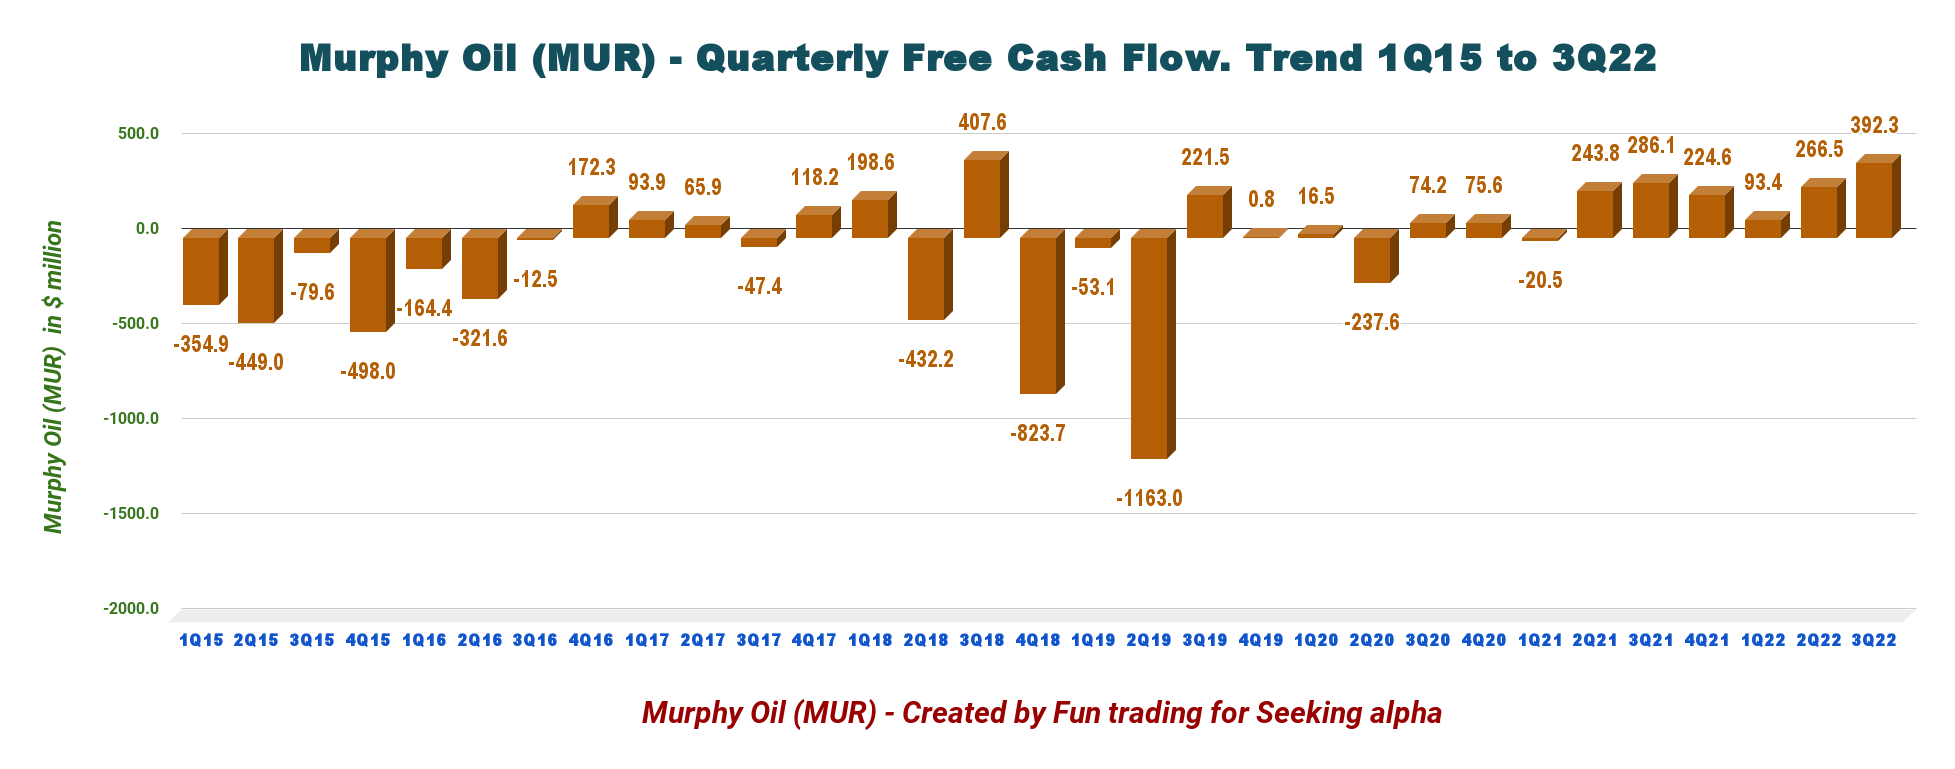
The generic free cash flow was $392.33 million in 3Q22. The trailing 12-month free cash flow is $976.88 million.
The company now pays a quarterly dividend of $0.25 per share. The dividend yield is currently 2.13% which is considered small in this industry.
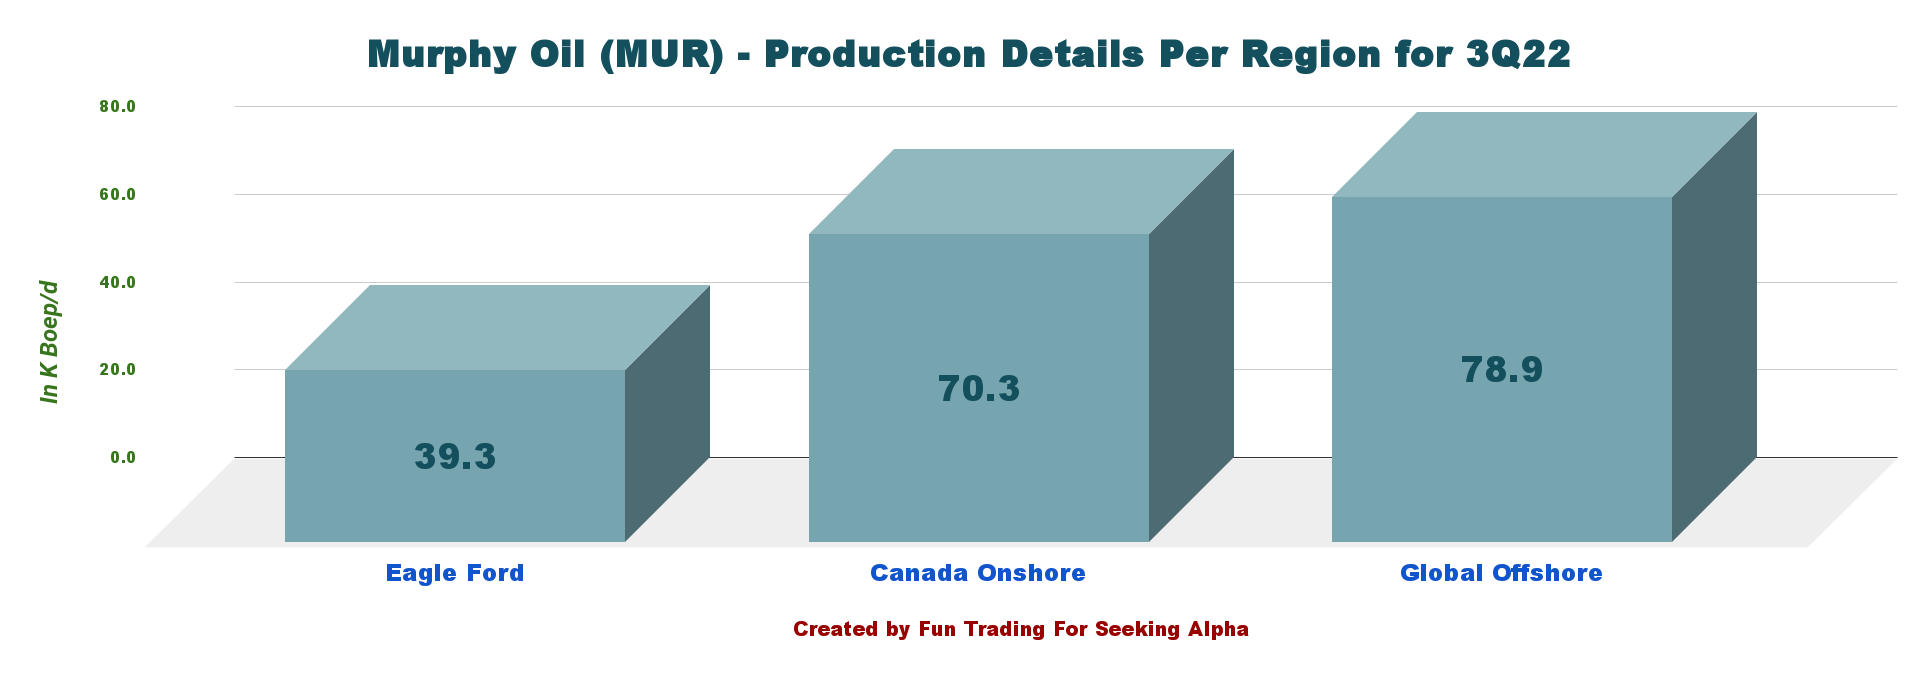
3 – Production was a Total of 188.5k Boep/d in 3Q22
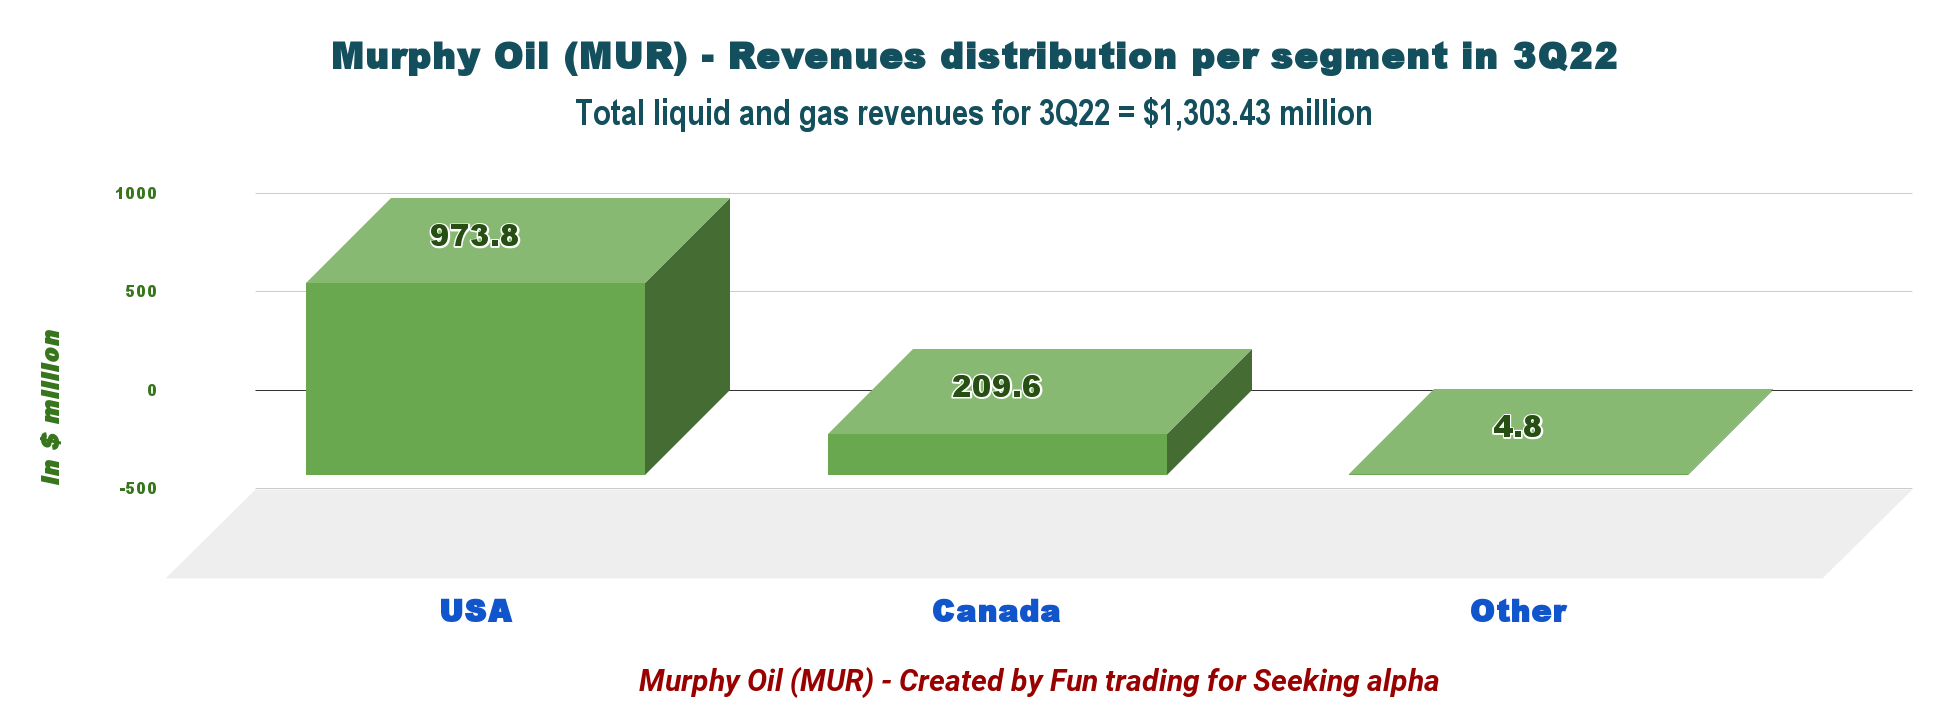
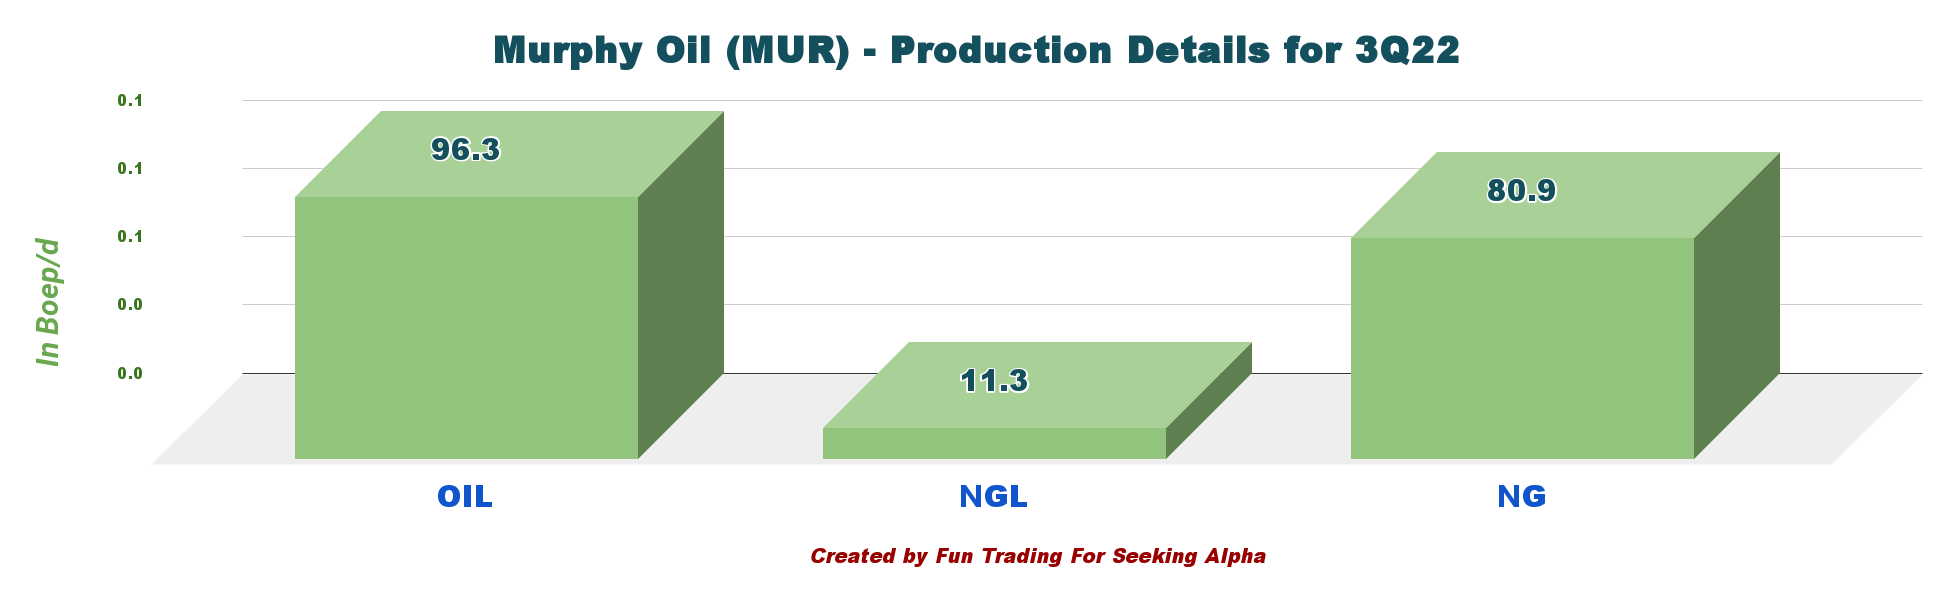
MUR Quarterly Oil Equivalent History (Fun Trading) The company produced 188.487K Boep/d in the Third Quarter, comprising 57% of liquids. The company achieved the upper end of the guidance. The offshore section, mainly the Gulf of Mexico, represents 41.9% of the total output in 3Q22. MUR Quarterly oil production per region 3Q22 (Fun Trading) Onshore US Oil prices were $93.65 a barrel in 3Q22, up significantly from $68.88 realized last year. MUR Quarterly Oil price history (Fun Trading) Below is shown how the equivalent production is spread between oil, NGL, and natural gas. Liquids represent 57.1% of the total output. MUR Production Oil, NGL, NG in 3Q22 (Fun Trading)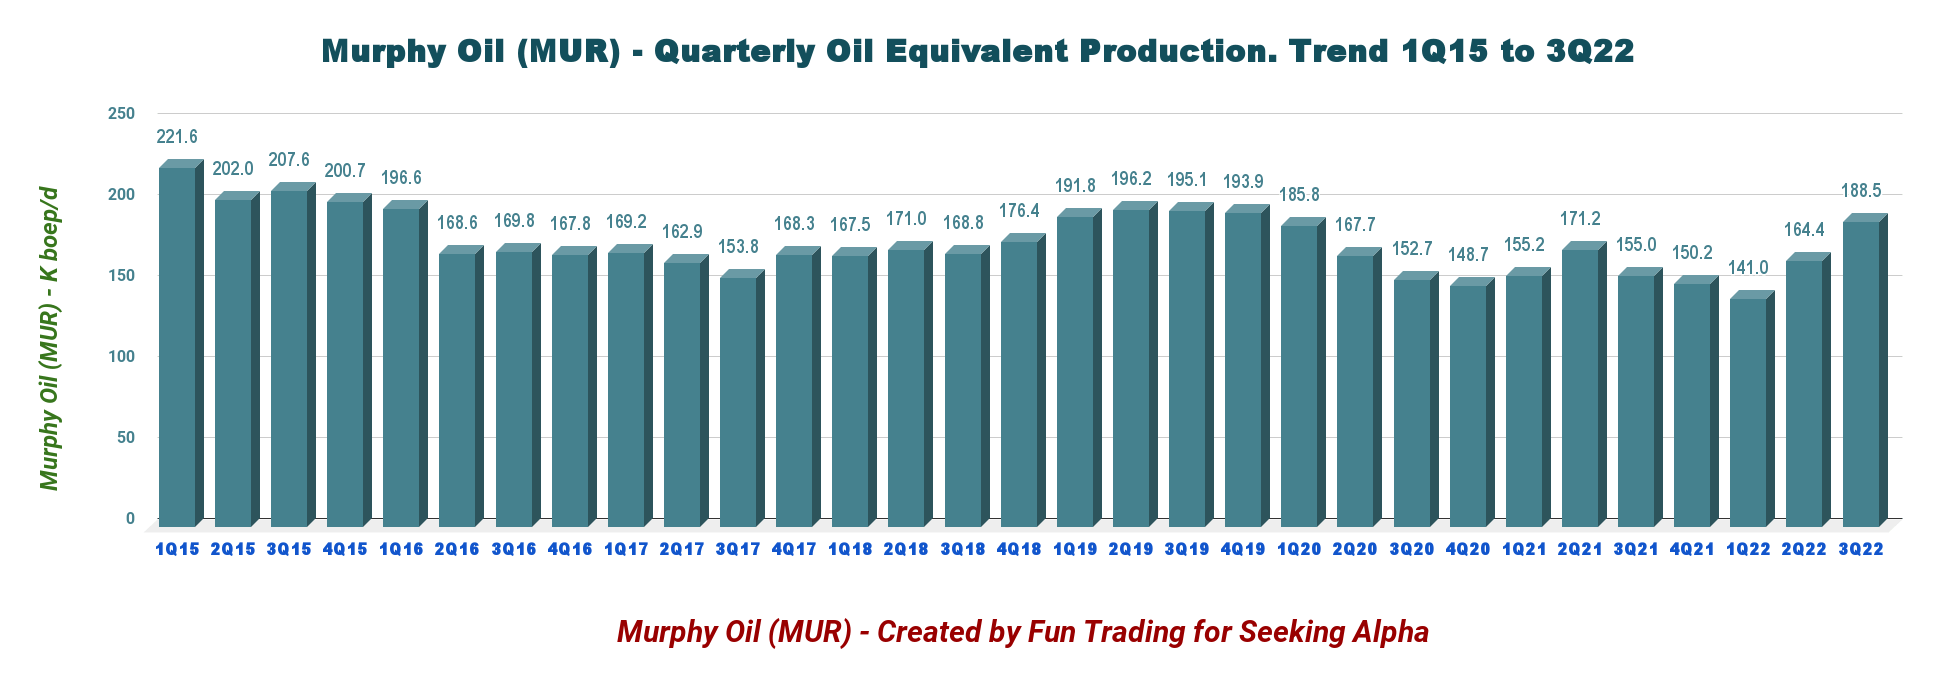
4 – Net Debt going down
Murphy Oil had cash and cash equivalents of $466.0 million as of September 30, 2022, compared with $505.07 million as of September 30, 2021.
MUR Quarterly Cash versus Debt history (Fun Trading) Net Debt is $1.56 billion at the end of September 2022. All Debt is an unsecured senior credit facility, not subject to semi-annual borrowing base redetermination. MUR cut Debt by another $248 million and announced redemption of $200 million of 5.75% Senior Notes due 2025, due to occur on November 10, 2022. MUR has a $1.6 billion undrawn senior unsecured credit facility which matures in November 2023. MUR Debt situation Presentation (MUR Presentation)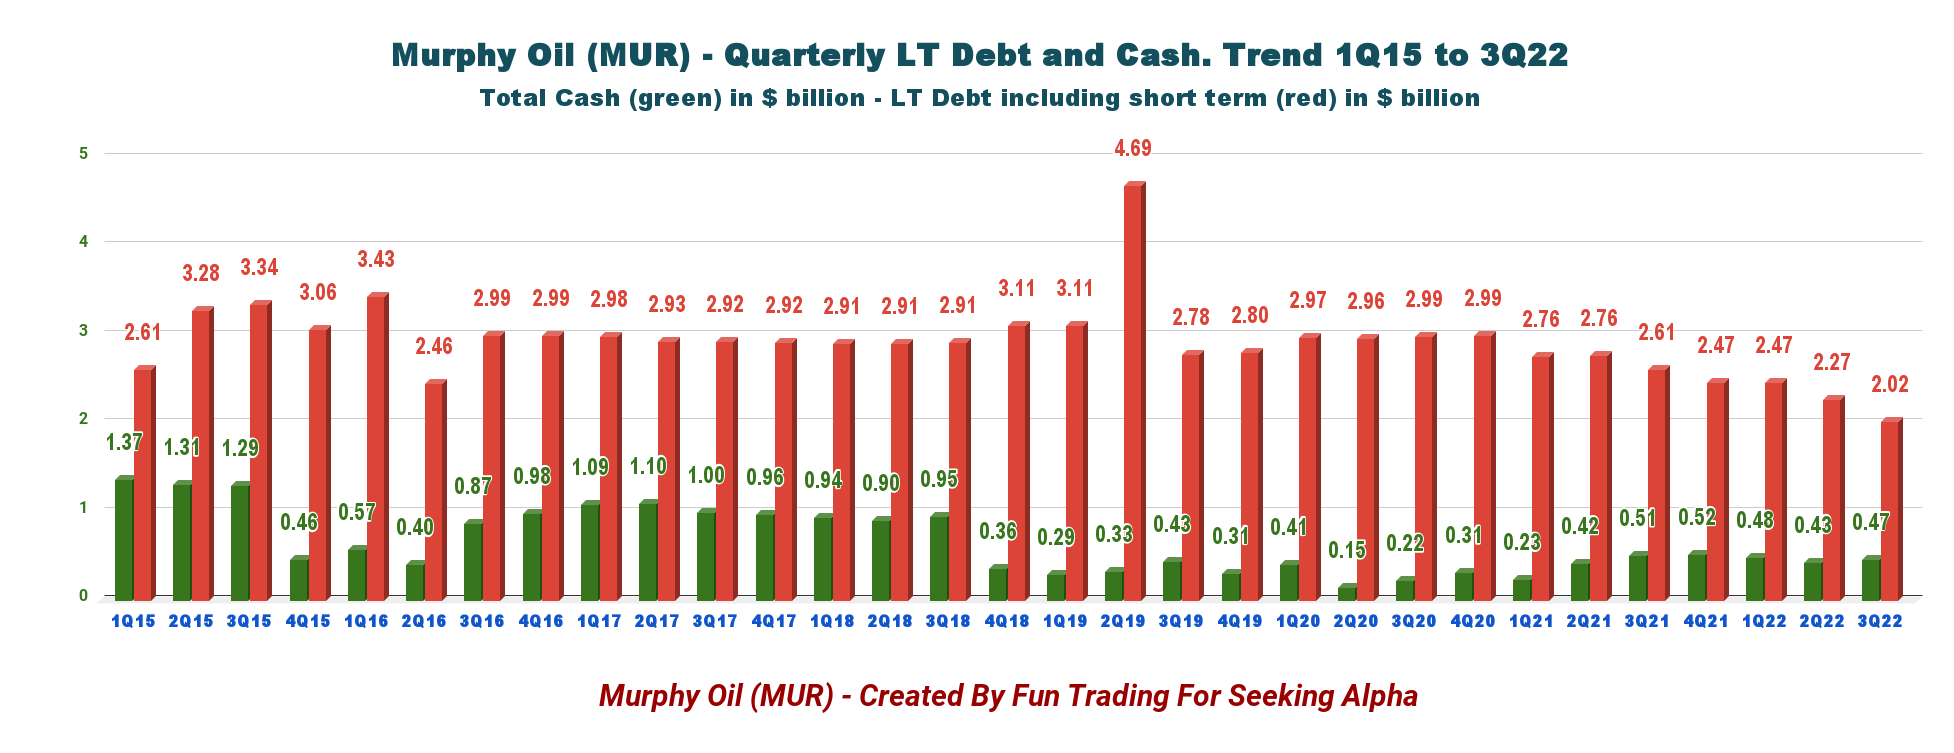
5 – 4Q22 and full-year Guidance
MUR expects its production to be 173.5k-181.5k Boep/d in 4Q22, with FY 2022 164K-172K Boep/d, slightly lower than indicated in the preceding quarter.
Full-year CapEx is between $975-$1,025 million, up from $925 million. It is a big jump compared with 2021 ($688 million).
MUR 2022 Guidance Presentation (MUR Presentation)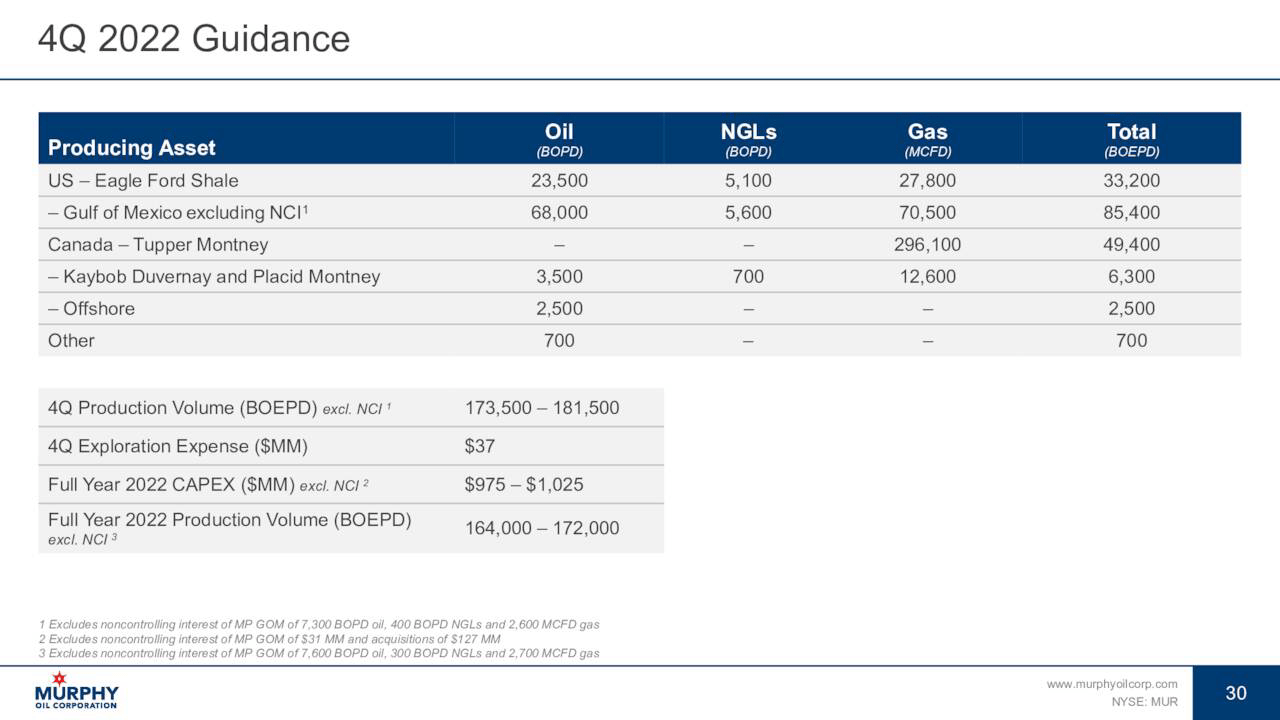
Technical Analysis (Short Term) And Commentary
MUR TA Chart short-term (Fun Trading StockCharts)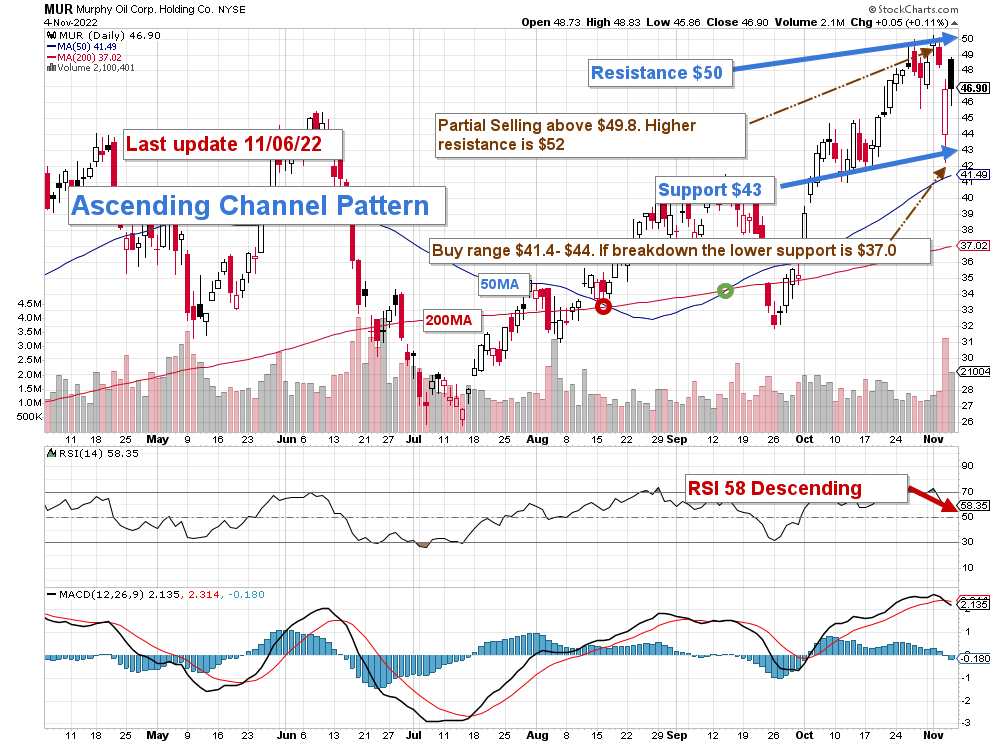
Note: The chart is adjusted for the dividend.
MUR forms an ascending channel pattern with resistance at $50 and support at $43. Ascending channel patterns are short-term bullish, but these patterns often form within longer-term downtrends as continuation patterns.
The Fed’s action against rampant inflation increases the risk of a recession in 2023. Europe has already fallen into recession, and the USA is not far behind. The Fed increased the interest rate by another 75-point in November, and I expect it to increase by 75-point in December. The recession will hurt demand, and it could signal a decline in oil and NG prices early next year.
As I said in my preceding article, we cannot ignore those early signs, and we must protect our MUR investment by adopting a strategy that takes the “best of both worlds.” It is what I promote in my marketplace, “The Gold and Oil corner.”
The trading strategy is to sell LIFO about 50% of your position above $49.8, with possible higher resistance at $52 if oil prices continue their bullish rally.
I suggest accumulating between $41.4 and $44, with potential lower support at $37 if oil prices fall significantly.
Note: The LIFO method is prohibited under International Financial Reporting Standards (IFRS), though it is permitted in the United States by Generally Accepted Accounting Principles (GAAP). Therefore, only US traders can apply this method. Those who cannot trade LIFO can use an alternative by setting two different accounts for the same stock, one for the long term and one for short-term trading.
Warning: The TA chart must be updated frequently to be relevant. It is what I am doing in my stock tracker. The chart above has a possible validity of about a week. Remember, the TA chart is a tool only to help you adopt the right strategy. It is not a way to foresee the future. No one and nothing can.
Author’s note: If you find value in this article and would like to encourage such continued efforts, please click the “Like” button below to vote of support. Thanks
Be the first to comment