

imaginima
Introduction
Murphy Oil Corp. (NYSE:MUR) is an independent global oil and natural gas exploration and production company that I have followed on Seeking Alpha since October 2017.
The company released its second-quarter 2022 results on August 4, 2022. But most importantly, the company released a new investor update in October, raising production guidance by 4K Boep/d (mid-point).
Note: This article is an update of my preceding article published on July 7, 2022.
1 – 2Q22 Results and 3Q22 expectations Snapshot
The company posted a second-quarter 2022 adjusted net income which excludes discontinued operations and other one-off items, $1.93 per diluted share, compared to $0.59 in 2Q21.
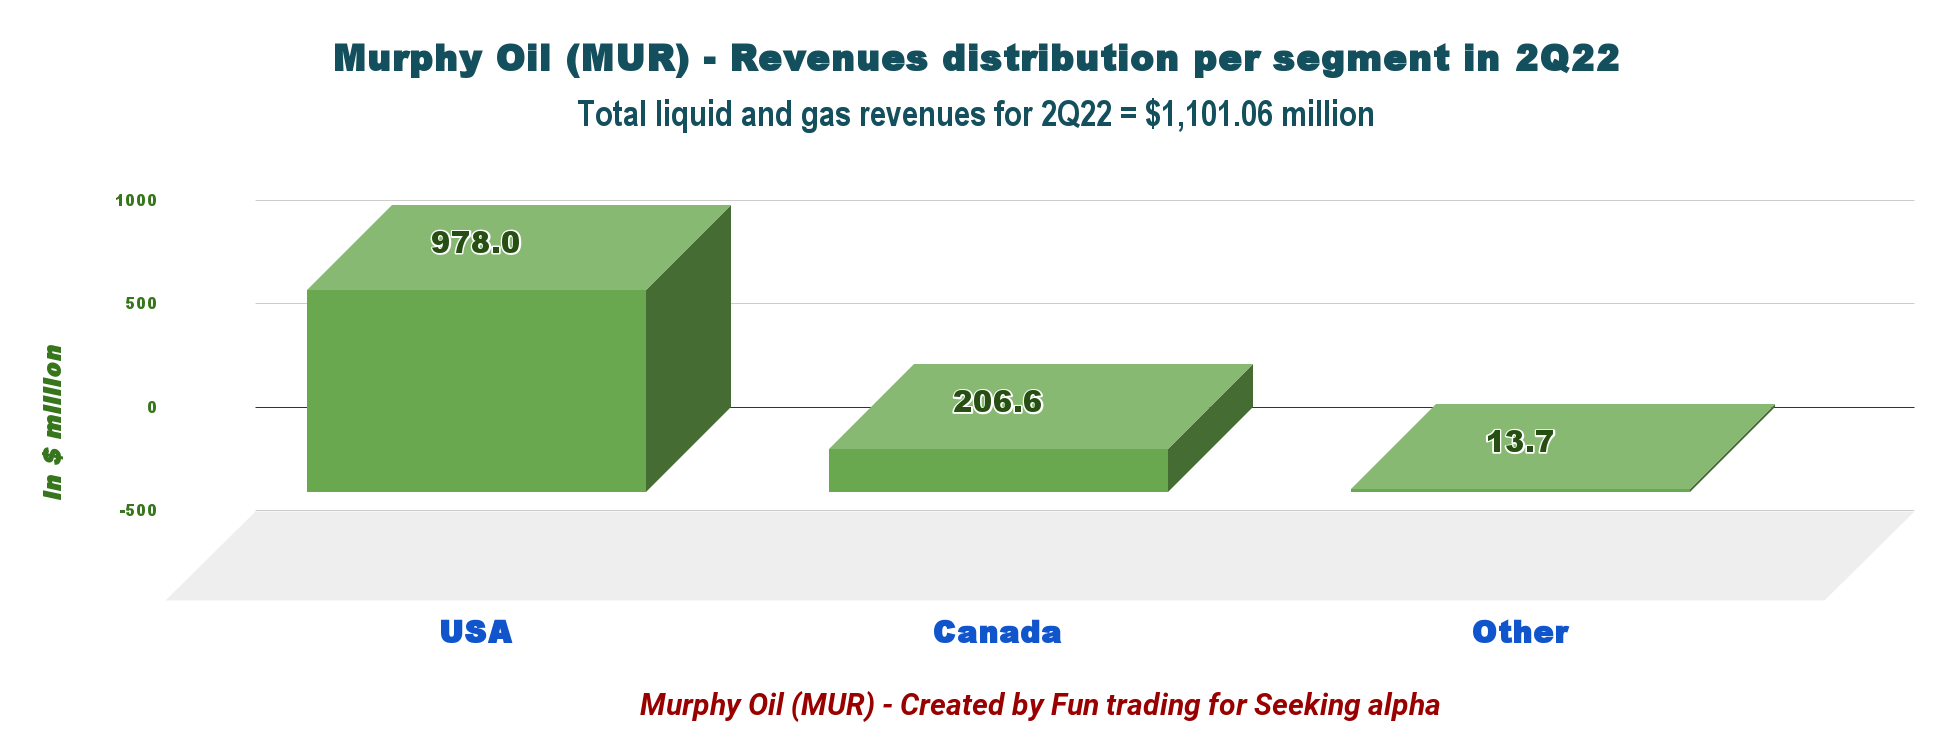
Murphy Oil’s revenues of $1,101.06 million were better than expectations. Revenues improved from the prior-year quarter of $549.64 million.
The E&P company produced 164.4k Boep/d in the second quarter, comprising 62% of liquids. Murphy Oil’s total costs and expenses were $549.5 million, up from $539.9 million in the prior-year quarter.
Finally, Murphy Oil declared a quarterly dividend of $0.25 per share in the second quarter of 2022.
Finally, Murphy Oil hedged 25K barrels of oil per day at a weighted average put price of $63.24 per barrel and a weighted average call price of $75.20 for 2022.
2 – What’s new in 3Q22?
Production in 3Q22 is expected to jump significantly to 184K Boep/d in 3Q22 (mid-point). The company is focusing on debt reduction with a $600-$650 million debt reduction expected in FY 2022.
MUR 3Q22 (MUR Presentation)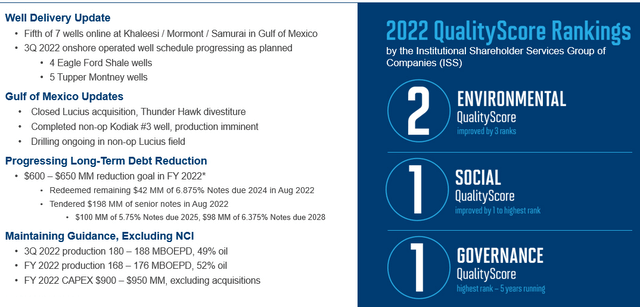
3 – Stock Performance And Commentary
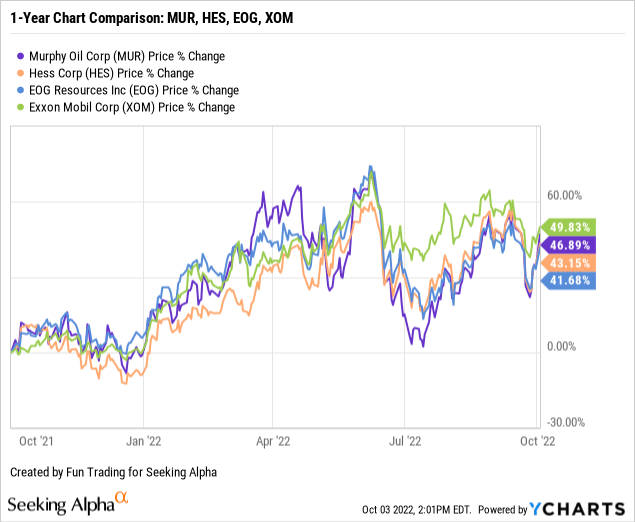
MUR is now up 47% on a one-year basis. The stock is following the general trend in this sector, rebounding from a period of consolidation as recession fears weigh down on markets.
4 – Investment thesis
Murphy’s exposure to the US through the Gulf of Mexico and Eagle Ford is attractive from a long-term investment perspective.
However, oil prices remain highly volatile and may correct further depending on the FED’s decision in November.
The threat of a recession is now rising to 65%, and oil prices could drop further down to $80 per barrel and below even if we had a great day today. It’s essential to trade LIFO about 50% of your position due to the oil volatility and uncertainty about the economy suffering from rampant inflation.
Murphy Oil – Financial Table 2Q22 – The Raw Numbers
| Murphy Oil | 2Q21 | 3Q21 | 4Q21 | 1Q22 | 2Q22 | 3Q22 |
| Total oil and gas revenues in $ million | 758.83 | 687.55 | 762.3 | 871.37 | 1,196.24 | – |
| Total Revenues and others in $ Million | 549.64 | 630.70 | 739.0 | 552.96 | 1,101.06 | – |
| Net Income in $ Million | -63.08 | 108.46 | 168.4 | -113.34 | 350.56 | – |
| EBITDA $ Million | 237.07 | 413.18 | 489.76 | 119.51 | 752.77 | – |
| EPS diluted in $/share | -0.41 | 0.70 | 1.08 | -0.73 | 2.23 | – |
| Operating cash flow in $ Million | 448.52 | 405.00 | 330.9 | 338.33 | 620.91 | – |
| CapEx in $ Million | 204.77 | 118.92 | 106.2 | 244.91 | 354.41 | – |
| Free Cash Flow in $ Million | 243.75 | 286.09 | 224.63 | 93.42 | 266.50 | – |
| Total cash $ Billion | 0.42 | 0.51 | 0.52 | 0.48 | 0.43 | – |
| Long-Term Debt in $ Billion | 2.76 | 2.61 | 2.47 | 2.47 | 2.27 | – |
| Dividend per share in $ | 0.125 | 0.125 | 0.15 | 0.175 | 0.25 | – |
| Shares outstanding (diluted) in Million | 154.40 | 155.93 | 154.45 | 154.92 | 157.46 | – |
| Oil Production | 2Q21 | 3Q21 | 4Q21 | 1Q22 | 2Q22 | 3Q22 |
| Oil Equivalent Production in K Boe/d | 171.0 | 155.0 | 150.2 | 141.0 | 164.4 | ~184 |
| US Onshore Crude oil price ($/b) | 65.57 | 68.88 | 76.28 | 93.87 | 109.25 | ~88 |
Source: Murphy Oil 10-Q filing
Analysis: Revenues, Earnings Details, Free Cash Flow, Debt, An Oil & Gas Production
1 – Total Revenue and Others (Hedging) was $1,101.06 Million In 2Q22
MUR Quarterly Revenues history (Fun Trading) Note: Revenues from oil and gas were $1,101.06 million. MUR 2Q22 revenues per segment (Fun Trading) Murphy Oil reported a net income of $350.56 million, or $2.23 per diluted share, for the second quarter of 2022.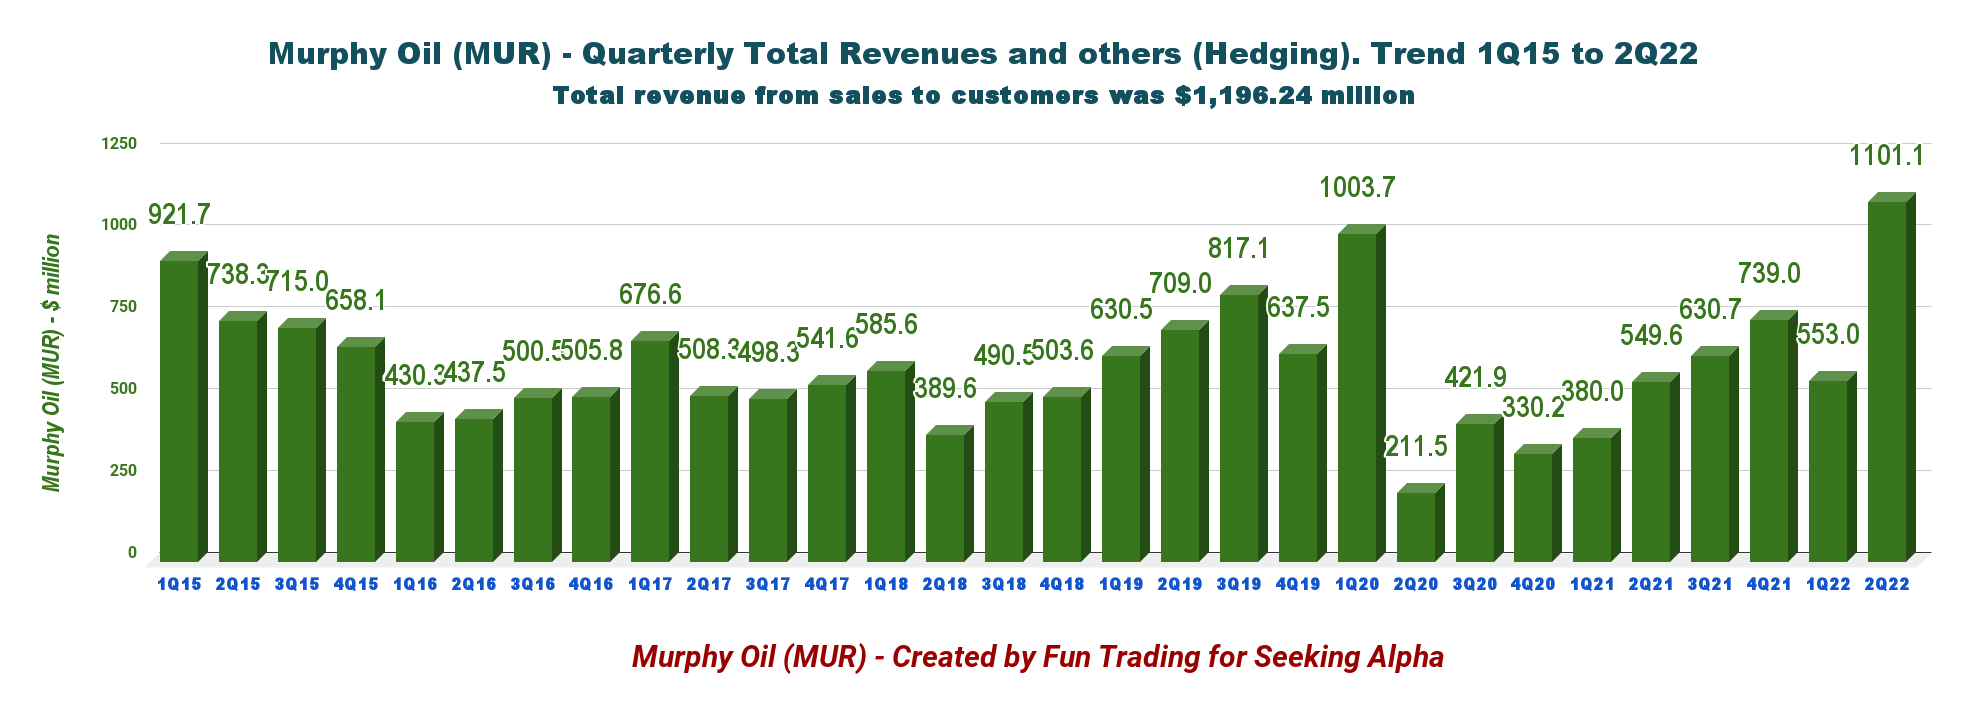
The net cash provided by continuing operations activities in 2Q22 was $620.91 million, compared with $448.52 million in 2Q21.
2 – Free Cash Flow Was $266.50 Million in 2Q22
MUR Quarterly Free cash flow history (Fun Trading) Note: The generic free cash flow is cash from operating activities minus CapEx. The company has a different calculation, including divestiture.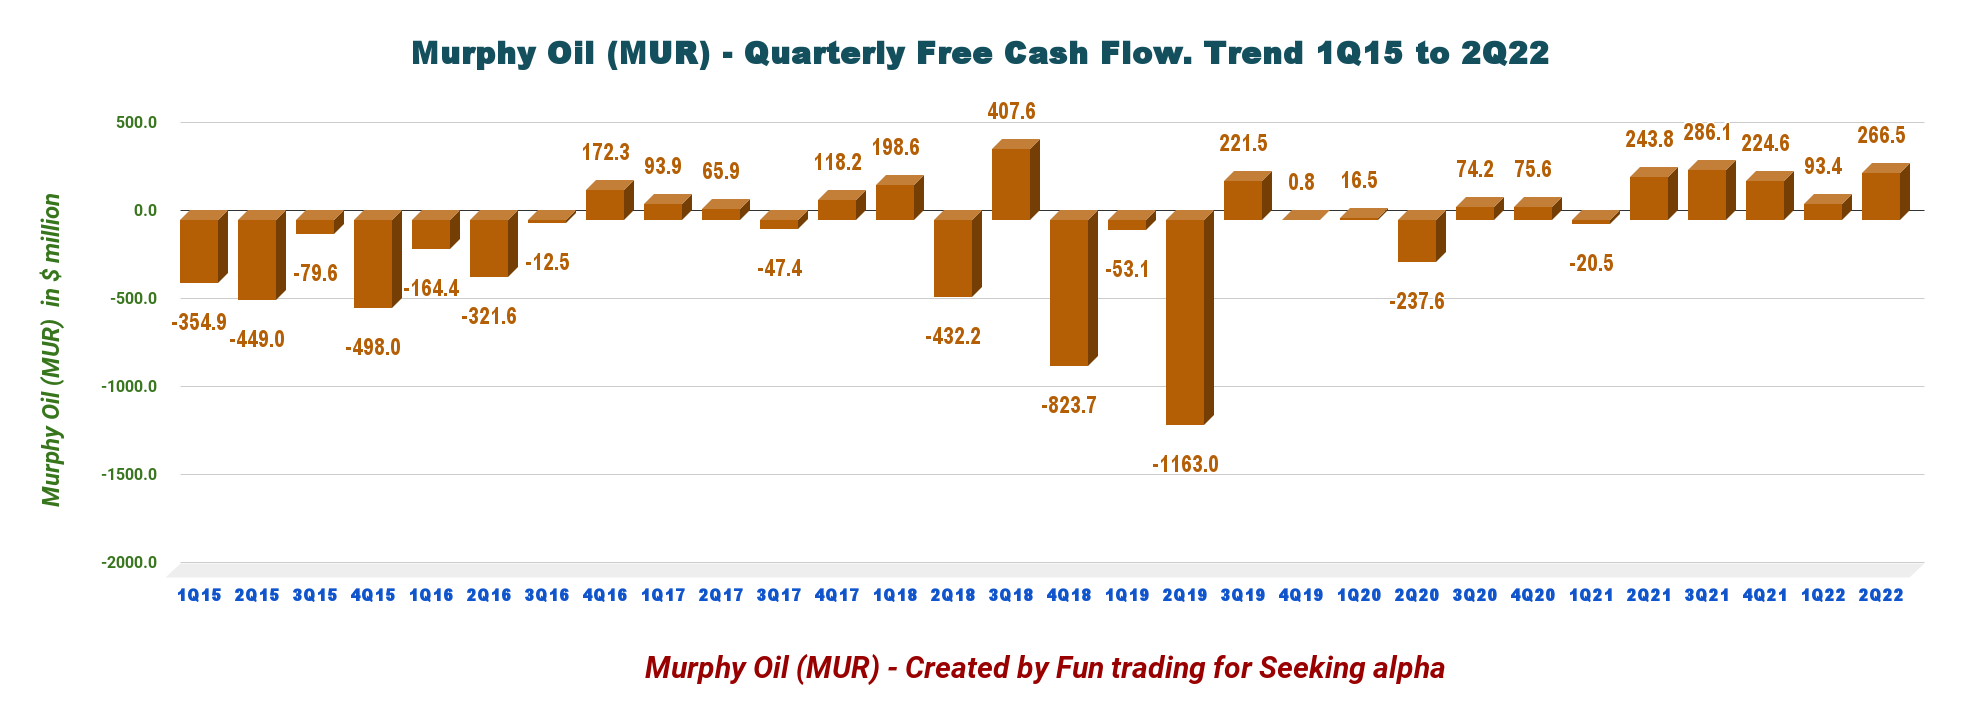
The generic free cash flow was $266.50 million in 2Q22. The trailing 12-month free cash flow is $870.64 million, which is large enough to cover the increased dividend.
The company now pays a quarterly dividend of $0.25 per share. The dividend yield is currently 2.84%.
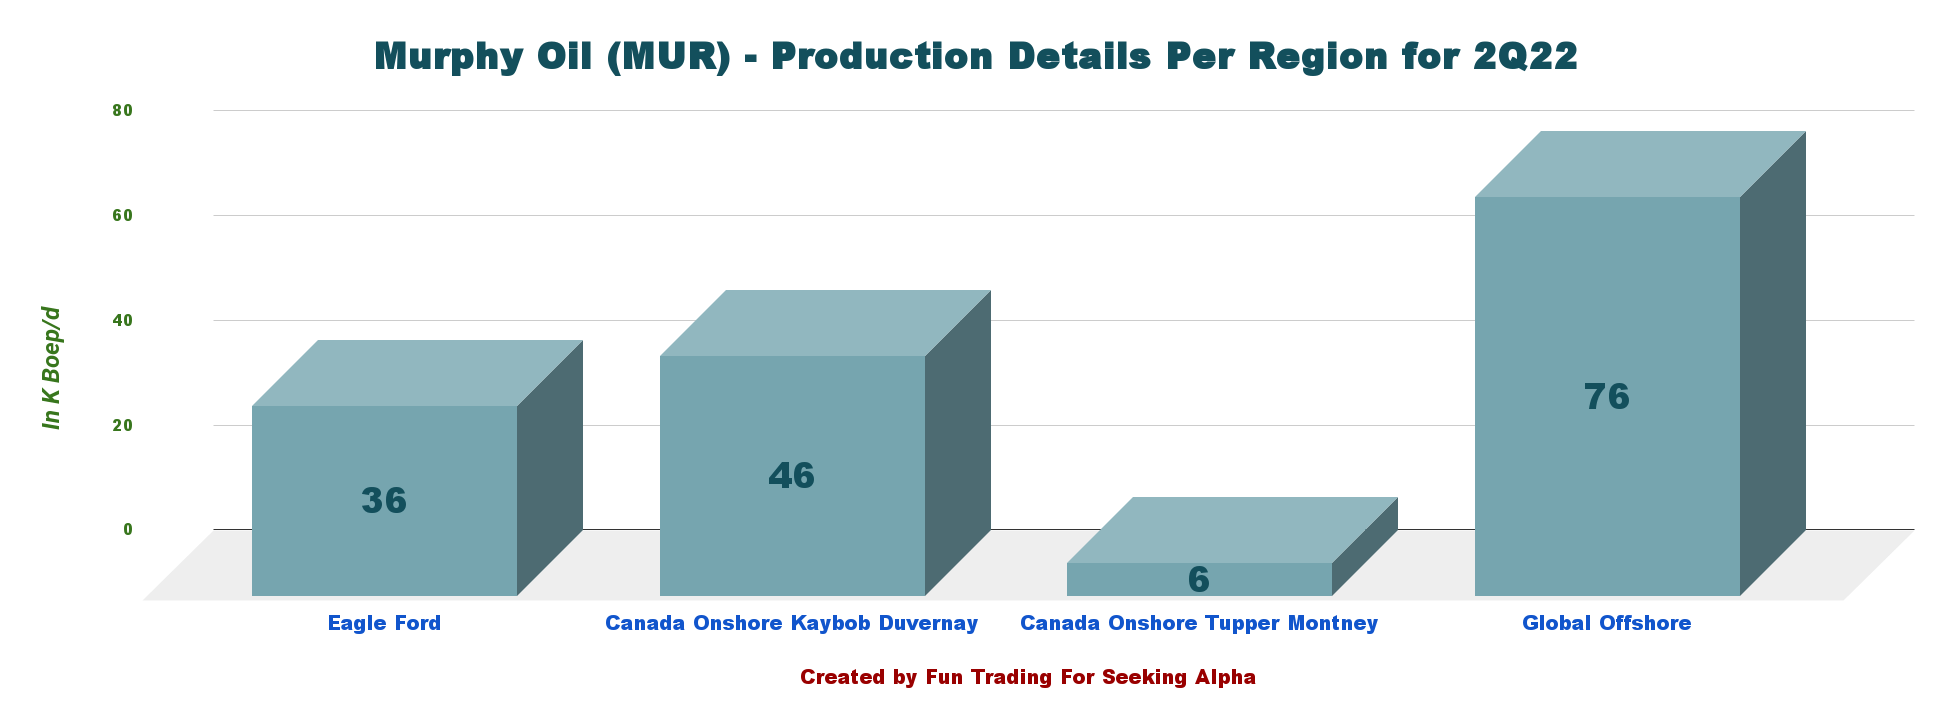
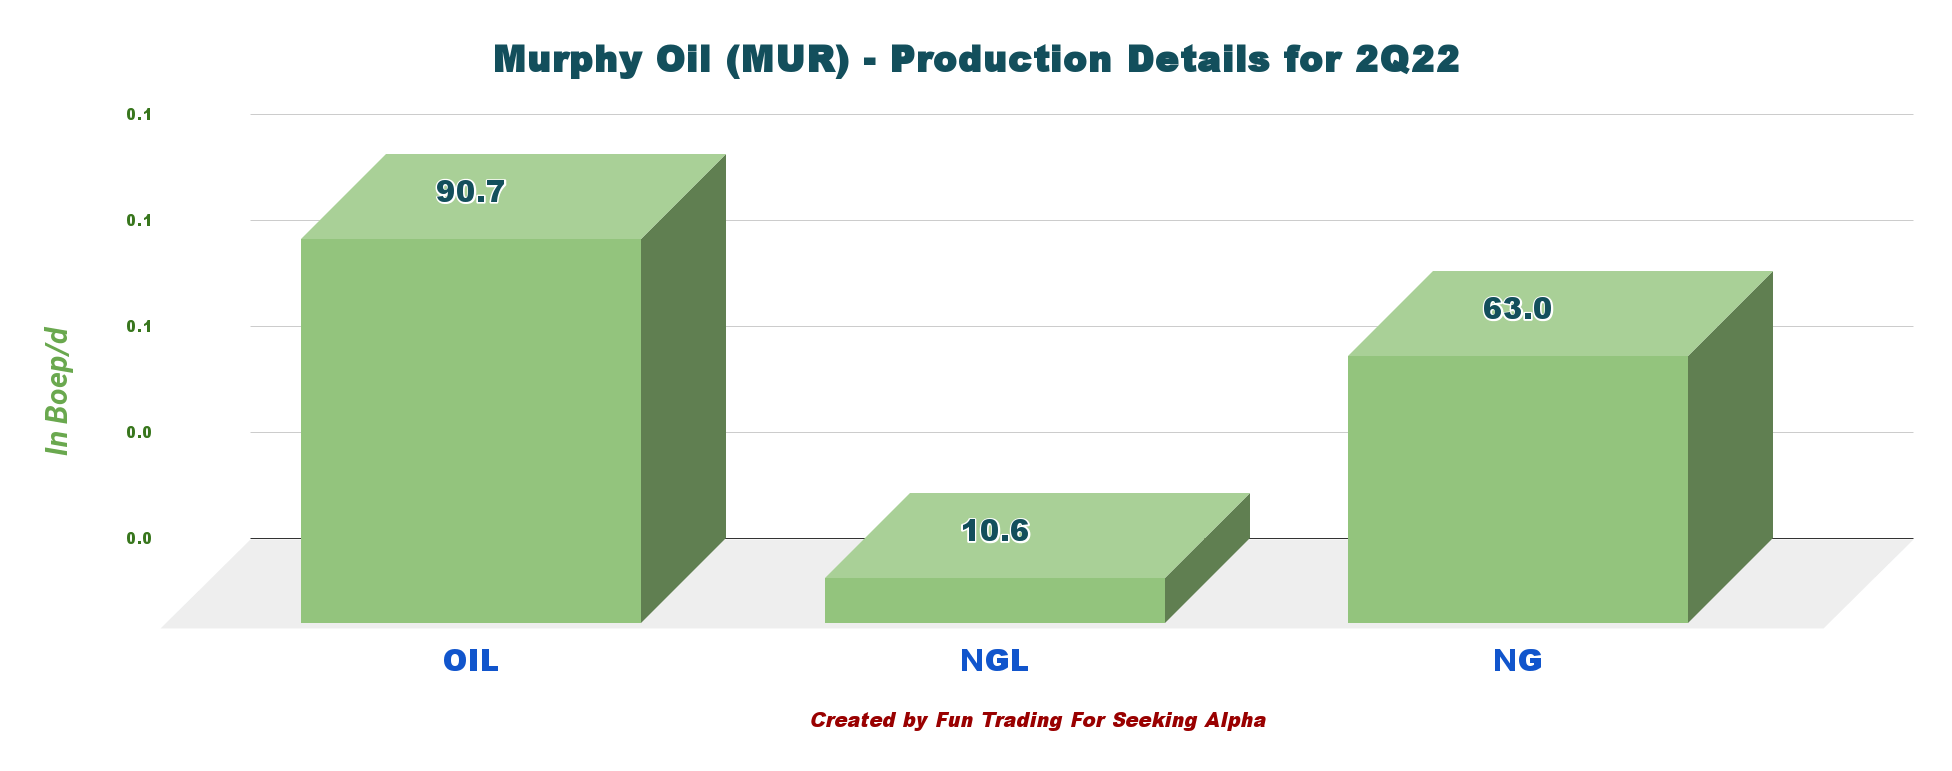
3 – Production was a Total of 164.4k Boep/d in 2Q22
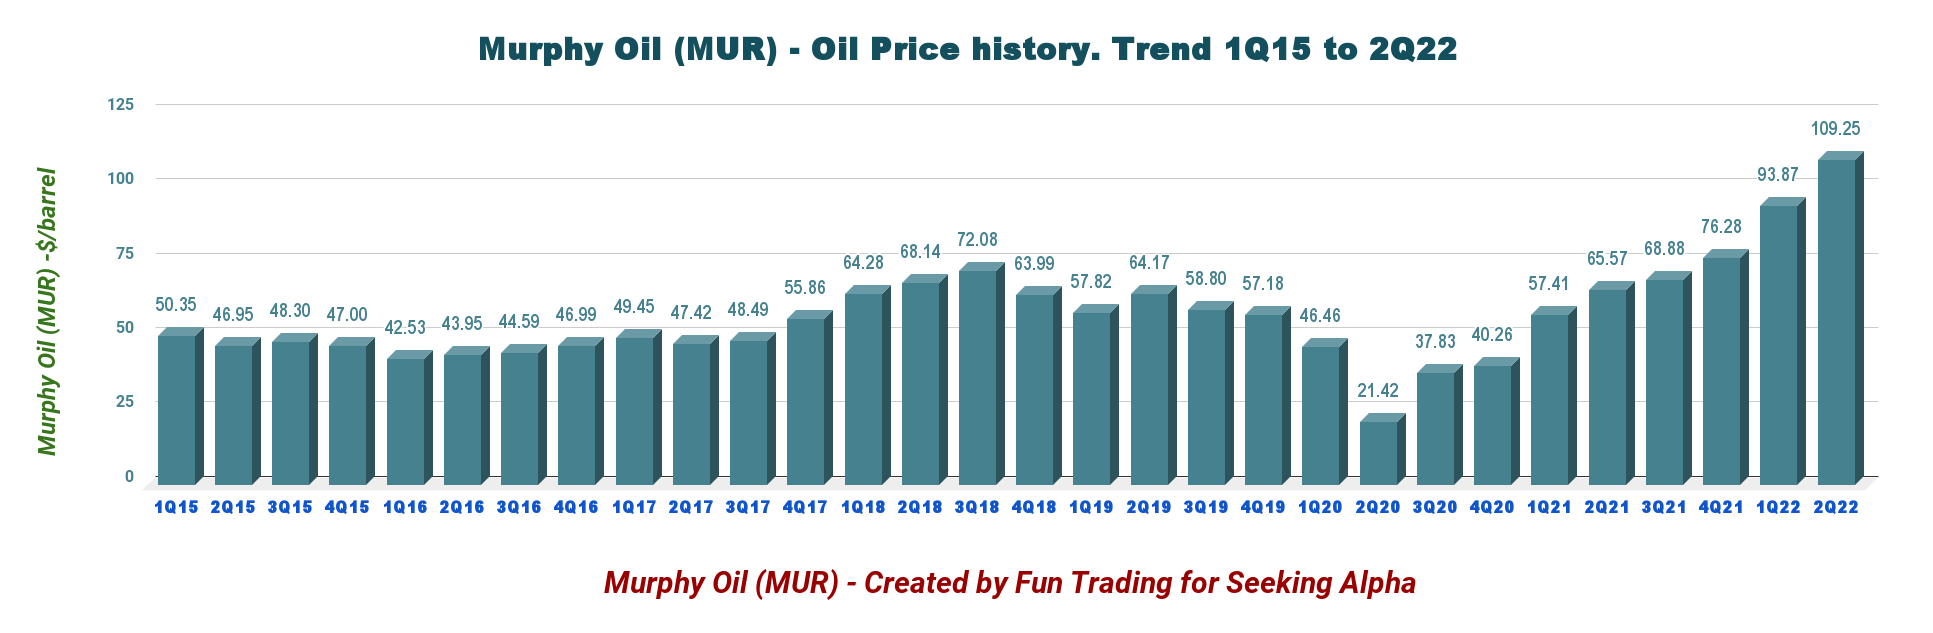
MUR Quarterly Oil equivalent production history (Fun Trading) The company produced 164.4K Boep/d in the Second Quarter, comprising 62% of liquids. The offshore section, mainly the Gulf of Mexico, represents 46.2% of the total output in 2Q22. MUR Quarterly Production per segment in 2Q22 (Fun Trading) Oil prices jumped to $109.25 in 2Q22 but will be below $85 per barrel in 3Q22. MUR Quarterly oil prices history (Fun Trading) Below is shown how the equivalent production is spread between oil, NGL, and natural gas. MUR Production in Oil, NGL, NG in 2Q22 (Fun Trading)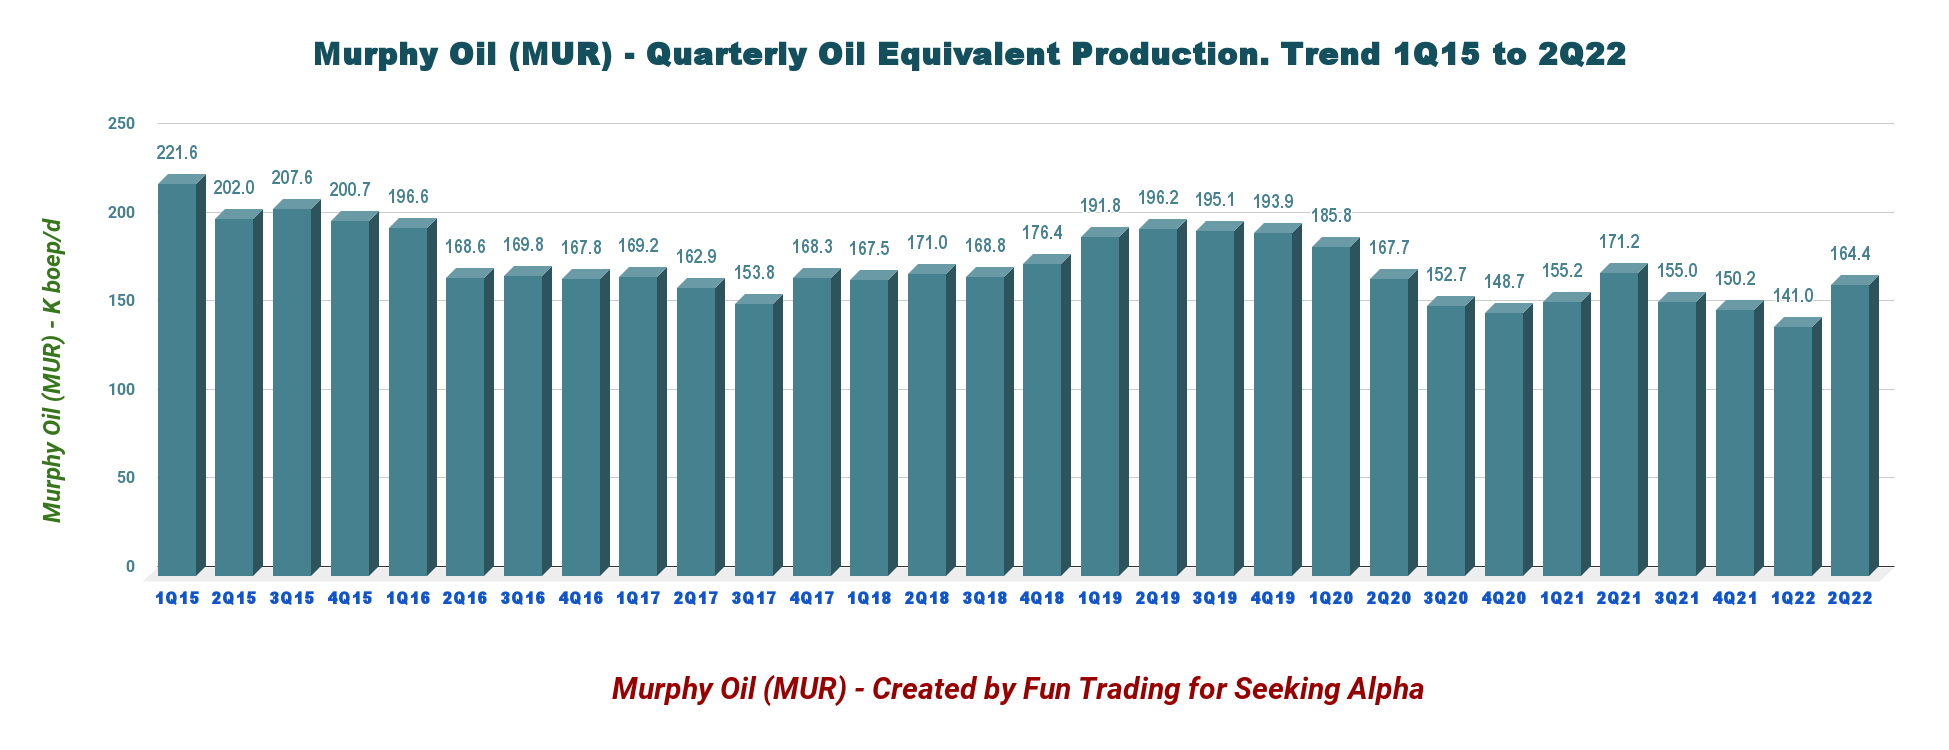
4 – Net Debt Under Control
Murphy Oil had cash and cash equivalents of $432.02 million as of June 30, 2022, compared with $418.10 million as of June 30, 2021.
MUR Quarterly Cash versus Debt history (Fun Trading) Net Debt is $1.84 billion at the end of June 2022. All Debt is an unsecured senior credit facility, not subject to semi-annual borrowing base redetermination. MUR expects to cut Debt by another $200 million in H2 2022.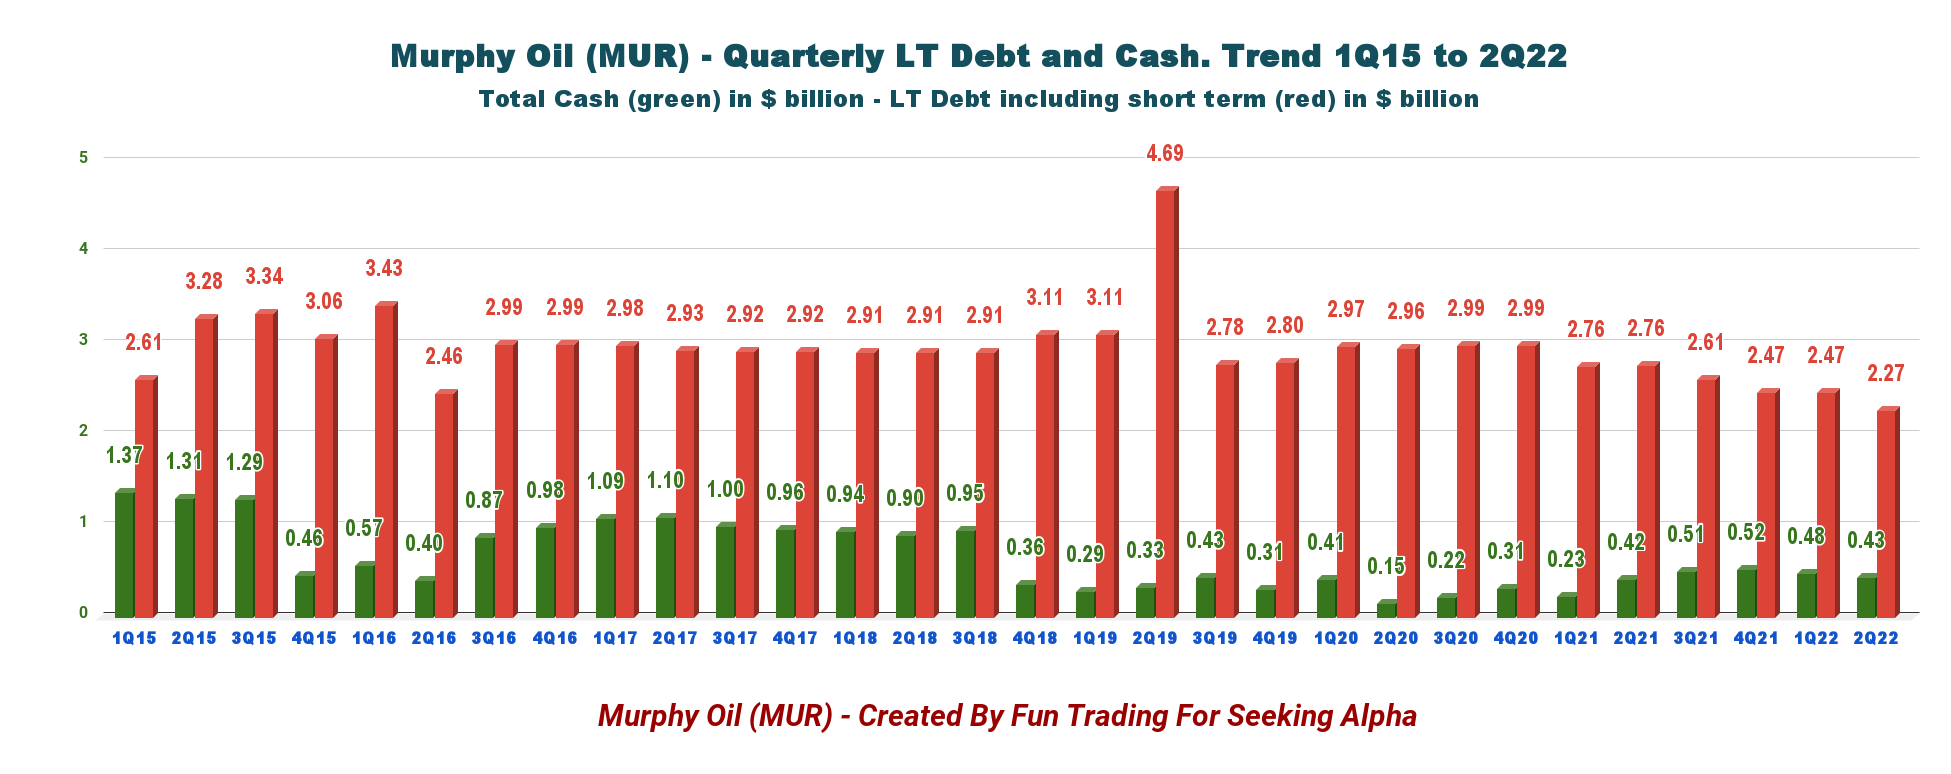
5 – 3Q22 and full-year Guidance going up
MUR expects its production to be 180-186k Boep/d in 3Q22, with FY 2022 168K-176K Boep/d. MUR is expecting the fourth-quarter output in the range of 194K-202K Boep/d.
MUR 3Q22 and full-year Guidance October (MUR Presentation October)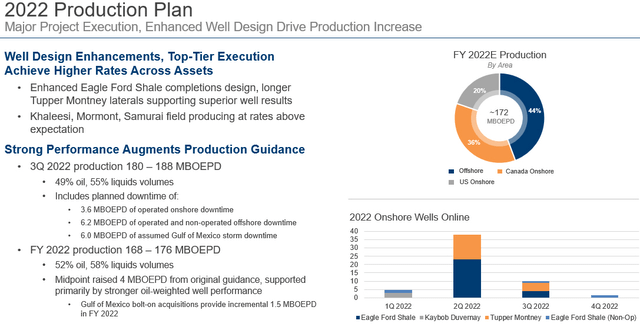
Murphy Oil expects its current planned CapEx range of $925 million. It is a big jump compared with 2021 ($688 million).
MUR CapEx plan (MUR Presentation)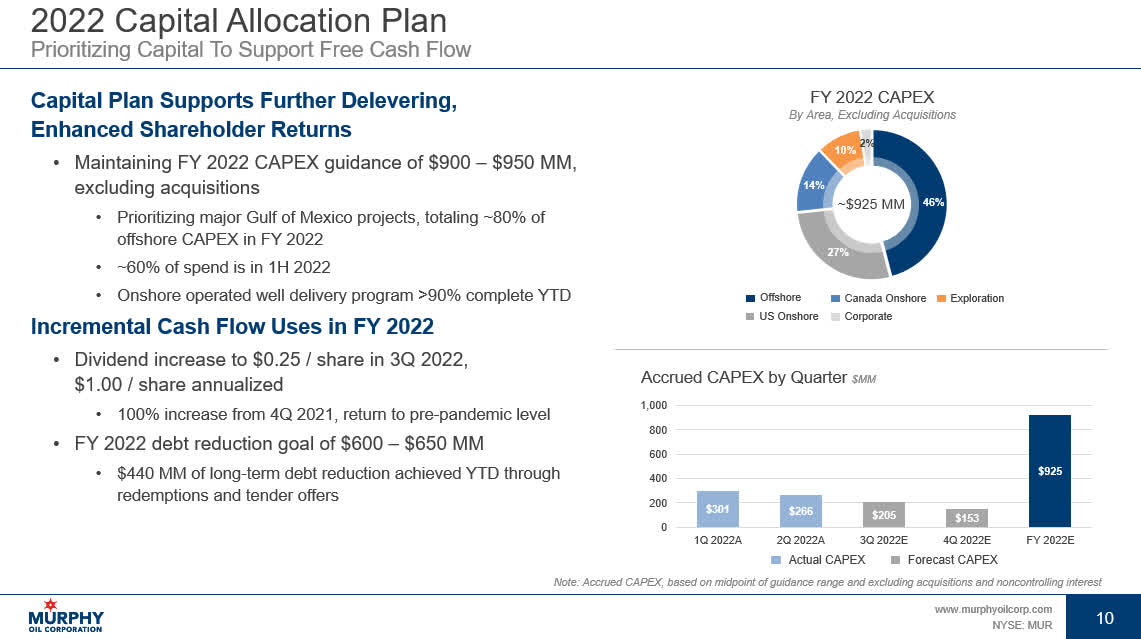
Technical Analysis (Short Term) And Commentary
MUR TA chart short-term (Fun Trading StockCharts)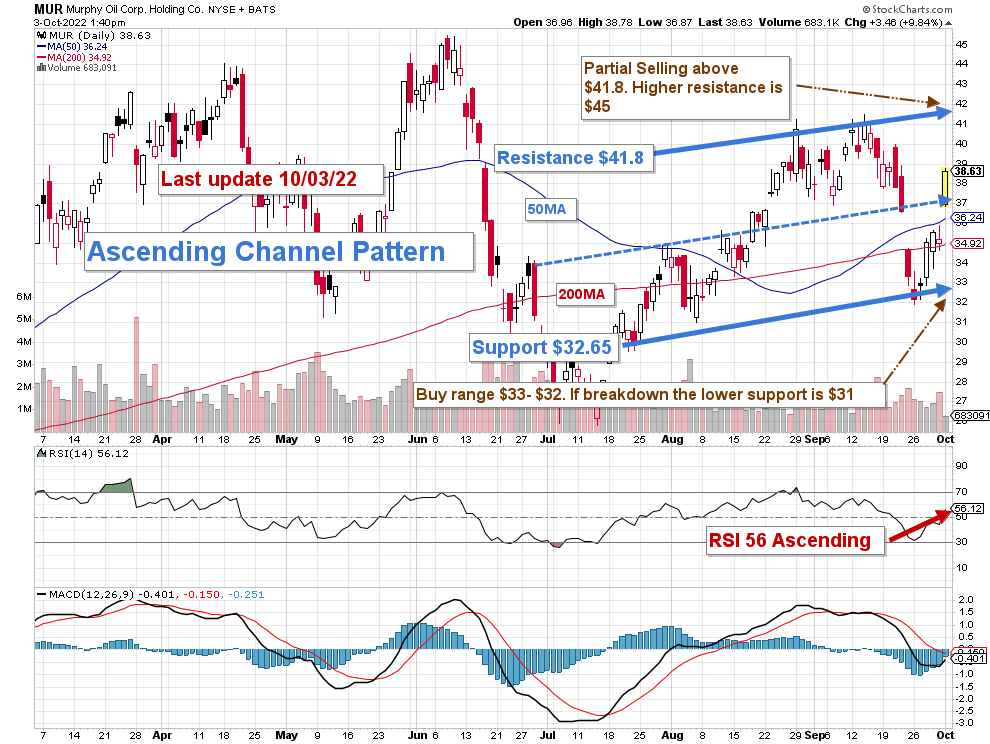
Note: The chart is adjusted for the dividend.
MUR forms an ascending channel pattern with resistance at $41.8 and support at $32.65
It is not easy to “predict the future, “but we can see that the global economy is weakening at a faster rate. The FED’s action against rampant inflation increases the risk of a recession in 2023.
As I said in my preceding article, we cannot ignore those early signs, and we must d”fend our MUR investment by adopting a strategy that takes the “best of both worlds.” It is what I promote in” my marketplace, “The Go” d and Oil corner.”
Thus, trading LIFO is the most suitable solution, in my opinion.
The trading strategy is to sell LIFO about 50% of your position above $41.8 with possible higher resistance at $45.
I suggest accumulating between $32 and $33 with potential lower support at $31 if oil prices fall below $80 a barrel.
Note: The LIFO method is prohibited under International Financial Reporting Standards (IFRS), though it is permitted in the United States by Generally Accepted Accounting Principles (GAAP). Therefore, only US traders can apply this method. Those who cannot trade LIFO can use an alternative by setting two different accounts for the same stock, one for the long term and one for short-term trading.
Warning: The TA chart must be updated frequently to be relevant. It is what I am doing in my stock tracker. The chart above has a possible validity of about a week. Remember, the TA chart is a tool only to help you adopt the right strategy. It is not a way to foresee the future. No one and nothing can.
Author’s note: If you find value in this article and would like to encourage such continued efforts, please click the “Like” button below to vote of support. Thanks.
Be the first to comment