

KanawatTH
Chart created by writer from C Trader
Looking back on the bullish sentiment shown by the market in the past few months as it attempted to form a three wave pattern north was likened to arranging deck chairs on the Titanic with the final blow coming to the move with the release of the Jackson hole speech.
It was only December last year the S&P 500 (NYSEARCA:SPY) was pushing towards an all time high of 5000. A month later and it was a very different story. Macro attack after macro attack with everything from war to cost of living crisis with such an inflation problem that for the first time in a decade, the market falls when the Fed speaks.
By the end of January unbeknownst to the masses, the bull run was at least temporarily over as the SPY started its formation of a bearish macro wave downwards. This was confirmed in March as a bullish rejection candle that the market had printed to allow a three wave pattern going lower was about to be taken out southwards.
SPY Monthly chart (C Trader)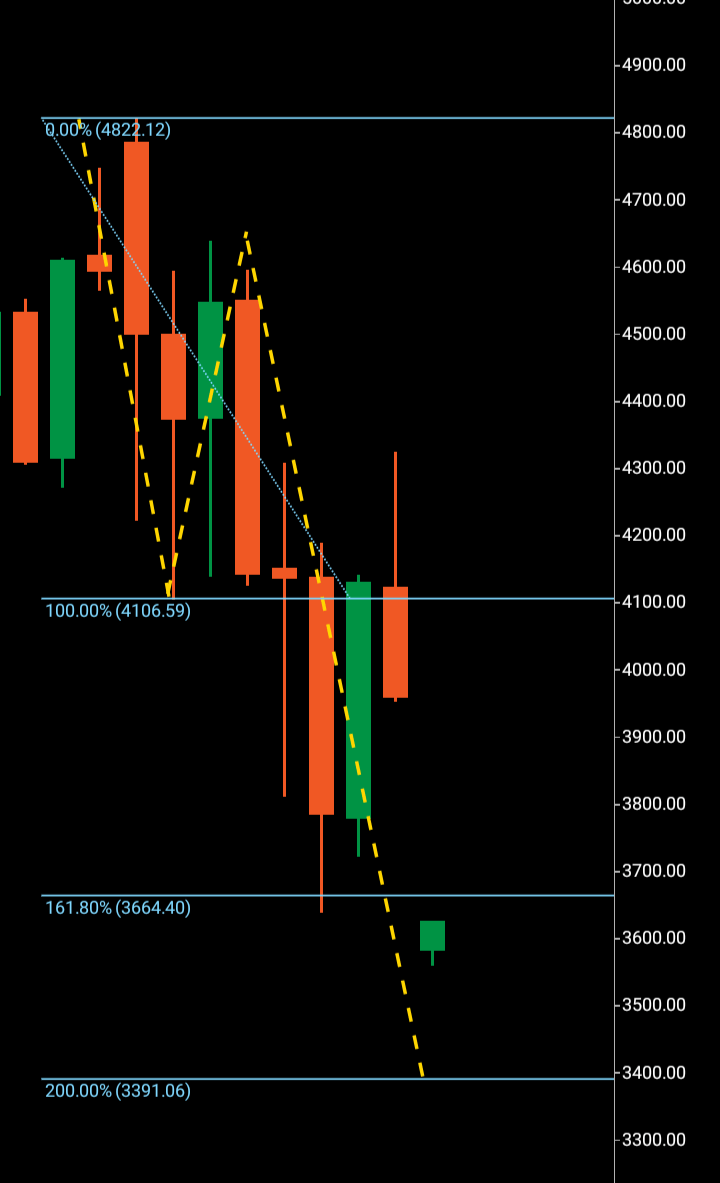
It was April that saw the initial break through major support at 4105 and the start of the third wave to 3380 if wave three is to copy wave one that is.
Bearish waves do work differently to bullish waves as the market it susceptible to a shift in upward momentum at any stage. Sometimes they don’t go so far as to numerically copy their wave one and will choose the Fibonacci 161 as their preferred choice to switch tack. But barring this break down past the Fibonacci 161 turning around sharply, the market should look to now land at target and replicate its printed wave one.
The attempt at forming a bullish wave pattern from the previous 3650 low has now evaporated as once price is driven below its perceived wave one and two, it will have to come lower to another point before spending another few months attempt to reform another macro pattern.
So will the market copy its wave one and what are the chances of a turn around at this point if it does? Dropping into the 3500’s is an indication it is not yet ready to turnaround and the next technical stop does lie at 3380.
Wave patterns form on miniature timeframes even from a major bottom that then go on to climb through the timeframes eventually leading to the monthly candles forming three wave patterns.
So what will happen if the SPY does achieve 3380 is exactly that, it is only when the market gets to the weekly time frame that then forms a three wave pattern that we can start to look to the monthly and a potential bottoming. Firstly the market must get to its target and then we can look for the reaction at that region. I wrote an article a few months ago suggesting this was the path the market was on and it is only by both the break of the Fibonacci 161 and termination of the possibility of a bullish wave pattern upwards, that we look to revisit a possible target that the SPY may go to and look to turn around at. Failing signs of a switch in momentum should the SPY get to 3380, it is the Fibonacci 261 we will look to examine. For now, all eyes switch to 3380.
About the Three Wave Theory
The three wave theory was designed to be able to identify exact probable price action of a financial instrument. A financial market cannot navigate its way significantly higher or lower without making waves. Waves are essentially a mismatch between buyers and sellers and print a picture of a probable direction and target for a financial instrument. When waves one and two have been formed, it is the point of higher high/lower low that gives the technical indication of the future direction. A wave one will continue from a low to a high point before it finds significant enough rejection to then form the wave two. When a third wave breaks into a higher high/lower low the only probable numerical target bearing available on a financial chart is the equivalent of the wave one low to high point. It is highly probable that the wave three will look to numerically replicate wave one before it makes its future directional decision. It may continue past its third wave target but it is only the wave one evidence that a price was able to continue before rejection that is available to look to as a probable target for a third wave.
Be the first to comment