

Maximusnd
Municipal market insight: October update
Market overview
Municipal bonds posted their worst performance since the global financial crisis in September, as interest rates rose sharply alongside continued hawkishness from the Federal Reserve. The S&P Municipal Bond Index returned -3.63%, bringing the year-to-date total return to -11.50%. Shorter- duration (i.e., less sensitive to interest rate changes) and higher credit quality bonds performed best. Challenging supply-and-demand dynamics prompted modest muni underperformance compared to Treasuries.
Issuance underwhelmed at $26 billion or 28% below the five-year average. However, light supply was negated by robust bid-wanted activity stemming from large mutual fund outflows and unwinding of leverage.
We hold a near-term cautious view on munis amid continued interest rate volatility and expectation for heightened tax-loss swapping. However, we see several reasons to be more constructive over the medium term. First, absolute yields remain historically attractive and could peak over the next few months. During the last four Fed tightening cycles, interest rates peaked an average of two months prior to the last rate hike. With the Fed currently expected to pause next February, rates could peak in late 2022.
Next, seasonality in the municipal market turns more favorable around year-end. Over the past five years, the months of December and January have accounted for 29% of full-year total returns. Also, the asset class could show a considerable rebound in 2023. Munis have produced negative total returns just four times over the past 30 years, averaging -3.06%. However, in years following negative performance, total returns have averaged +12.77%, or an incredible 417% bounce back.
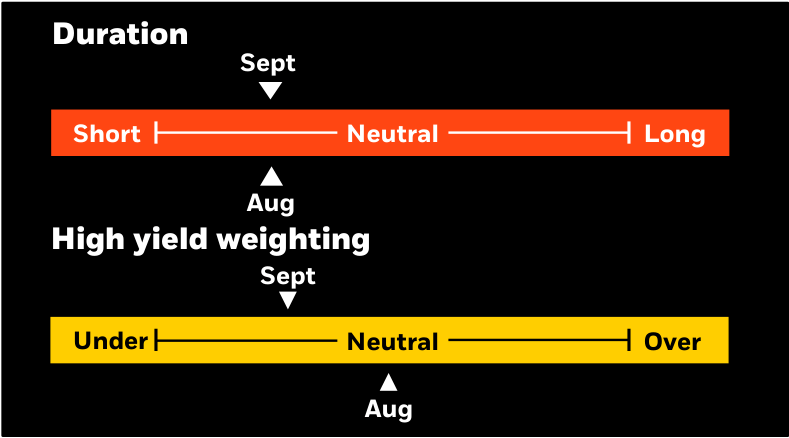
Strategy insights
We maintain a short-duration stance on municipal positioning with increased cash balances. We favor the intermediate part of the yield curve to maximize income, while avoiding significant duration risk, and are targeting bonds with defensive structures. We prefer higher-quality bonds overall, with a neutral allocation to non-investment grade bonds.
Overweight
- Essential-service revenue bonds.
- Select highest quality state and local issuers with broadest tax support.
- Flagship universities and diversified health systems.
- Select issuers in the high yield space.
Underweight
- Speculative projects with weak sponsorship, unproven technology, or unsound feasibility studies.
- Senior living and long-term care facilities in saturated markets.
Credit headlines
On September 28, Hurricane Ian made landfall in southwest Florida as a strong Category 4 storm. Initial damage estimates suggest Ian will be the costliest storm in Florida’s history, surpassing 1992’s Hurricane Andrew (not adjusted for inflation). While the loss of life and property is tragic, we do not anticipate widespread fiscal distress among Florida municipal issuers due to the hurricane. The rebuilding effort, spurred by an influx of insurance proceeds and government aid, will stimulate local economies and lead to resilient tax revenue collections.
The State of Florida is also well positioned to assist local governments with any near-term liquidity concerns, given the state’s improved financial position. Florida’s general fund reserves were estimated at $19 billion at fiscal year-end, June 30, 2022, representing a very strong 43% of annual general revenues. The fiscal year 2022 budget also created a $500 million Emergency Preparedness and Response Fund as a dedicated source of funding for costs related to declared states of emergency.
Finally, we note that Florida’s economy has continued to diversify in terms of both geography and industry concentration, supporting ongoing state-wide economic growth despite the negative effects of a storm on any one region.
While Florida’s property insurance market could come under some stress due to claims from Hurricane Ian, the state-run insurance providers, Citizens Property Insurance Corporation and the Florida Hurricane Catastrophe Fund (FHCF), are better capitalized than in prior periods.
From 2012 to 2019, Citizen’s depopulation program reduced its total claims exposure by 78%, while claims-paying capacity has remained relatively stable. FHCF’s total liquid resources have also grown over the last ten years and now compare favorably to its maximum annual statutory liability of $17 billion. Both entities retain significant flexibility to issue post-event debt and levy emergency assessments as necessary without weighing on the state’s economic recovery.
Municipal and Treasury yield movements
Municipal and Treasury yield movements (Sources: BlackRock, Bloomberg.)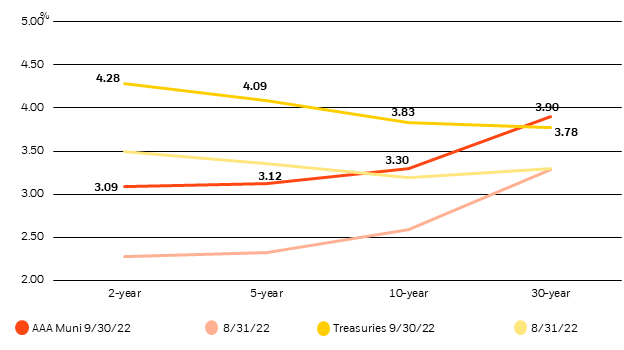
Municipal performance
|
Sept ’22 |
YTD |
|
|
S&P Municipal Bond Index |
-3.63% |
-11.50% |
|
Long maturities (20+ yrs.) |
-5.98% |
-19.05% |
|
Intermediate maturities (3-15 yrs.) |
-3.31% |
-10.12% |
|
Short maturities (6 mos.-4 yrs.) |
-1.23% |
-3.63% |
|
High yield |
-6.15% |
-15.62% |
|
High yield (ex-Puerto Rico) |
-5.87% |
-15.52% |
|
General obligation (GO) bonds |
-3.61% |
-11.31% |
|
California |
-3.64% |
-11.73% |
|
New Jersey |
-3.66% |
-11.34% |
|
New York |
-3.55% |
-12.13% |
|
Pennsylvania |
-3.71% |
-11.81% |
|
Puerto Rico |
-7.41% |
-14.87% |
|
Sources: S&P Indexes. |
|
Investment involves risk. The two main risks related to fixed income investing are interest rate risk and credit risk. Typically, when interest rates rise, there is a corresponding decline in the market value of bonds. Credit risk refers to the possibility that the issuer of the bond will not be able to make principal and interest payments. There may be less information available on the financial condition of issuers of municipal securities than for public corporations. The market for municipal bonds may be less liquid than for taxable bonds. A portion of the income from tax-exempt bonds may be taxable. Some investors may be subject to Alternative Minimum Tax (AMT). Capital gains distributions, if any, are taxable. Index performance is shown for illustrative purposes only. You cannot invest directly in an index. Past performance is no guarantee of future results. This material is not intended to be relied upon as a forecast, research or investment advice, and is not a recommendation, offer or solicitation to buy or sell any securities or to adopt any investment strategy. The opinions expressed are as of Oct 6, 2022, and may change as subsequent conditions vary. The information and opinions contained in this material are derived from proprietary and nonproprietary sources deemed by BlackRock to be reliable, are not necessarily all-inclusive and are not guaranteed as to accuracy. There is no guarantee that any forecasts made will come to pass. Any investments named within this material may not necessarily be held in any accounts managed by BlackRock. Reliance upon information in this material is at the sole discretion of the reader. ©2022 BlackRock, Inc. All Rights Reserved. BlackRock is a trademark of BlackRock, Inc. All other trademarks are those of their respective owners. Prepared by BlackRock Investments, LLC, member FINRA. USRRMH1022U/S-2462287-2/2 |
This post originally appeared on the iShares Market Insights.
Editor’s Note: The summary bullets for this article were chosen by Seeking Alpha editors.
Be the first to comment