

Pgiam/iStock via Getty Images
Investment Thesis
Knowing when and which stocks to own, actively and selectively, provides a continuing series of net capital gain opportunities delivering wealth accumulation or spendable income at rates which are multiples of what market-index ETFs may offer.
You can know what winning institutions know about capital-building stock situations by listening to what the markets tell as capital is being invested. Listen because today’s markets pay active investors for being in the right places at the right times. They feed off the indolence of passive-strategy investing buy & holders who frequently pass-up timely points of profitable position liquidation.
Increased information technology, communication capabilities, and rapidly evolving competitive practices make this century’s investing markets far more opportune with pricing activity than the 20th century offered. Still FOMO of a 5% annual dividend.
But an active investment strategy requires reasonably-accurate forecasts of what to expect. Fortunately the conditions creating the “hazards” feared by the buy & holders are what provide the needed forecasts. The markets themselves, in their interactions, define what the best-informed professional practitioners see as coming-price limits. In both directions.
Instead of forecasts by analysts of what may be hoped for as price/earnings targets to be sought, the markets define ranges within which prices are reasonably being expected. Ranges warning of currently unmaintainable excesses, and of price depressions unlikely to present buying bargains for long.
But if this is not a suitable practice for your situation, continue to ignore it. We are pleased to have your persistent support, rather than competition which might erode our wealth-building productivity.
Risk and Reward Balances Among Agribusiness Operators
Let’s look at an “Opportunity Set” of comparable companies ranging from most to least attractive to consider in one particular area of activity today – AgriBusiness. One best-appraised buy is The Mosaic Company (NYSE:MOS). Another, less known, is Zoetis Inc. (NYSE:ZTS). Here in Figure 1 is how the markets currently appraise their Reward ~ Risk trade-offs.
Figure 1
BLOCKDESK.COM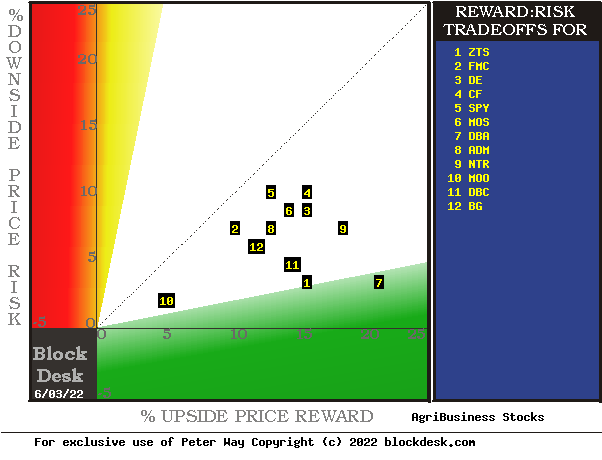
(used with permission)
Upside price rewards are from the behavioral analysis (of what systems require to be done, not of emotional investor errors) by Market-Makers [MMs] as they protect their at-risk capital from possible damaging future price moves. Their potential reward forecasts are measured by the green horizontal scale.
The risk dimension is of actual price drawdowns at their most extreme point while being held in previous pursuit of upside rewards similar to the ones currently being seen. They are measured on the red vertical scale.
Both scales are of percent change from zero to 25%. Any stock or ETF whose present risk exposure exceeds its reward prospect will be above the dotted diagonal line. Capital-gain attractive to-buy issues are in the directions down and to the right.
Our principal interest is in MOS at location [6]. A “market index” norm of reward~risk tradeoffs is offered by SPY at [5]. Most appealing by this Figure 1 view is Invesco DB Agriculture ETF (DBA) [7].
Description of Subject Companies
“The Mosaic Company, through its subsidiaries, produces and markets concentrated phosphate and potash crop nutrients in North America and internationally. It owns and operates mines, which produce concentrated phosphate crop nutrients and phosphate-based animal feed ingredients. The company sells its products to wholesale distributors, retail chains, farmers, cooperatives, independent retailers, and national accounts. The Mosaic Company was incorporated in 2004 and is headquartered in Tampa, Florida.”
Source: Yahoo Finance
Yahoo Finance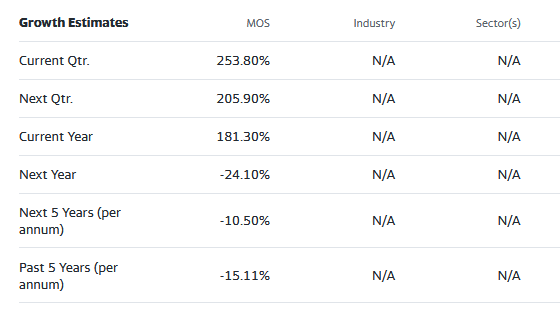
“Zoetis Inc. discovers, develops, manufactures, and commercializes animal health medicines, vaccines, and diagnostic products in the United States and internationally. It commercializes products primarily across species, including livestock, such as cattle, swine, poultry, fish, and sheep; and companion animals comprising dogs, cats, and horses. It markets its products to veterinarians, livestock producers, and retail outlets, as well as third-party veterinary distributors through its sales representatives, and technical and veterinary operations specialists. The company was founded in 1952 and is headquartered in Parsippany, New Jersey.”
Source: Yahoo Finance
Yahoo Finance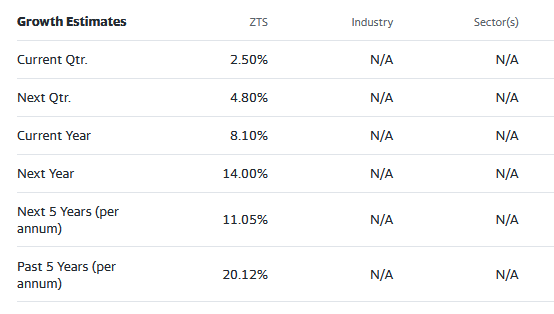
These growth estimates have been made by and are collected from Wall Street analysts to suggest what conventional methodology currently produces. The typical variations across forecast horizons of different time periods illustrate the difficulty of making value comparisons when the forecast horizon is not clearly defined.
The Figure 1 map provides a good visual comparison of the two most important aspects of every equity investment in the short term. There are other aspects of comparison which this map sometimes does not communicate well, particularly when general market perspectives like those of SPY are involved. Where questions of “how likely’ are present, other comparative tables, like Figure 2, may be useful, particularly in this case with DBA.
Figure 2
blockdesk.com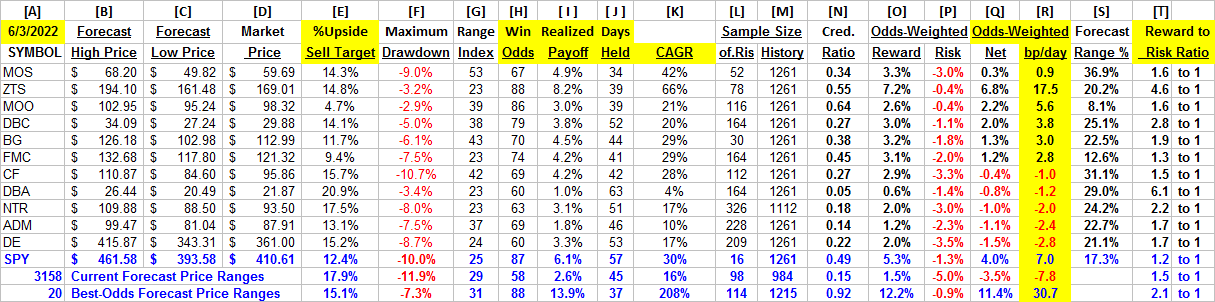
(used with permission)
Why do all this math?
Figure 2’s purpose is to attempt universally comparable answers, stock by stock, of a) How BIG the prospective price gain payoff may be, b) how LIKELY the payoff will be a profitable experience, c) how SOON it may happen, and d) what price drawdown RISK may be encountered during its holding period.
In this set of comparisons, the row data for DBA calls attention to itself in columns [E], [ I ], [H], and [K]. DBA’s history of actual market outcomes following prior instances of forecasts of coming prices like those of today turn out to be a failed encouragement.
The forecasts for DBA (an ETF, or exchange-traded-fund rather than a single company stock) indicated by [B] and [D] that upside price changes coming could be as large as +20.9% [E], but they turned out to average only 1.0% [ I ]. The proportion of profitable outcomes from the 164 [L] prior forecasts was only 60% and the Wins were smaller than forecast and the losses large enough to nearly destroy all gains achieved by the DBA history.
So the visual picture offered by Figure 1 of DBA as large (+20%) gains against small (-3%) losses was incorrect. Most other forecasts turned out to be useful in comparing among investment alternatives, although the actual outcomes still lie ahead in the uncertainty of a 3-month forecast horizon. Some not-encouraging forecasts are just doing their job of guiding investors in making choices toward their hoped-for objectives.
Readers familiar with our analysis methods after quick examination of Figure 2 may wish to skip to the next section viewing price range forecast trends for MOS and ZTS.
Column headers for Figure 2 define investment-choice preference elements for each row stock whose symbol appears at the left in column [A]. The elements are derived or calculated separately for each stock, based on the specifics of its situation and current-day MM price-range forecasts. Data in red numerals are negative, usually undesirable to “long” holding positions. Table cells with yellow fills are of data for the stocks of principal interest and of all issues at the ranking column, [R].
The price-range forecast limits of columns [B] and [C] get defined by MM hedging actions to protect firm capital required to be put at risk of price changes from volume trade orders placed by big-$ “institutional” clients.
[E] measures potential upside risks for MM short positions created to fill such orders, and reward potentials for the buy-side positions so created. Prior forecasts like the present provide a history of relevant price draw-down risks for buyers. The most severe ones actually encountered are in [F], during holding periods in effort to reach [E] gains. Those are where buyers are emotionally most likely to accept losses.
The Range Index [G] tells where today’s price lies relative to the MM community’s forecast of upper and lower limits of coming prices. Its numeric is the percentage proportion of the full low to high forecast seen below the current market price.
[H] tells what proportion of the [L] sample of prior like-balance forecasts have earned gains by either having price reach its [B] target or be above its [D] entry cost at the end of a 3-month max-patience holding period limit. [ I ] gives the net gains-losses of those [L] experiences.
What makes ZTS most attractive in the group at this point in time is its ability to produce earnings most consistently at its present operating balance between share price risk and reward, the Range Index [G]. Credibility of the [E] upside prospect as evidenced in the [I] payoff is shown in [N]. In general, credibility ratios below .80 are not encouraging., but sometimes investors may for the sake of diversification have do deal with less optimal choices.
Further Reward~Risk tradeoffs involve using the [H] odds for gains with the 100 – H loss odds as weights for N-conditioned [E] and for [F], for a combined-return score [Q]. The typical position holding period [J] on [Q] provides a figure of merit [fom] ranking measure [R] useful in portfolio position preferencing. Figure 2 is row-ranked on [R] among alternative candidate securities, with ZTS in second place in a forced comparison..
Along with the candidate-specific stocks these selection considerations are provided for the averages of some 3100 stocks for which MM price-range forecasts are available today, and 20 of the best-ranked (by fom) of those forecasts, as well as the forecast for SPDR S&P 500 Trust ETF (SPY) as an equity-market proxy.
As shown in column [T] of figure 2, those levels vary significantly between stocks. What matters is the net gain between investment gains and losses actually achieved following the forecasts, shown in column [I]. The Win Odds of [H] tells what proportion of the Sample RIs of each stock were profitable. Odds below 80% often have proven to lack reliability.
Recent Forecast Trends of Primary Subjects
Figure 3
blockdesk.com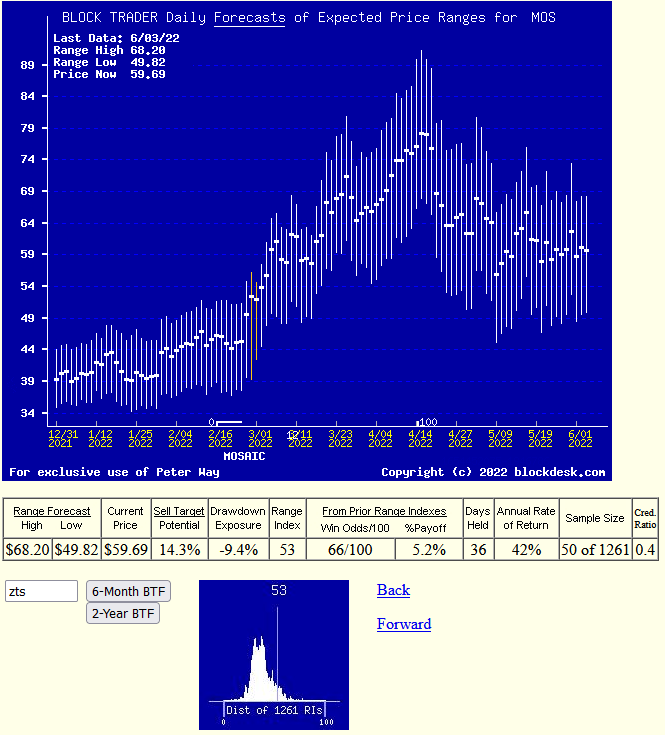
(used with permission)
Figure 4
blockdesk.com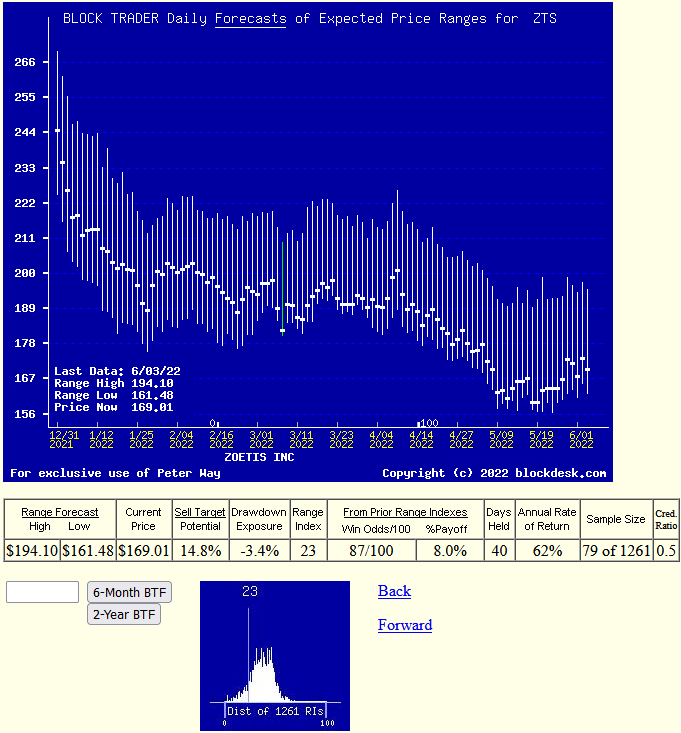
(used with permission)
Many investors confuse any picture of time-repeating stock prices with typical “technical analysis charts” of past stock price history. Instead, Figure 3’s vertical lines are a daily-updated visual record of price range forecast limits expected in the coming few weeks and months. The heavy dot in each vertical is the stock’s closing price on the day the forecast was made.
That market price point makes an explicit definition of the price reward and risk exposure expectations which were held by market participants at the time, with a visual display of the vertical balance between risk and reward.
The measure of that balance is the Range Index (RI). Here in ZTS, 23% of the full forecast range of $161 to $194 lies between the current price of $169 and $161. With today’s RI there is three times as much upside price change in prospect as downside. Seven out of every eight prior forecasts like today’s RI balance have been profitable, leaving some 9 of the 78 earlier with losses. The net of that has been to reduce forecast potentials of +14.8% upsides to net accomplishments of +8.2% gains in 39 market days, or about 8 weeks. So history’s advantage could be repeated 6-7 times a year, which compounds into a CAGR of +66%.
Conclusion
Based on direct comparisons with other Agribusiness industry investment alternatives, there are several clear reasons to prefer a capital-gain seeking buy in Zoetis Inc.
An active investment response would be to temporarily swap capital out of MOS or DBA into ZTS where the principal is sheltered from taxation by its portfolio circumstances.
Be the first to comment