


Serg_Velusceac/iStock via Getty Images
Investment Summary
Shares of Morphic (NASDAQ:MORF) have curled up off long-term lows and caught the attention of our radars. The stock has caught a heavy bid into the new year and lifted 36%. At the same time, its covariance structure to the benchmark has drifted lower, adding weight to its potential as a non-correlated offering. Here I’ll run through our technical findings and illustrate MORF as a tactical buy for those traders looking for a rotation strategy into and out of clinical-stage companies over a medium-term horizon, aiming to harvest short to medium-term alpha. Net-net, our technical observations rate it a buy, seeking a 28%–63% return potential. This is a 1:1.6 risk:reward calculus based on MORF’s current market value.
Exhibit 1. MORF repricing off longer-term lows
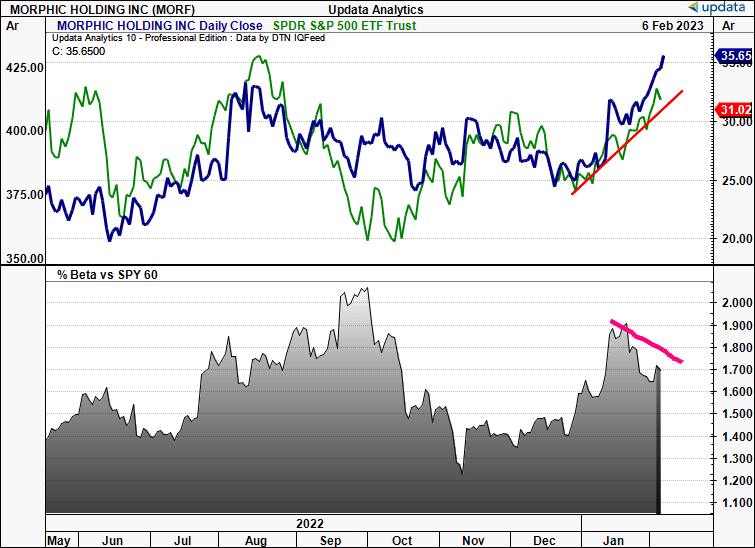
Data: Updata
Note: There are numerous risks that could nullify this trade thesis. Investors must understand these risks before continuing any further, this is imperative. First, there is a chance investors won’t agree with the points raised here and instead choose to selloff MORF in quick succession. The company also has 14% short-interest, and, whilst this could be a bullish catalyst through the short covering if it continues to rally, this also illustrates that investors are betting the stock to move to the downside. A down-move in the broad indices could also lead to a rapid selloff in the MORF share price. It is also a potential that MORF won’t reach the price targets outlined in this report. Investors must realize these risks before reading any further.
MORF advanced technical analysis
MORF recently broke out above its longer-term resistance level and has finished above this mark for the last 3-weeks of trade [Exhibit 2]. It tested this mark in mid-FY22′, however was rejected. Since then it had been backing and filling until December.
At this point, 50DMA crossed above the 250DMA and the price line has closed above this juncture for the last 8 weeks to date. Volume trends reversed at this point and have been pushing higher as well, indicating to us heavy accumulation. This historical data also gives us insights into the trend analysis below.
Exhibit 2. MORF breakout above longer-term range with 50DMA and 250DMA cross in December
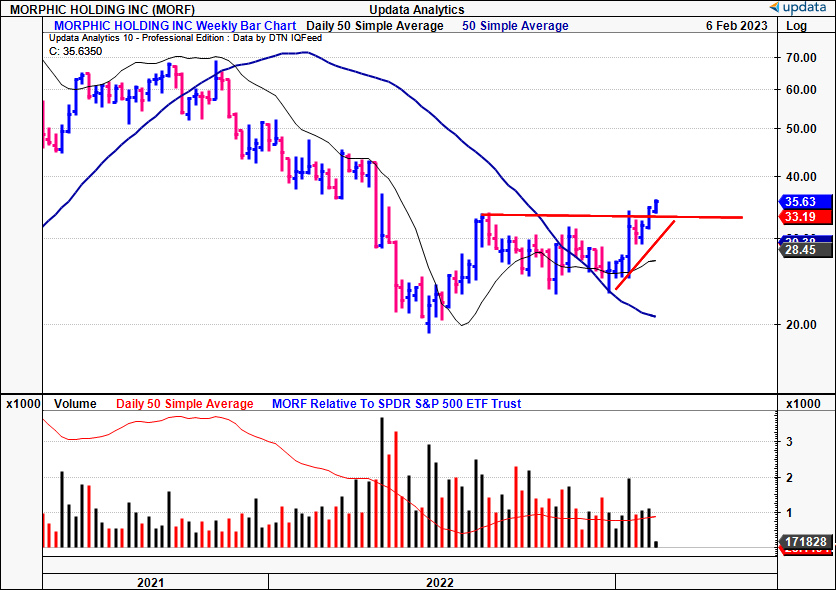
Data: Updata
To see where we currently sit in the trend, we looked at two time horizons. Checking the 60 minute cloud chart, that looks to the coming days of trade, the price line and lagging line are well above the cloud. We are bullish on this setup.
We’ve seen the cloud shift higher as well and widening at the mouth MORF crossed the cloud in mid-to-late January. This cross enables us to trade the price targets on the daily time frame that are discussed later. On this, we see support at $34 over the coming week.
Exhibit 3. Bullish above the cloud on 60-minute time frame

Data: Updata
Next, checking the daily chart, that looks to the coming weeks, we are also bullish after a bullish cross above the cloud in January. The lagging line is in tandem with the price line and this adds to our view that we need to look to a medium-term horizon in this trade. The breakout follows a period of heavy congestion, as shown below.
Exhibit 4. Bullish above the cloud on daily time frame, support at $31 on daily frame

Data: Updata
We have also seen heavy inflows into MORF equity evidencing the demand and re-rating, as shown below. These levels are above the June rally of FY22′. Moreover, they follow heavy outflows over H2 FY22′, and we estimate this evidences a new wave of demand that provides scope for the stock to continue rating higher. In addition, relative strength versus the S&P 500 has shifted up with the MORF share price.
Exhibit 5. Heavy inflows into MORF equity since January sporting new demand to drive price higher
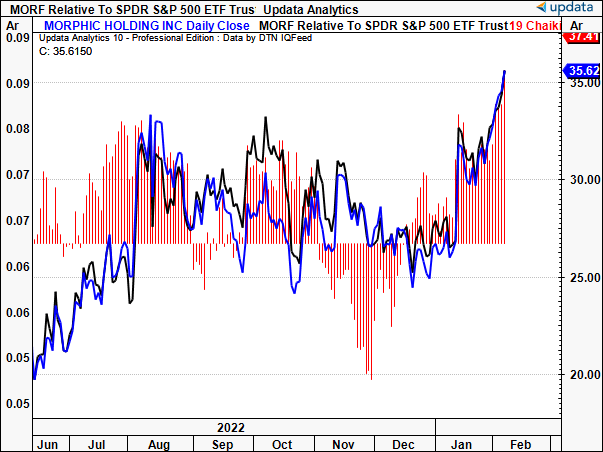
Data: Updata
The quality of buyer has been a standout as well. We check this via the negative volume index (“NVI”). The NVI measures the presence of large buyers, that typically buy on low-volume days, and it has drifted higher since December in lockstep with the price rally. As a reminder, institutional and sophisticated investors have to accumulate positions over a longer period of time, making each allocation as a percentage of the daily liquidity in dollar terms. Hence, when the volume is low, so too is the daily liquidity in dollar terms, providing a better entry point for these buyers to make larger allocations [versus high volume days, where the dollar-based liquidity of the day is higher]. Thus, with the NVI ticking higher in tandem with the rally tells us we have larger tickets as a part of this move.
Exhibit 6. Large buyers active indicating large tickets a part of the rally
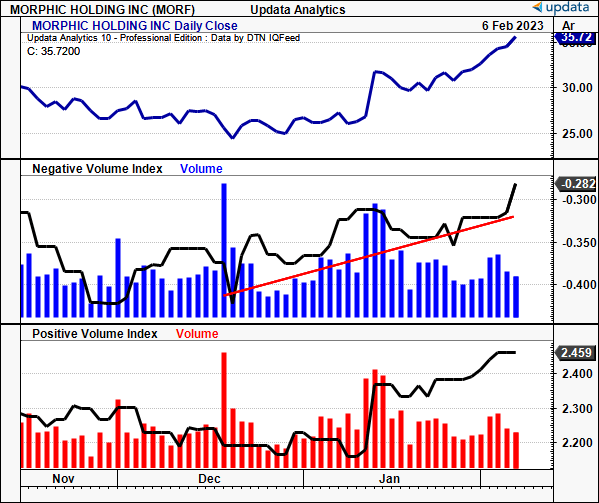
Data: Updata
Market generated data to guide positioning
Tracing the Fibs down from the FY21′ high to the June FY22′ lows, we see the stock has conformed to these levels well over the reversal. First, it backed and filled between the 23%–38% channel of the retracement for the bulk of H2. It then spiked, and is now testing 50% of the down-leg. If it ticks higher, we have the next targets to $41, then $51, and then $67 as a full recovery. If it ticks lower, the next target it $26.
Exhibit 7. Next targets to $41 then $51 on Fibonacci levels

Data: Updata
Looking at the weekly market profile, there’s been heavy demand at each point below the point of control (“POC”) into the new year. Every move higher in price has been corroborated by deep buying levels below the POC, and the value zones have been tightly wrapped around the distribution of volume.
Exhibit 8. Weekly market profile since end of December, strong demand below each POC
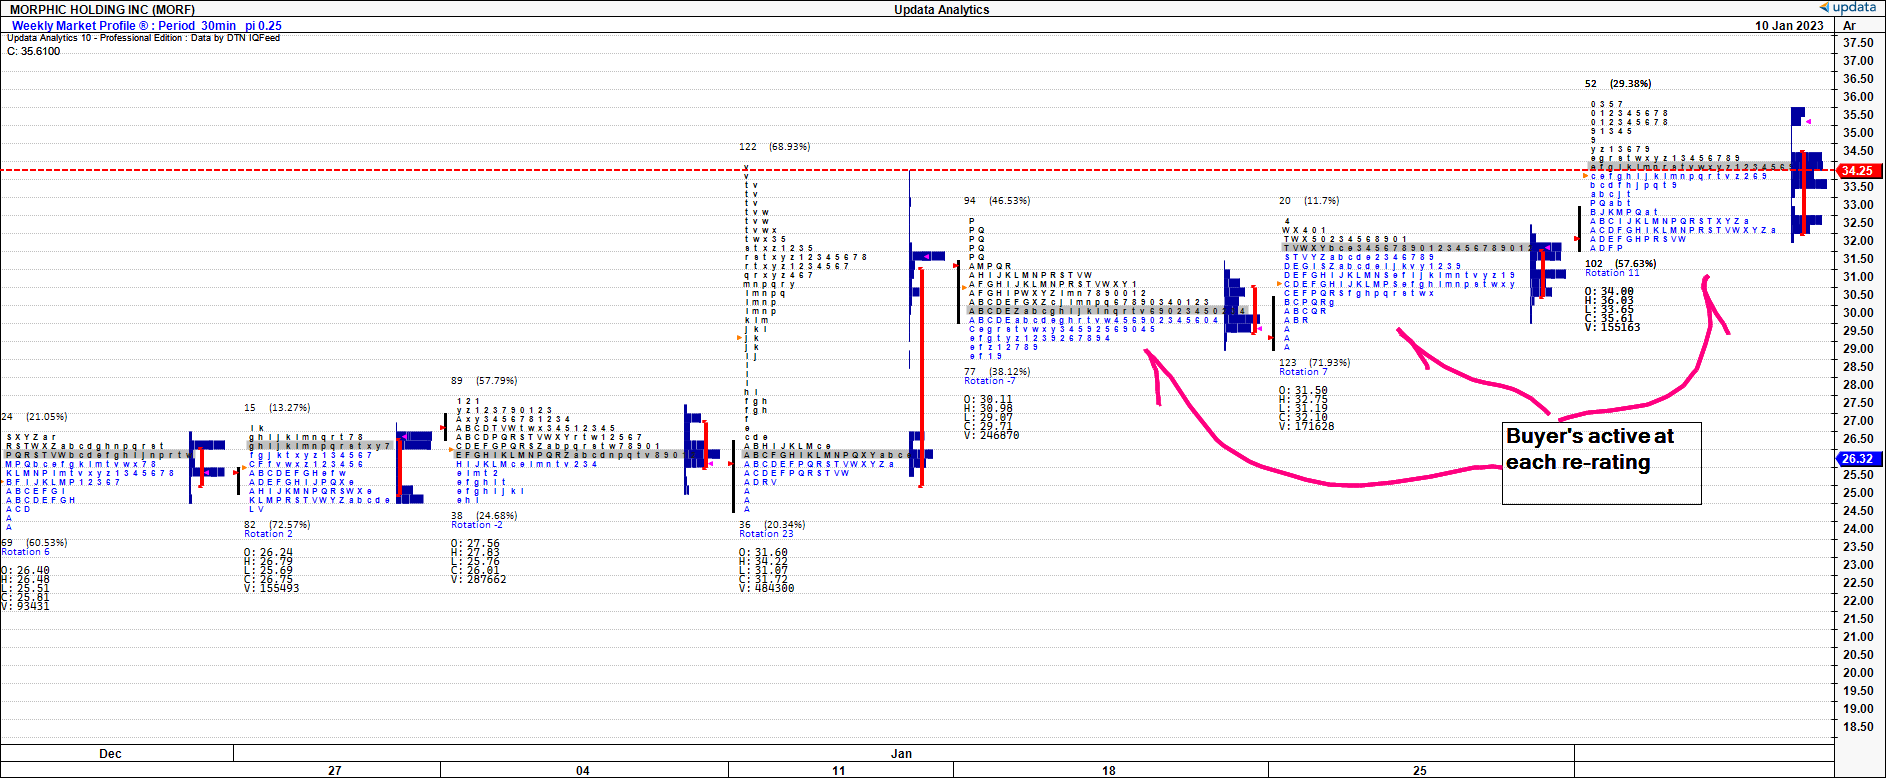
Data: Updata
Turning to the monthly market profile since December, we note the level of demand present below the POC in December and January. The distribution of buyers is heavily skewed below the POC, with confluence from volume skew, indicating how buyers are extremely active on each point of weakness in the rally. This has carried through to February to date. Moreover, the POC, also the market’s estimate of fair value, has shifted higher each month on this series. Underpinning the re-rating, the strong demand profile that continues to demonstrate the stock’s propensity to rate higher.
Exhibit 9. Monthly market profile, skew of demand and volume showing confluence at each point below the POC, indicating propensity to rate higher as buyers continue to allocate on weakness
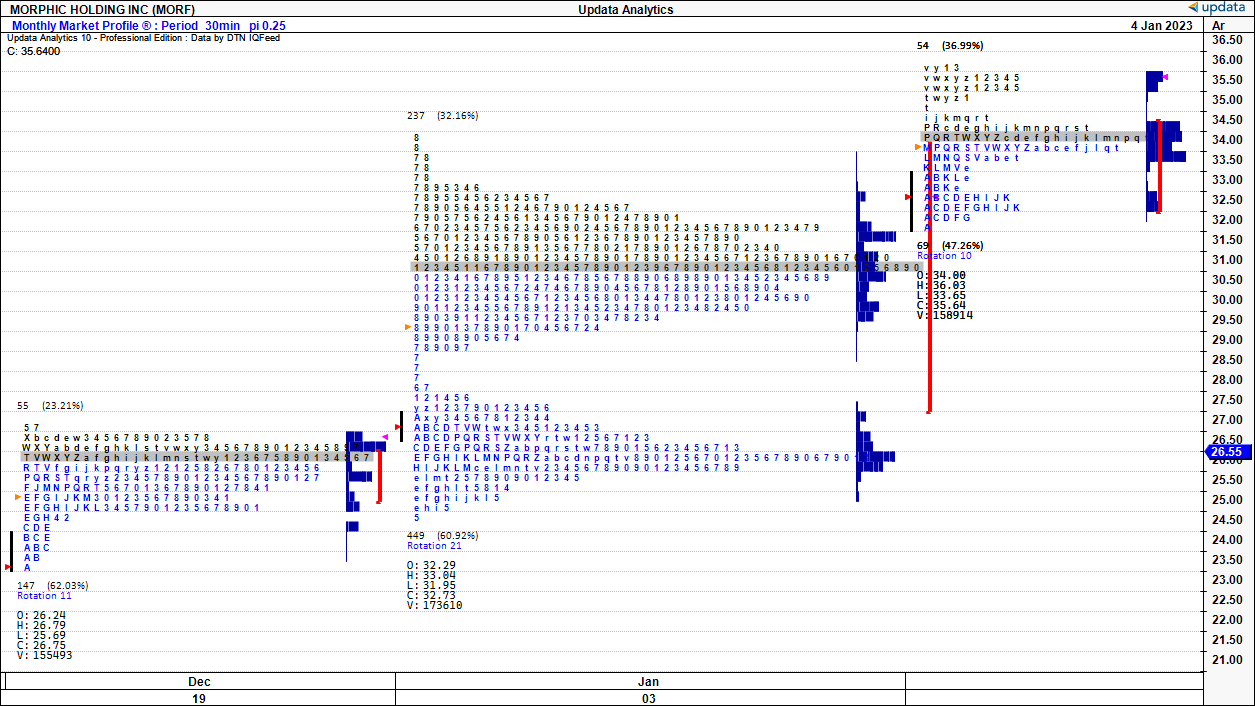
Data: Updata
As such, we have upside targets to $45.50 on our point and figure targets, which would break the longer-term resistance line shown below. This is on the daily time frame, so we’d be looking to the coming weeks for a move to this level. This also sets our first price objective, and fits in well with the Fibonacci levels described earlier.
Exhibit 10. Upside targets to $45 on daily chart
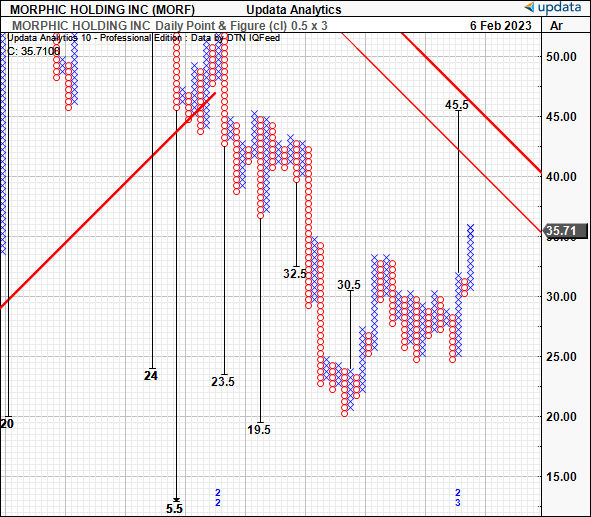
Data: Updata
On the weekly frame, that looks months out, we have upside targets to $57, and we are seeking this as our second objective. This is on a 1×3 box reversal and therefore looks at the prevailing trend, ignoring the short-term noise that distracts us from the directional view of the stock.
Exhibit 11. Upside targets to $57 on longer-term time frame
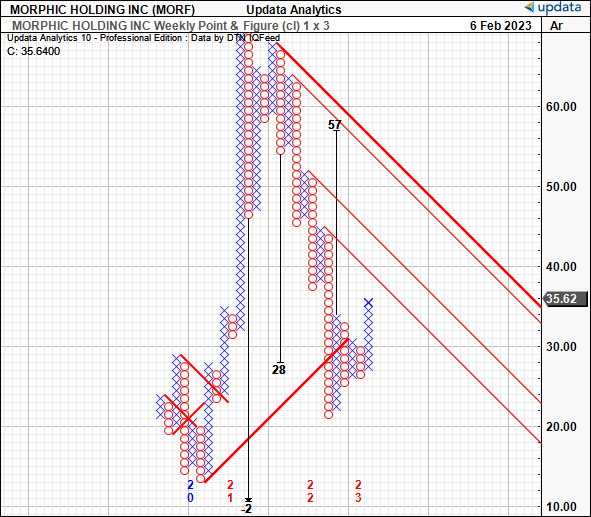
Data: Updata
In short
Net-net, we rate MORF as a buy for technically minded investors looking to harvest tactical alpha over a medium-term horizon. We are eyeing price objectives of $45 then $57, 28% and 62% return potential, respectively. This is a 1:1.6 risk:reward calculus, and we’d be looking to take profits early if the stock is to run to these levels over the coming weeks to months.
Be the first to comment