

Getty Images/Getty Images Entertainment
During last 12 months, Morgan Stanley (NYSE:MS) stock’s price increased from $80 on 12 April 2021 to $108 on 9 February 2022. Since then, the stock’s price has dropped more than 20%. Is it time to buy the dip? Using the free cash flow to equity model (FCFE), I estimate Morgan Stanley’s stock is worth $102 per share (based on my base case scenario). According to Seeking Alpha ratings (Wall Street price target), Morgan Stanley has a low price target of $93, median price target of $109, and high price target of $125. According to my scenarios for MS’s total assets growth rate, capital requirements, and cost of equity, I calculate a fair value of $90 to $119 for the stock. In a word, I’m bullish on the stock.
2021 results
In its fourth-quarter and full-year 2021 financial result, Morgan Stanley reported 4Q 2021 net revenue of $14524 million, compared with 4Q 2020 net revenue of $13597 million, up 7%. Also, the company’s full-year 2021 net revenue increased to $59755 million, up 23% YoY. Morgan Stanley, reported 2021 non-interest expenses of $40083 million, compared with 2020 non-interest expenses of $33578 million, up 19%. The company’s FY 2021 earnings per diluted share increased 24% YoY to $8.03. Moreover, MS’s provision for credit losses dropped from $761 million in 2020 to $4 million in 2021, down 99%. The company reported a 4Q 2021 common equity Tier 1 (CET1) capital ratio of 16%, compared with a 4Q 2020 CET1 capital ratio of 17.4%, down 140 bps. The liquidity coverage ratio (LCR) of Morgan Stanley increased from 129% in 2020 to 134% in 2021. In the next section, I dive deeper into the company’s performance compared with its peers.
Performance
To analyze the management’s ability to keep expenses and revenues in check, I consider Morgan Stanley’s efficiency ratio and compare it with some of its peers. Considering MS’s quarter-over-quarter efficiency ratio indicates that the company has declined its ratio by increasing its revenue and decreasing its expenses. MS’s efficiency ratio at the end of December 2021 declined by 123 bps to 58.85%, compared to the last quarter of 60.08%. Generally speaking, an efficiency ratio of 50% or lower is optimal and a sign of productivity (see Figure 1).
Figure 1 – Morgan Stanley’s efficiency ratio
Author’s calculations based on Seeking Alpha data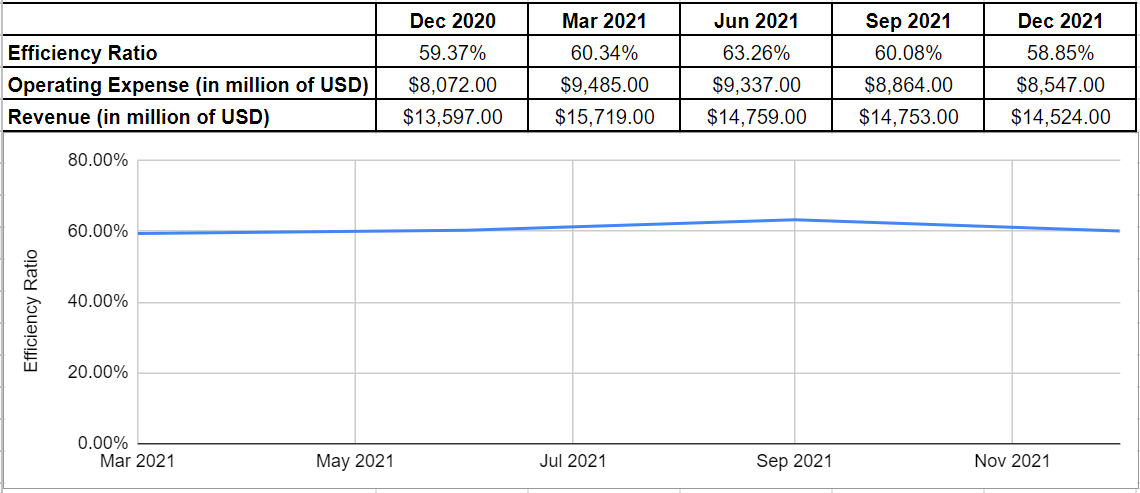
Furthermore, to investigate if the management could generate profits for shareholders and to analyze the productivity of the bank’s operations, the efficiency ratio is a quick comparison tool between the peers. As it is represented in Figure 2, Morgan Stanley’s efficiency ratio declined by 297 bps to 60.73% in 2021, compared to its efficiency ratio of 63.70% in 2020. Among the peers, Citigroup (C) experienced the highest drop, from 77.12% in 2020 to 63.37% in 2021. Also, Goldman Sachs (GS) and JPMorgan’s (JPM) efficiency ratios declined to 53.24% and 54.17%, respectively (see Figure 2).
Figure 2 – Morgan Stanley efficiency ratio vs. peers
Author’s calculations based on Seeking Alpha data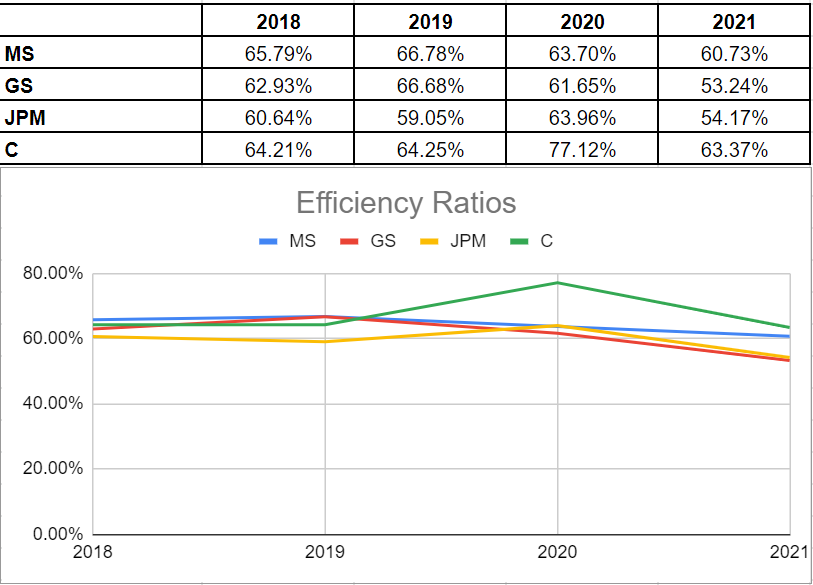
To be more meticulous, combining the efficiency ratio and revenue growth for comparison could provide a better perspective of management’s ability to reward investors. Figure 3 indicates that Morgan Stanley’s revenue growth is 6.96%, which is higher than the peer’s average of 1.68%.
Figure 3 – Morgan Stanley’s revenue growth vs. peers
YCharts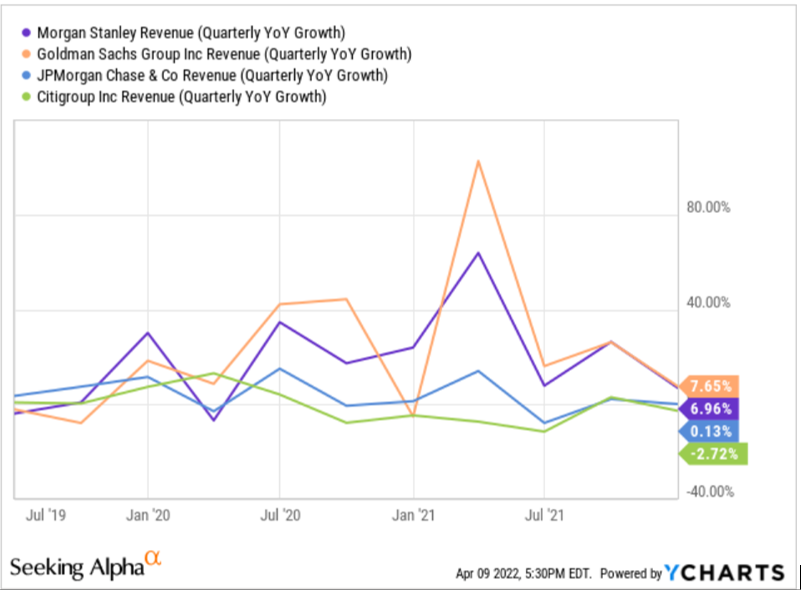
Valuation
Using the FCFE model, I estimate that Morgan Stanley is worth $102.35 per share (according to my base case scenarios). I used two approaches to build a suitable way of using the FCFE model for evaluating Morgan Stanley. According to the first approach of using the FCFE model to evaluate bank stocks, I estimate total assets, total liabilities, common equity tier 1, total risk-weighted assets (RWAs), net revenues, and net income of Morgan Stanley from 2022 to 2032. According to the second approach, I calculate the FCFE of the company (I suggest you read these two approaches to have a better understanding of the procedure of my valuation).
Table 1 shows that from 2018 to 2011, MS’s total assets increased from $854 billion to $1188 billion, up 39%. From 2020 to 2021, the company’s loans to total assets ratio increased from 0.14 to 0.17. It was due to the economic recovery after the Covid-19 vaccination started. Moreover, Table 2 shows that MS’s deposits to total assets ratio increased from 0.21 in 2019 to 0.28 in 2020, reflecting the short-run recession caused by the pandemic. As things are going back to normal, I estimate a loans/total assets ratio of 0.16 for Morgan Stanley. Also, I estimate a deposits/total assets ratio of 0.25 for the company. To estimate MS’s total assets from 2022 to 2032, I use U.S. GDP growth forecasts. The U.S. Bureau of Labor Statistics (BLS) projects that the United States economy will grow by 2.3 percent each year, on average, from 2020 to 2030. Also, based on knoema.com data, U.S. inflation is forecasted to be between 2.1% to 2.4% from 2022 to 2030. According to the U.S. economic growth forecast and U.S. inflation forecast, my base scenario for total assets growth rate is a compound annual growth rate of 5%.
According to Table 1, the total assets/total liability ratio of Morgan Stanley is stable. Thus, I used the total assets to total liabilities ratio of the company to estimate MS’s total liabilities from 2022 to 2032. Also, using the total risk-weighted assets to total assets ratio of the company, which is stable, I predict MS’s RWAs from 2022 to 2032. Morgan Stanley’s Tier 1 ratio (Tier 1 capital to RWAs), has been around 18% during the last four years (under Basel III regulations, a bank’s minimum Tier 1 ratio should be 10.5%). MS’s Tier 1 ratio is 18% in my base case scenario. As MS’s annual RWAs increase, the company will have to increase its Tier 1 capital to maintain the Tier 1 ratio of 18% from 2022 to 2032. Subtracting the change in Tier 1 capital from the net income, I calculate FCFE from 2022 to 2032. Then, using the cost of equity of the company, I calculate the net present value (NPV) of MS from 2022 to 2031. Then, using 2032 estimated data, I calculate the terminal value of the company. Finally, I calculate the equity value and fair value per share of the company.
Table 1 – Morgan Stanley’s stock valuation according to FCFE model
Author’s calculations
Table 2 shows the fair value of MS’s stock according to different scenarios for the company’s total assets growth rate, Tier 1 ratio, and cost of equity. The pace of the economic recovery after the pandemic, the U.S government’s fiscal policy, and the Federal Reserve’s monetary policy will determine MS’s total assets growth. I use four scenarios of the annual growth rate of the total assets from 2022 to 2032: 3%, 4%, 5%, and 6%. From 2012 to 2021, MS’s total assets grew with a CAGR of 4.3%. In my base case scenario, I estimate the company’s total assets will grow with a CAGR of 5% from 2022 to 2032.
According to finbox.com, MS’s cost of equity is between 7.8% to 8.5%. In my base case scenario, I use a COE of 8.13%. Also, I use four scenarios for Tier 1 ratio: 18% (base case scenario), 17%, 16 %, and 10.5% (Basel II minimum requirement). A higher Tier 1 ratio means better risk management, and a lower Tier 1 ratio represents a more risky performance. Considering all the scenarios based on the assets growth rate, Tier 1 ratio, and COE, I estimate the stock is worth between 90$ to $140. I don’t see Morgan Stanley allowing its Tier 1 ratio to drop to 10.5% due to its risk management approaches. Thus, I narrow the stock’s value range down to $90-$120. With a total assets CAGR of 5%, Tier 1 ratio of 18%, and COE of 8.13% (my base case scenario), I estimate MS’s stock is worth $102.35.
Table 2 – Morgan Stanley’s stock value according to different scenarios (the result of the base case scenario is highlighted in Yellow)
Author’s calculations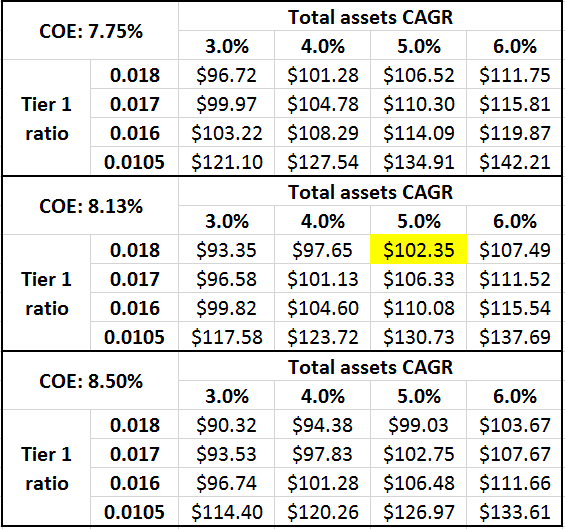
Risk
From 2019 to 2021, Morgan Stanley’s risk-weighted assets increased from $394 billion to $472 billion, up 20%. The company’s common equity Tier 1 capital ratio decreased by 140 bps to 16% from 2019 to 2021. Also, MS’s Tier 1 capital ratio decreased by 180 bps to 17.6% from 2019 to 2021. However, Morgan Stanley’s CET1 ratio and Tier 1 ratio are still higher than the minimum requirements under Basel III standards. Also, the company’s liquidity coverage ratio increased from 129% in 2020 to 134% in 2021, getting back to its level in 2019 (see Figure 4). Under Basel III, a standard LCR is 100%.
Figure 4 – Morgan Stanley’s LCR from 2017 to 2021
Morgan Stanley’s 2021 investor presentation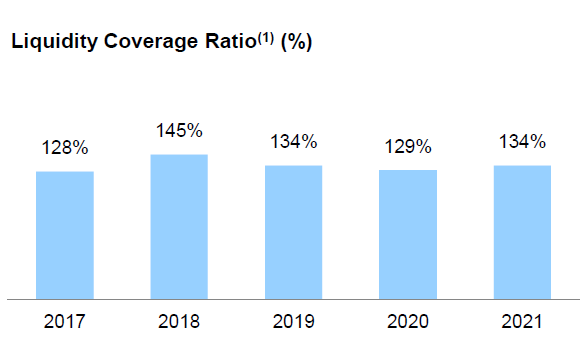
Moreover, compared to the peer group, Morgan Stanley’s net profit margin is lower than the competitors. A lower net profit margin can bring a risk of inefficient cost structure or management strategies (see Figure 5).
Figure 5 – Morgan Stanley’s net profit margin vs. its peers
Seeking Alpha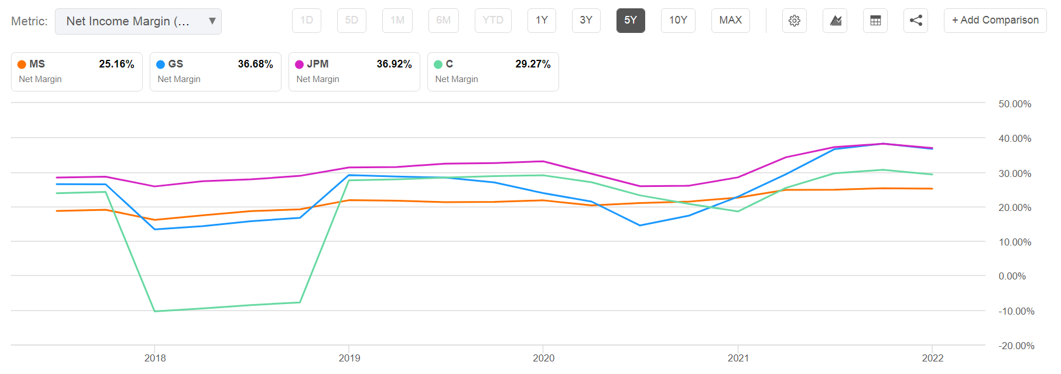
Summary
Morgan Stanley’s earnings per diluted share increased from $6.46 in 2020 to $8.03 in 2021, up 24%. However, the stock’s price is almost the same compared to its price a year ago. I estimate the stock is worth $102 per share (according to my base case scenario). The company will announce its first-quarter 2022 financial result on 14 April 2022. A strong quarterly financial result may push MS’s price up to $100. At prices around $85 (its current prices), Morgan Stanley’s stock is a Buy.
Be the first to comment