

R.M. Nunes/iStock via Getty Images
If you read my previous articles on Seeking Alpha, you know that I am constantly searching for unconventional investment ideas in the universe of the world REITs. Well, today, our starship will make a short stop in lovely Mexico.
Since 2004, Mexico has enjoyed REIT (or, as they call it – FIBRA) legislation and has been trying to develop the popularity of this financial instrument. Today, there are 18 FIBRAs on the Mexican stock exchange BMV, out of which 15 are active members of AMEFIBRA – Mexican Association of FIBRAs.
When I start analyzing a new REIT space, I usually ask myself a question – what would be the annualized return if I invested in the plain-vanilla REIT index of the country? Using statistics of the most transparent public index for tracking the performance of Mexican FIBRAs- S&P/BMV FIBRAS Total Return Index, I found the answer for the period 2012 – 2022. It is c. 10.41% before tax in local currency (MXN), which is quite attractive.
S&P/BMV FIBRAS Index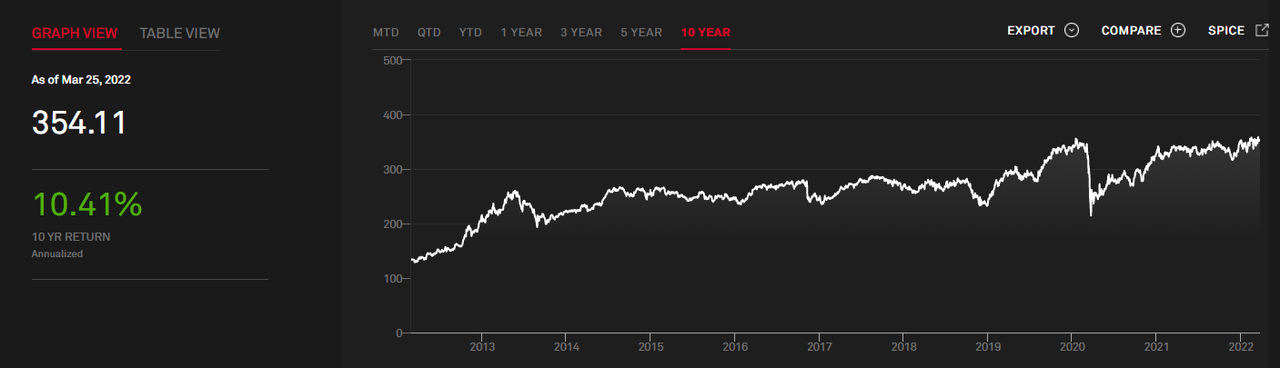
Source: S&P/BMV FIBRAS Index
However, from the point of view of USD investors, the USD / MXN currency pair appreciated ~ (20.3 / 12.8) – 1 = 59% for the last ten years, with a CAGR of 4.72%.
It means that in terms of USD currency, the annualized 10Y return is
(1 + 0.1041) * (1 – 0.0472) – 1 = 5.2%, which seems less attractive than in foreign currency but still acceptable for such an asset class as REITs.
Yahoo Finance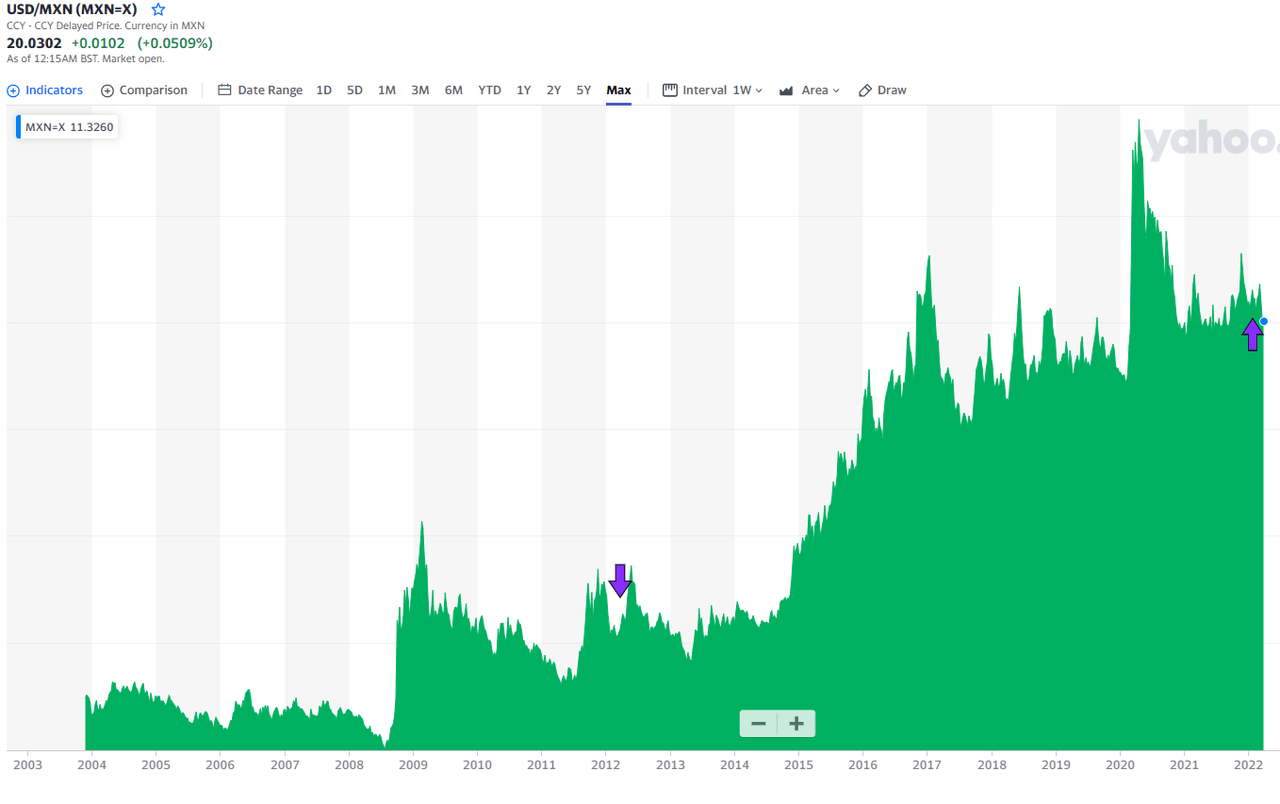
Well, now we know the average result of the index performance.
But what about individual stocks? I set up a table with returns analysis, which encompasses 1Y, 2Y, and 3Y total returns (changing in prices + dividends) in foreign currency for 15 actively traded Mexican FIBRAs (for this exercise, I consider USD to be a local currency for American investors and MXN to be foreign one).
Author’s calculations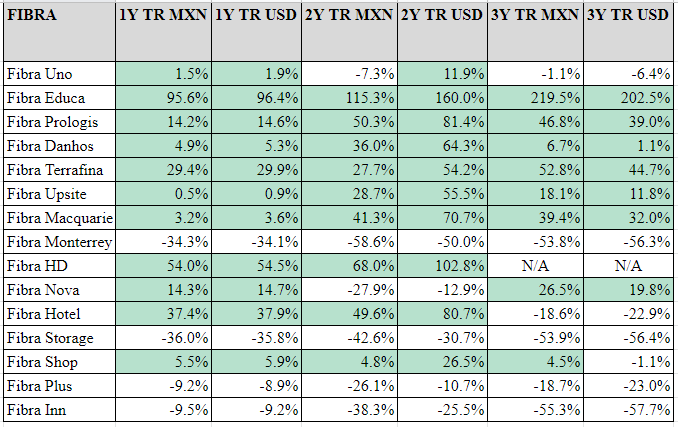
Unlike ten years, for the last three years, the depreciation of MXN against USD wasn’t as severe as in 2012-2018, which means that USD investors, who entered the Mexican FIBRA market after 2018, did not suffer from FX changes so much.
As the primary purpose of this article is get acquainted you with all the musicians of the FIBRA Mariachi orchestra, I, first of all, prepared a consolidated valuation table of all of them (also it is available here: Mexican FIBRAs)
Author’s calculations, based on public data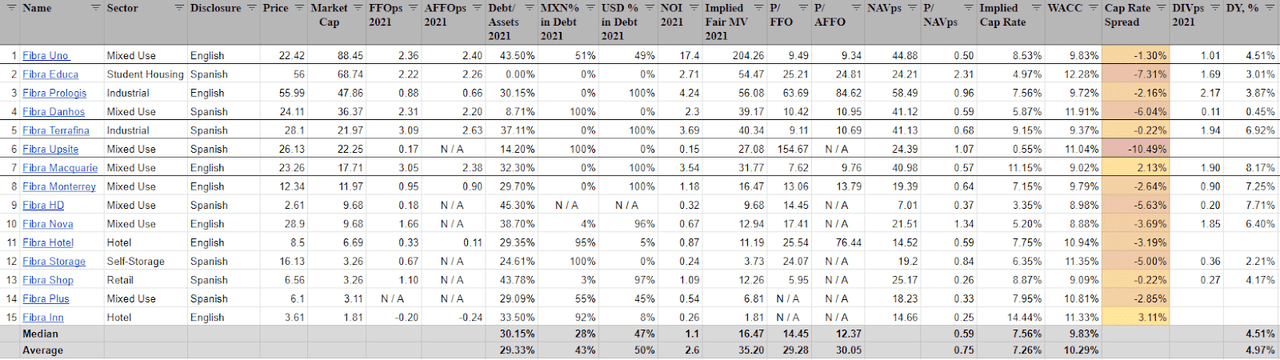
I want to list five conclusions based on the table above:
-
Only 50% of FIBRAs have detailed reports and disclosure of information in the English language.
-
Median P/FFO (14x) and P/AFFO (12x) across the board do not seem exciting to start building positions based on these valuation methods.
-
13 out of 15 FIBRAs are undervalued based on the NAV model (Median NA
-
Only 2 out of 15 FIBRAs have a positive cap rate spread (Macquarie & Inn)
-
The Median 2021 dividend yield before tax is c. 4.5%
Let’s now look at three members of the band, which I will highlight in more detail, and I will try to explain to you my investment ideas behind them:
-
Mixed-use FIBRAs – FIBRA UNO (OTCPK:FBASF) and FIBRA Macquarie
-
Industrial FIBRA Terrafina
FIBRA UNO
It is the largest FIBRA in Mexico in terms of market capitalization. The portfolio as of Q4 2021 consists of 635 properties broken down by Retail, Industrial, Offices, and Others, with 73% of NOI exposure to Retail and Industrial and 55% of GLA exposure to Industrial.
Q4 2021 Presentation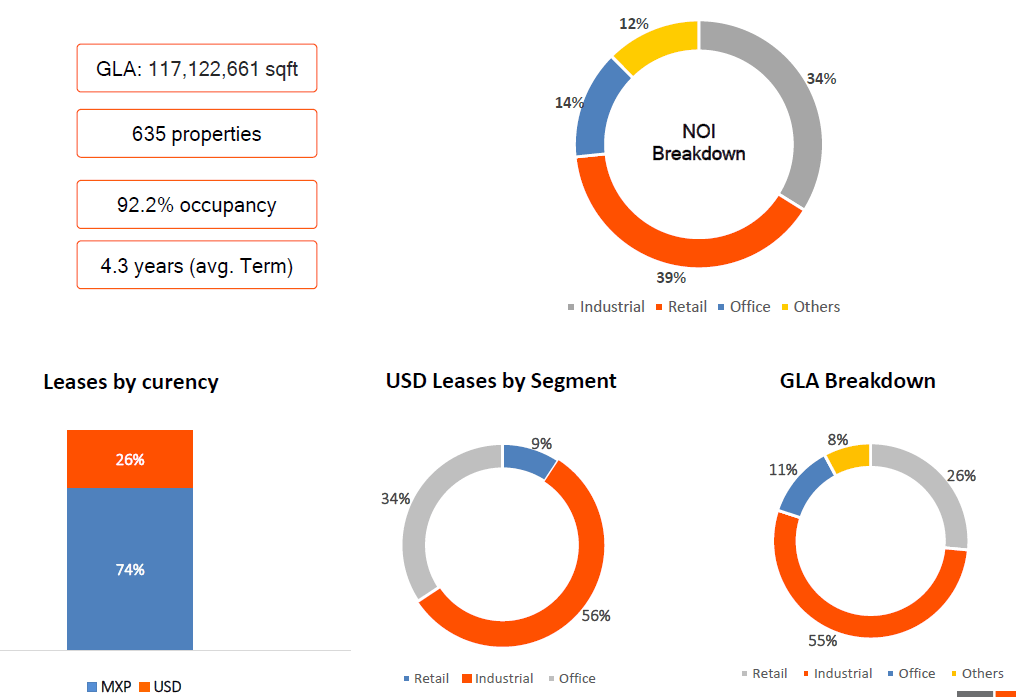
Source: Q4 2021 Presentation
Mexican economic growth is heterogeneous and differs around the country. So, in analyzing Mexican FIBRAs, it is essential to look at what states they concentrate their business presence. Interestingly, UNO has a distribution of Annual Base Rent close to Pareto (55% of total ABR from 2 out of 10 states, or 80% of total ABR from 5 out of 10 states they invested in before). Top 5 States mentioned are Mexico City (CDMX), State of Mexico (EDO MEX), Jalisco (JAL), Nuevo Leon (NL) and Quintana Roo (QR).
Q4 2021 Presentation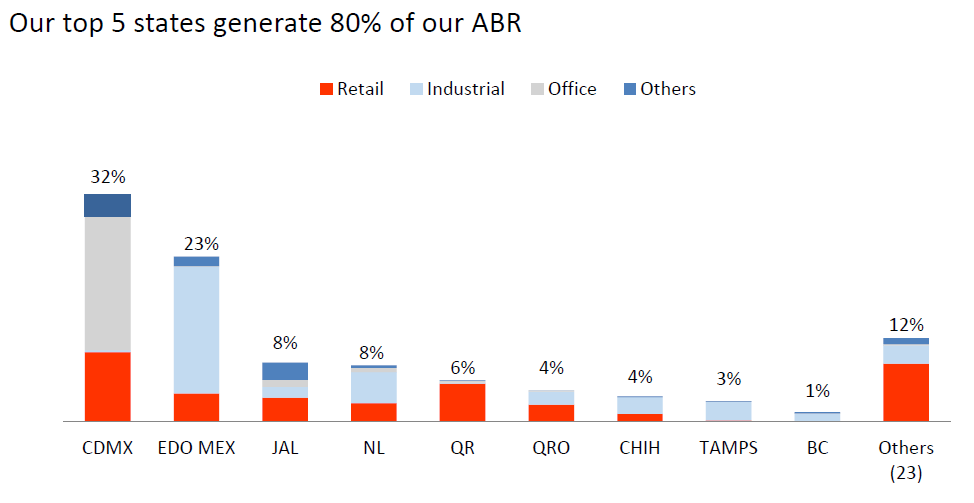
Source: Q4 2021 Presentation
An important fact is that UNO has a negative spread between weighted average lease expiry (WALE) of 4.3 years vs. Average Debt Maturity of 9.4 years, which I consider a risk factor despite the quality of properties.
From my standpoint, the leading investment idea here is to buy a future development upside over the short-term period. Currently, the total GLA of UNO’s portfolio is c.116M sq. feet. However, the management wants to add several assets from the development portfolio to operations, including a massive Mitikah Project in Mexico City, which will increase the total GLA by only 3.5% by 2024.
March 2022 Presentation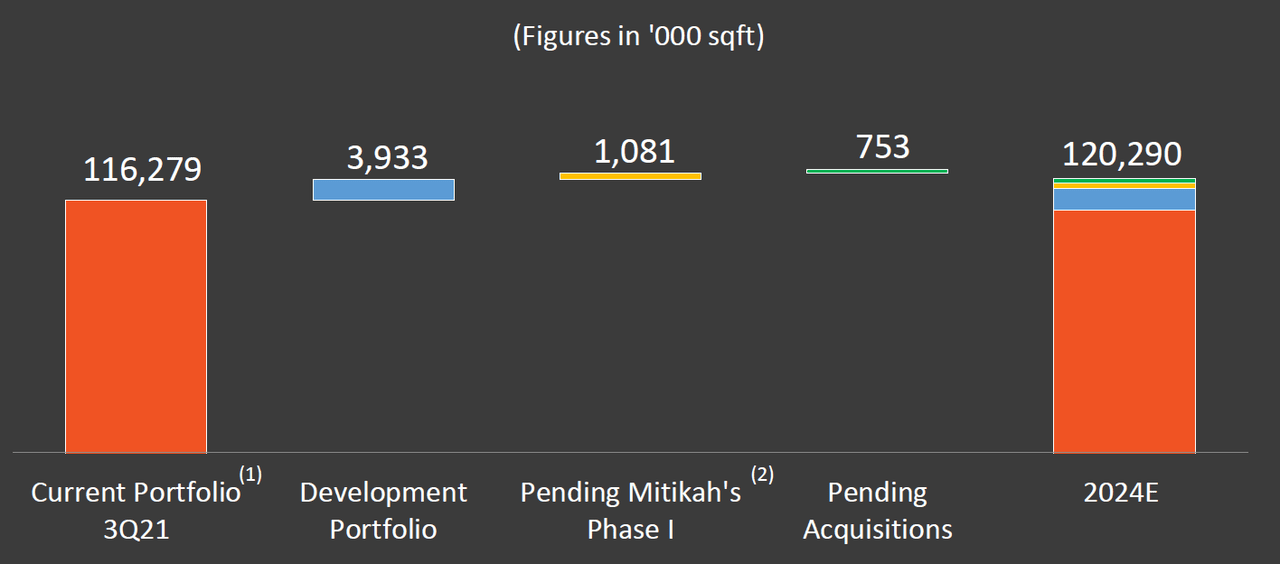
Source: March 2022 Presentation
However, despite the seemingly little effect on GLA, the financial effect is supposed to be much more significant: NOI is forecasted to grow by 33% and FFO – by 56%.
March 2022 Presentation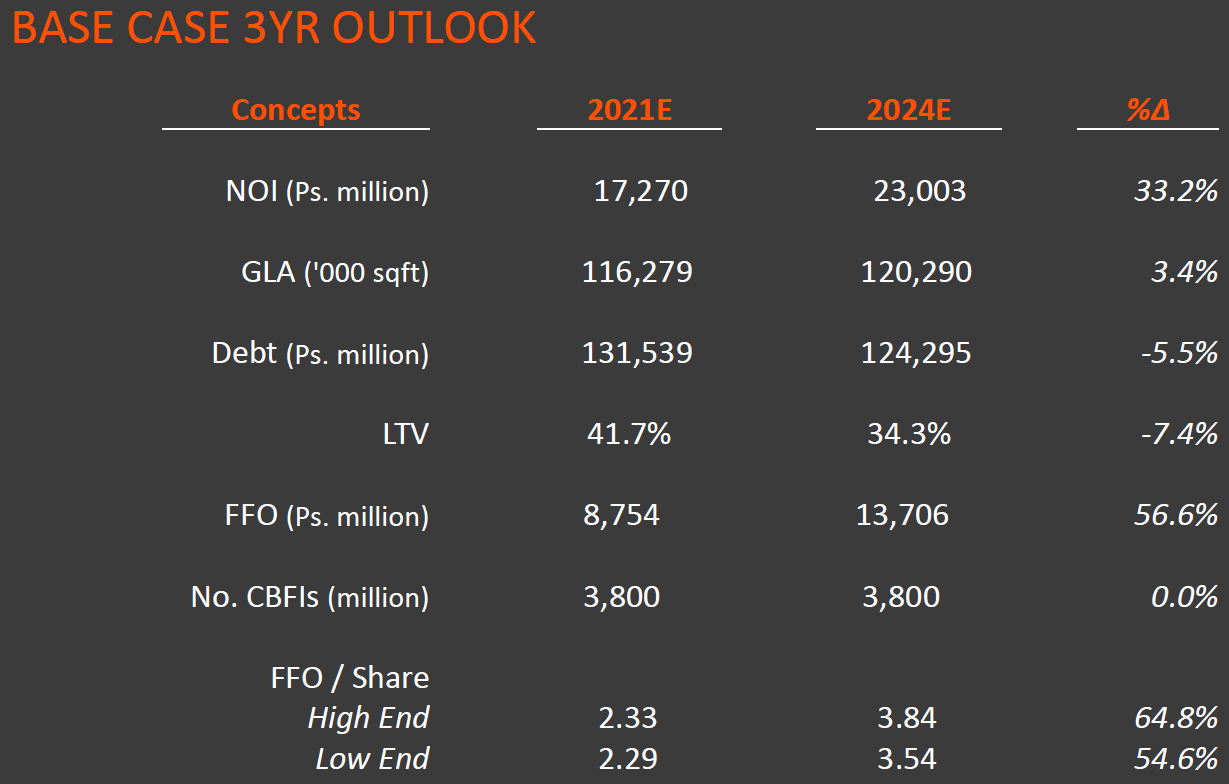
Source: March 2022 Presentation
I am looking positively at adding FIBRA UNO to the investment portfolio, weighing the attractive valuation from my analytical table above and its general investment thesis.
FIBRA Macquarie
As of Q4 2021, this Mixed-use FIBRA has 253 properties (236 Industrial and 17 Retail). Geographically, its main Industrial assets are located in the northern states of Mexico, and its Retail assets are in the country’s center.
Q4 2021 Presentation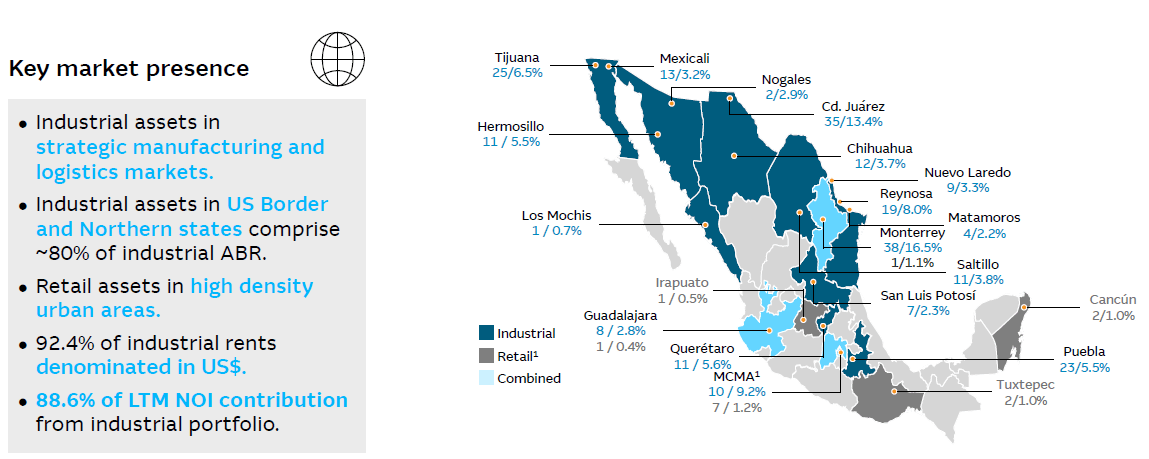
Source: Q4 2021 Presentation
Its industrial portfolio is mainly located in Northern states of Mexico, a high industrial demand region benefiting from compelling tailwinds.
Q4 2021 Presentation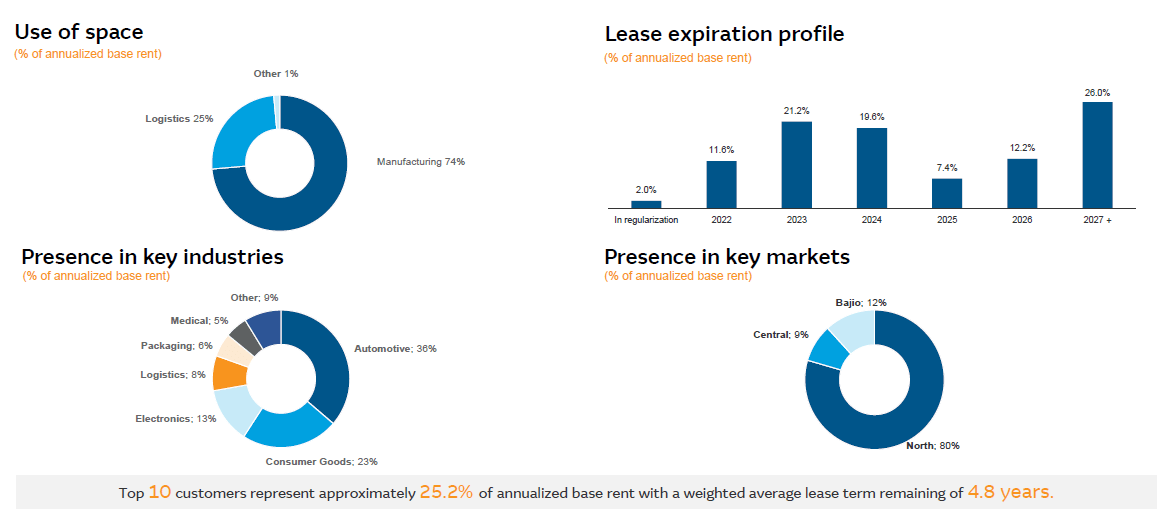
Source: Q4 2021 Presentation
The high-quality Retail part of the portfolio played a defensive role and is located in the most densely populated area of the country – Mexico City Metropolitan Area (MCMA).
Q4 2021 Presentation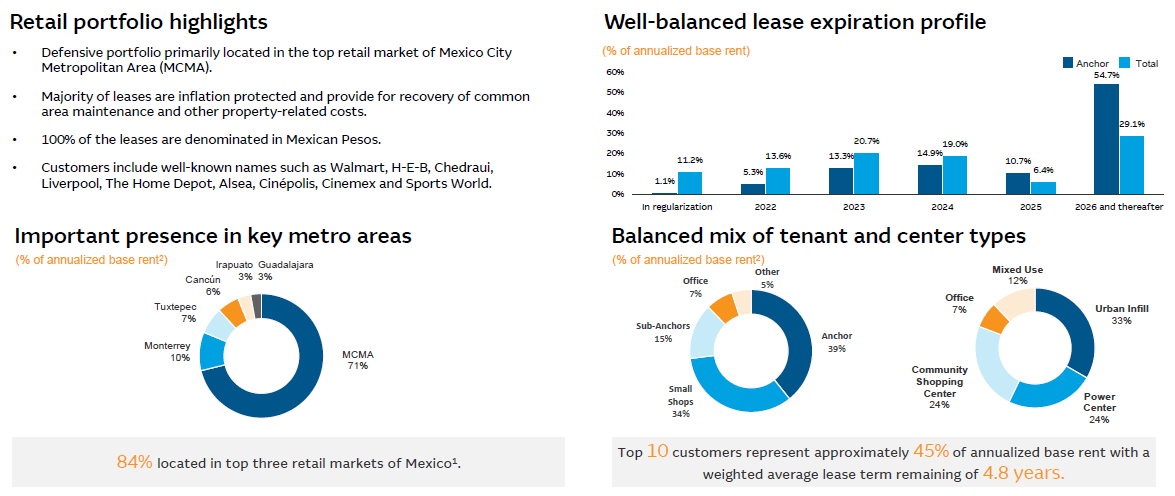
Source: Q4 2021 Presentation
The plans of Macquarie’s management are also quite interesting as they want to increase the GLA of the Fund by 15% (from 36 mln. sq. feet to 41 mln. sq. feet) within only five years, require a disciplined execution of the deal pipeline.
Q4 2021 Presentation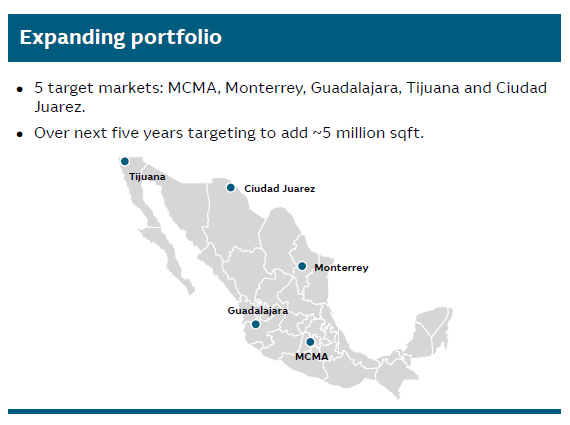
Source: Q4 2021 Presentation
FIBRA Macquarie is my top pick out of all 15 analyzed companies because of three reasons:
-
Firstly, it is the best amongst its peers in terms of P/FFO, P/AFFO, NAV, and Cap Rate Spread valuation models, according to my analysis
-
Secondly, it has a good business currency matching – 85% of NOI is USD-based vs. 97% of debt denominated in USD
-
And thirdly, I think that the investment idea behind it – buying a vehicle that enables you to make gains from:
-
Future growth of e-commerce logistics in Mexico and
-
Access to a skilled and competitive labour force (Average USD/hour compensation for manufacturing workers in Mexico is less than in China in 2021, worth paying attention to.
-
Conclusion
In the end, I would like to point out that companies mentioned in my analysis can be acquired through local US brokers or international ones such as IB (Interactive Brokers). Also, US-based investors will have to pay a 10% Mexican Dividend Tax while holding these assets in their portfolios.
Be the first to comment