

J. Michael Jones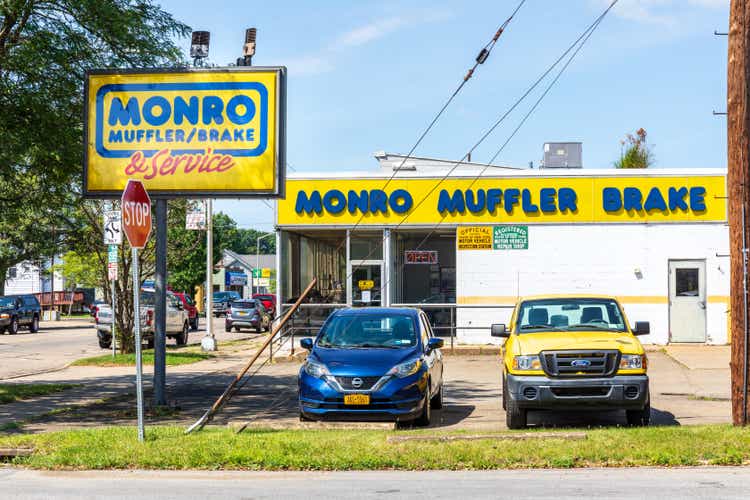
The market can be extremely volatile from time to time. In fact, many would argue that the market has not been more volatile in many years than it has been this year. This volatility can push most companies down significantly. But the benefit to buying cheap stocks is that you get the opportunity to have limited downside so long as those cheap stocks are of sufficient quality. A great example of this strategy playing out can be seen by looking at Monro (NASDAQ:MNRO). This firm which operates tire and automotive service shops, has done quite well in recent months. And while I would say that the company is more or less fairly valued compared to similar firms, I do think that it’s cheap enough to retain the ‘buy’ designation I placed on it previously.
Kicking the tires
The last time I wrote an article about Monro was in April of this year. In that article, I acknowledged that the company had been punished by investors in the months leading up to that point. The pain was so significant that it was indicative of a company with poor fundamental performance. However, performance for the company leading up to that point had actually been strong and there were no obvious signs of that picture changing in the near term. This, combined with how cheap shares were on an absolute basis, led me to rate it a ‘buy’. When I give a company this kind of designation, I am taking the stance that it will likely drastically outperform the market for the foreseeable future. So far, Monro has achieved just that. Why are the S&P 500 is down by 13.6%, shares of this firm have actually generated a profit for investors of 0.2%.
Author – SEC EDGAR Data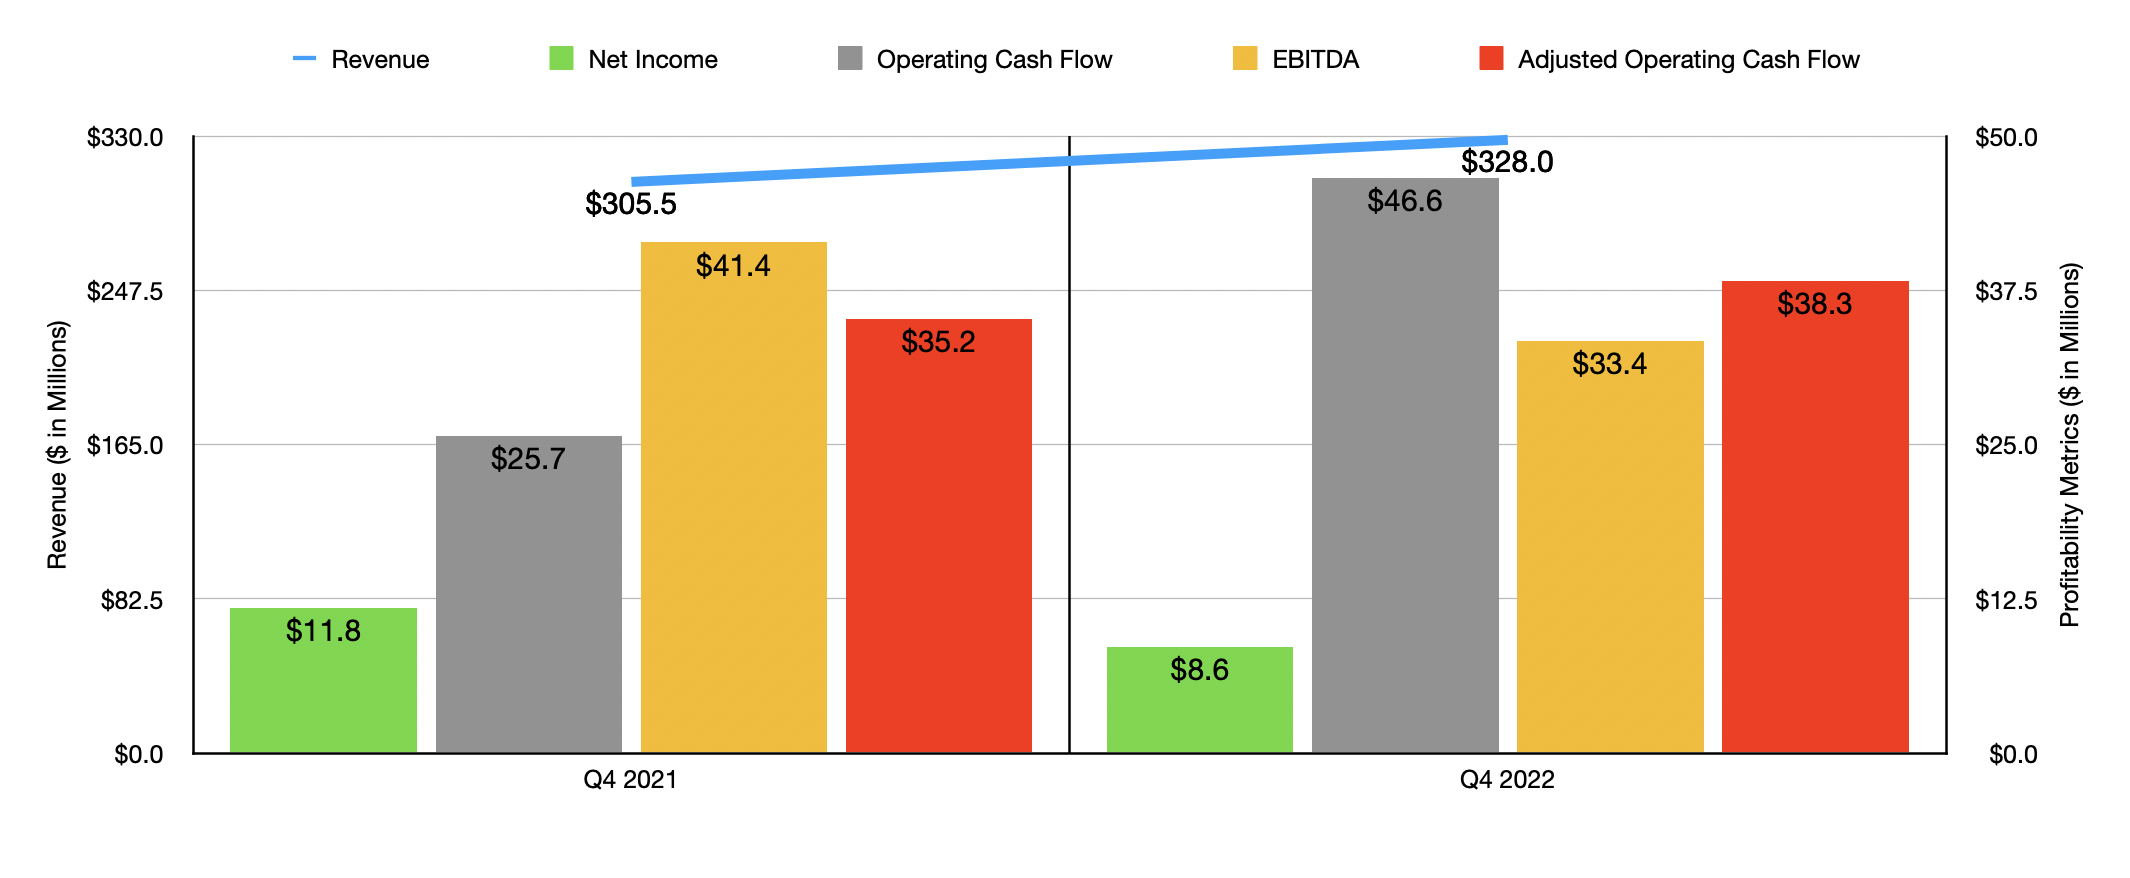
When I last wrote about Monro, we had data covering through the third quarter of the company’s 2022 fiscal year. Fast forward to today, and that data now covers the final quarter of that year as well. And while that quarter was not perfect, the overall picture for investors was largely positive. Consider, for instance, revenue. During that time, sales came in at $328 million. That represents an increase of 7.4% over the $305.5 million reported the same quarter one year earlier. According to management, of the $22.5 million in increased revenue, $19 million was attributed to new stores, largely as a result of acquisitions the company made. However, it also saw comparable store sales rise by 1.4% year over year.
While revenue was higher, profitability was somewhat mixed. Net income in the final quarter came in at $8.6 million. That was down from the $11.8 million reported the same time one year earlier. This was driven in large part by a 3.2% decline in the company’s gross margin. Most of this decrease, however, which driven by incremental investments that the company made into its technician headcount and wages. Although net income was lower, operating cash flow managed to rise year over year, climbing from $25.7 million to $46.6 million. If we adjust for changes in working capital, the picture does not look quite as great, with the metric inching up from $35.2 million to $38.3 million. Meanwhile, EBITDA for the quarter fell from $41.4 million to $33.4 million.
Author – SEC EDGAR Data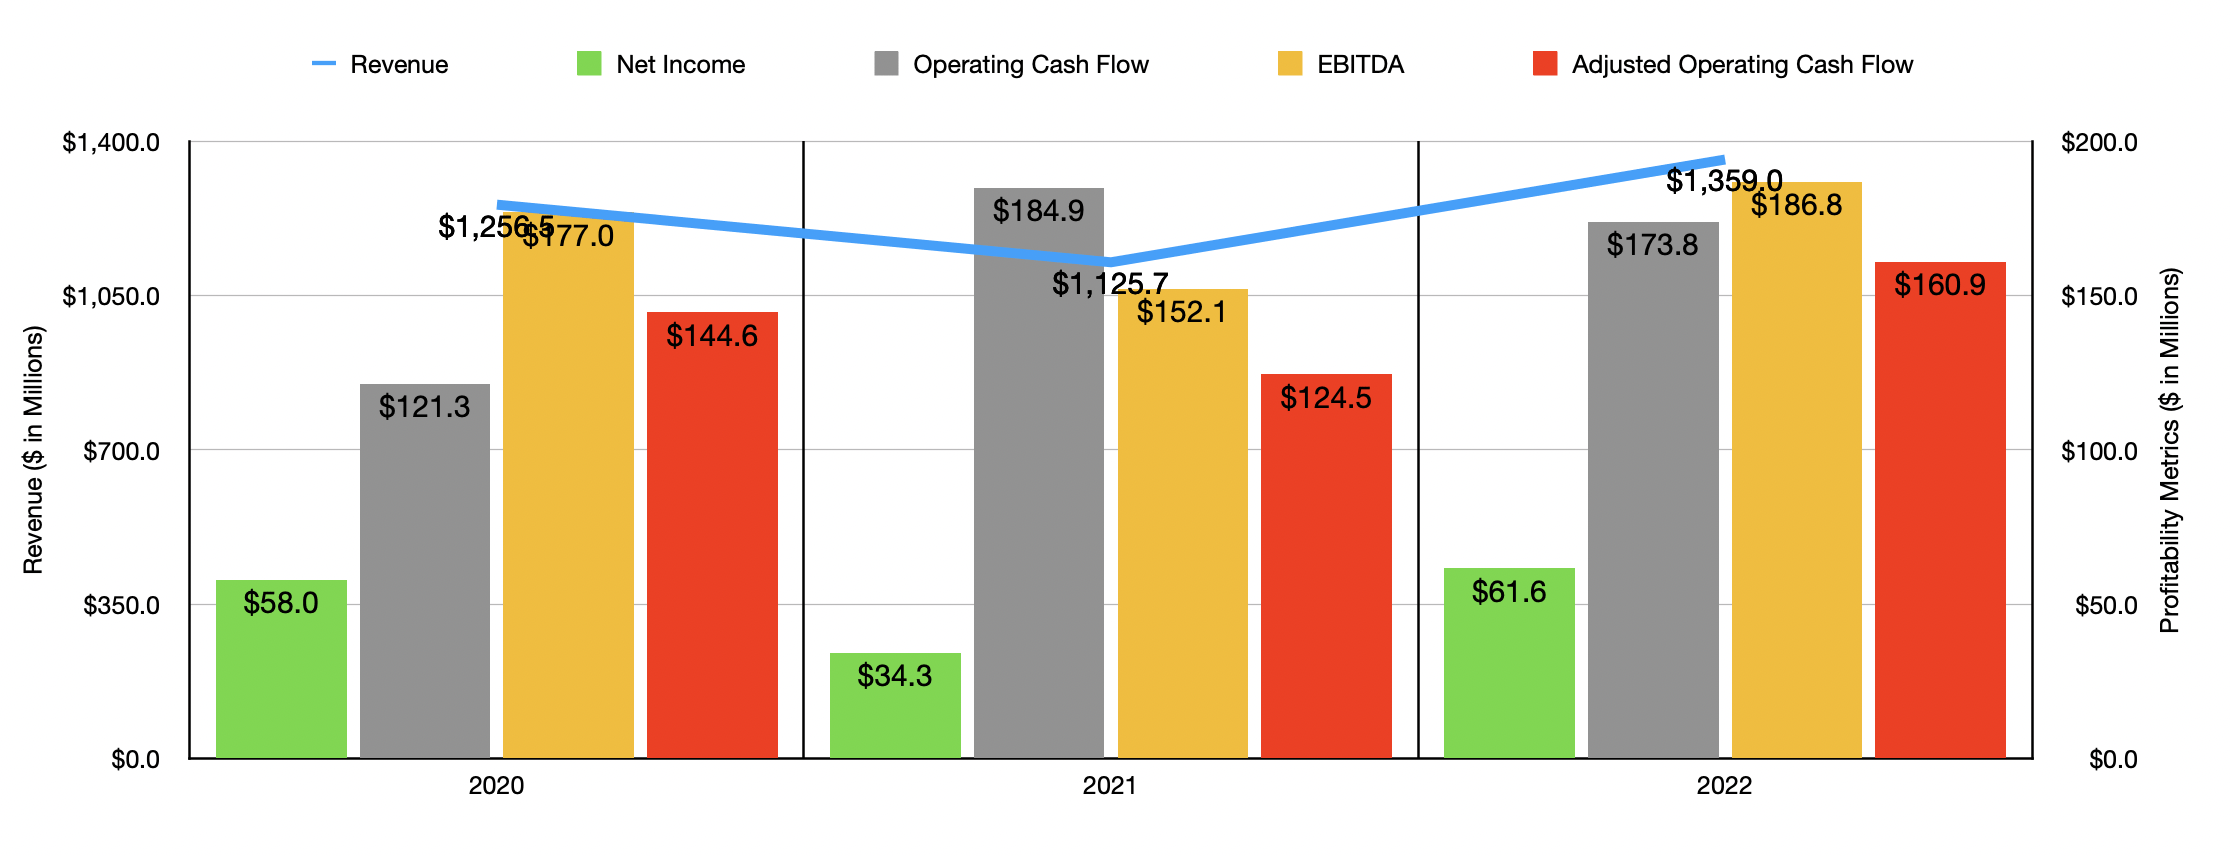
Overall for the 2022 fiscal year, the company’s results came in quite strong. Driven by a combination of acquisitions and strengthening comparable store sales, revenue rose from $1.13 billion in 2021 to $1.36 billion in 2022. Profitability also followed the company higher. Net income of $61.6 million came in above the $34.3 million the company reported just one year earlier. However, this net income was only marginally higher than the $58 million the company saw in 2020. Unfortunately, not every profitability metric was stronger. Operating cash flow actually decreased, falling from $184.9 million in 2021 to $173.8 million last year. If we adjust for changes in working capital, however, we would have seen an improvement, with the metric climbing from $124.5 million in 2021 to an impressive $160.9 million last year. The 2022 figure was even higher than the $144.6 million the company generated in its 2020 fiscal year. Another metric that improved year over year was EBITDA. It ultimately rose from $152.1 million in 2021 to $186.8 million last year.
At present, management is refraining from providing any real guidance for the current fiscal year. In part, this is because of the company’s decision, earlier this year, to sell off its wholesale tire distribution assets, currently known as Tires Now, to American Tire Distributors. It’s unclear what kind of impact this will ultimately have on the company and management has not provided any guidance on the impact that it will have on revenue or profitability. But we do know that the deal is being done at a valuation of $105 million, with $65 million of it being paid at closing and the other $40 million being paid in quarterly installments over an unspecified period of time.
Author – SEC EDGAR Data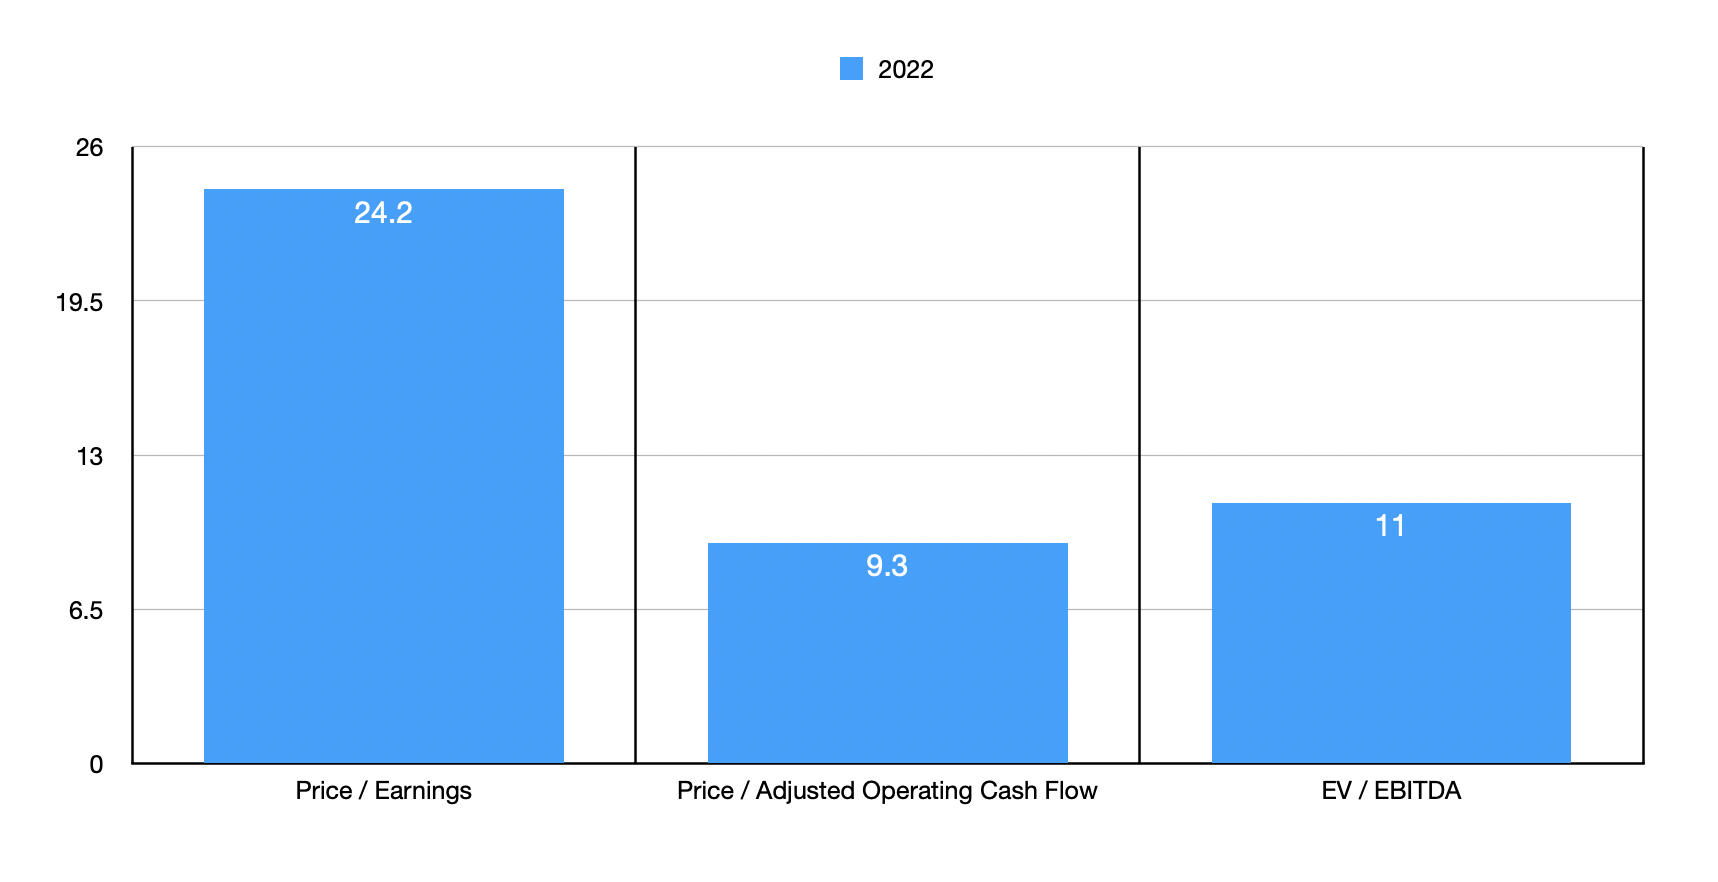
Because of this absence of guidance and since we don’t have any data covering the 2023 fiscal year yet, it would be best to value the company based on its 2022 results. On a price-to-earnings basis, the company is looking rather pricey with a multiple of 24.2. However, using other financial figures, shares look quite attractive. On a price to adjusted operating cash flow basis, the firm is trading at a multiple of 9.3. And the EV to EBITDA multiple comes out to 11. Even though shares of the business do still look cheap on an absolute basis, they are a bit pricier than what I forecasted in my prior article. Forecasting out results, I ended up with a price to adjusted operating cash flow multiple of 5.6 and an EV to EBITDA multiple of 10.1. To put the pricing of the company into perspective, I also compared it to five similar firms. On a price-to-earnings basis, these companies ranged from a low of 4.4 to a high of 21.5. In this case, Monro was the most expensive of the group. Using the price to operating cash flow approach, the range was from 2.2 to 16.1. And using the EV to EBITDA approach, the range was from 4.9 to 14.7. In both cases, two of the five companies were cheaper than our prospect.
| Company | Price / Earnings | Price / Operating Cash Flow | EV / EBITDA |
| Monro | 24.2 | 9.3 | 11.0 |
| Advance Auto Parts (AAP) | 20.6 | 16.1 | 11.7 |
| Sonic Automotive (SAH) | 4.6 | 5.0 | 6.2 |
| O’Reilly Automotive (ORLY) | 21.5 | 15.3 | 14.7 |
| AutoZone (AZO) | 19.1 | 14.0 | 13.3 |
| Group 1 Automotive (GPI) | 4.4 | 2.2 | 4.9 |
Takeaway
Fundamentally speaking, the picture for Monro still looks quite appealing. Shares are not as cheap as when I previously valued the business. Put on the whole, they still look attractive. Meanwhile, they are more or less fairly valued compared to similar firms. All of these factors, combined, lead me to still rate the business a ‘buy’, but my conviction in doing so is not quite as strong as it was previously.
Be the first to comment