

Jeff Kingma/iStock Editorial via Getty Images
Introduction
Today, many of us have the optionality to invest in the cream of the crop when it comes to global financial market instruments. No matter where we are domiciled, our money can transcend borders and go to work for us wherever the opportunities may be. The global markets are our oysters. And I believe in taking full advantage. Currently, I see opportunities for the UAE (NASDAQ:UAE) market to outperform the S&P 500 and also give positive absolute returns after a brief drop down to the support location.
As this is my first technical analysis article, let me describe how I conduct technical analysis in the following couple of sections:
What Makes The Markets Move?
I asked myself this question in early 2018 after a series of bad investments. Eventually, I came to the conclusion:
It doesn’t matter how you identify yourself in the financial markets. It doesn’t matter whether you’re a classic value, growth chaser, leveraged speculator, index fund accumulator, scalper, an AI or a monkey throwing darts. The market doesn’t care about you. At the root of it all, there is only one true answer for what makes the markets move; the actions of the incremental buyer or seller.
This is trivial, but it is now the bedrock of the investing approach I use to generate alpha from the markets. See my bio for more details. Specifically, I look for opportunities where there is likely to be a strong wave of incremental buyers or sellers over the next few weeks and months. To do this, I have a…
3-Point Checklist
1. Flow
First, I assess the flow of the past transactions in the markets, as measured by where the prices are moving, paying close attention to the speed of the moves. I always aim to position myself along with the incumbent flow or trend.
2. Location
This refers to identifying support and resistance levels. But there are so many ways to do this. How do I identify the most relevant and critical levels? The secret is in looking for key levels from which there has been a sharp, volatile reaction. As Kirk Northington, CMT describes:
[what’s] important is the proximity of price to previous volatility extremes.
3. Trap
When a good flow is present and price is at an important location in terms of proximity to previous volatility extremes, the last necessary ingredient for me is a trap. What do I mean by this? How many times have you been shaken out of positions even when you were going with the right flow and trend, at the right locations, perhaps even with a strong fundamental rationale to back you? And immediately after the market forced you to fold your hand, how many times has it moved swiftly in the direction you had originally anticipated?!
To avoid this, there is an effective solution by adding 1 more rule to your trading and investing approach:
Only enter a trade after it’s clear that other traders have gotten trapped on the wrong side.
How can one tell that other traders have been trapped on the wrong side? I believe the simplest and most effective way is to wait for false breakouts to occur and trade alongside failed breakouts. This is in-line with Wyckoff’s Spring principle that often follows from an accumulation zone of sideways movement:
False breakout/Wyckoff’s Spring (TradingView, Author’s Analysis)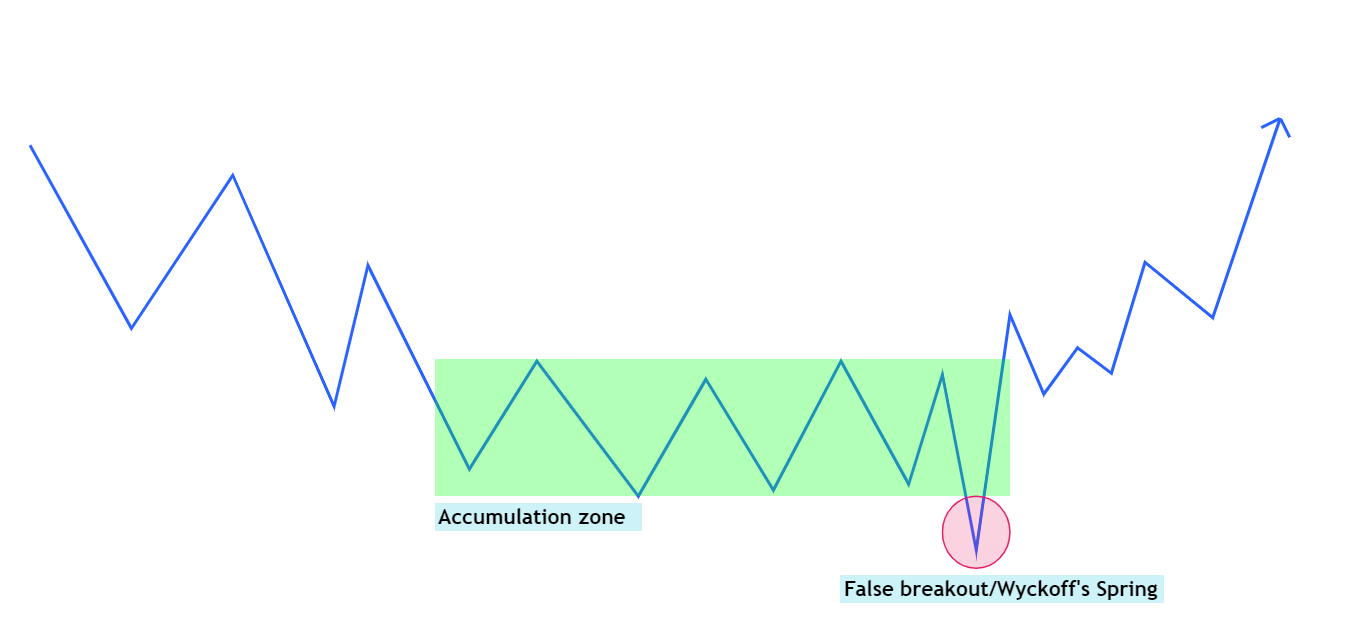
As you will see in the sections below, I keep my technical analysis very simple. I focus on reading price and volume charts without any indicators. My reasoning is, indicators put a filter on the raw price and volume data, making it prone to an additional layer of interpretation errors in the form of false positive or false negative signals. Instead, I prefer to focus on reading the footprints of the big money in the markets directly:
Reading the Market Footprint (Author’s Image)
That’s enough preamble about the concepts. Time to apply it to the current market scenario and make some alpha!
Go Where the Money Flows
The US indices; S&P 500 (SPY), Dow Jones (DJI), the Nasdaq (QQQ) and others have seen sharp falls over the last couple of days due to concerns of a recession and fears of sustained hikes by the Federal Reserve. Some market analysts are calling for a move back down towards 3500 on the S&P 500. Although I am usually fully invested, I too moved my portfolio to >70% USD cash exposure over the last couple of days:
Portfolio Snapshot (Author’s Portfolio Snapshot from Interactive Brokers)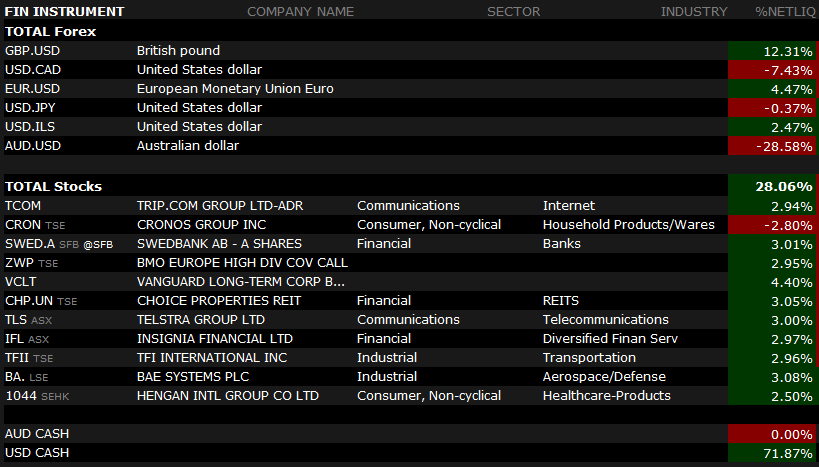
I have published fundamental analysis write-ups on BAE Systems (OTCPK:BAESF) (OTCPK:BAESY) and Cronos Group (CRON:CA) (CRON) here. The BAE Systems has been recognized as ‘Top Idea’ by the Seeking Alpha PRO Team.
I anticipate prices on SPY to reach at least 3725 in the current downswing:
S&P500 Anticipation (TradingView, Author’s Analysis)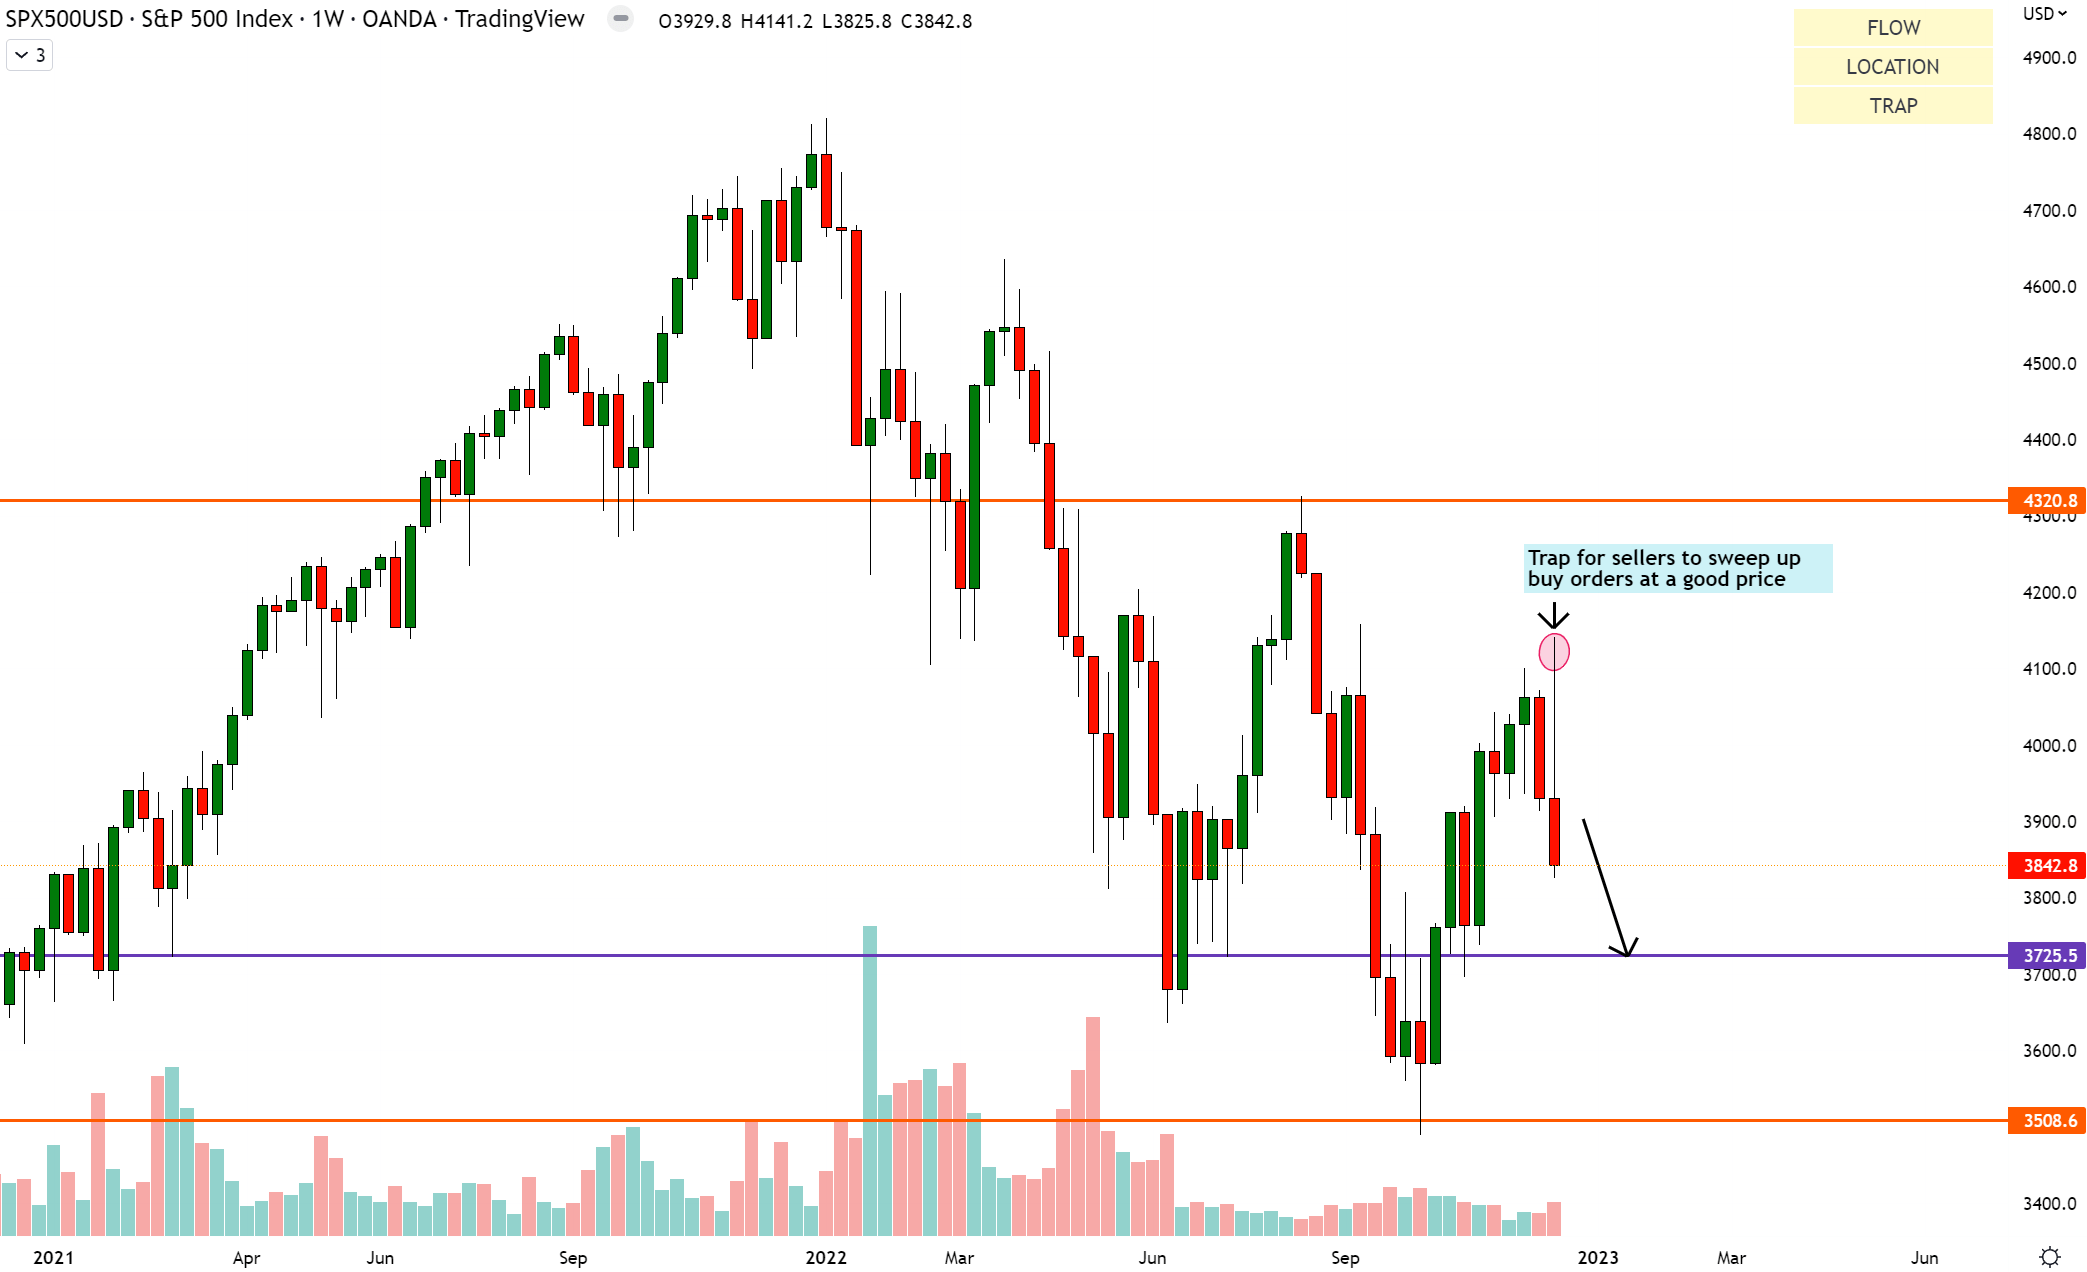
It is likely that even if the US stock market indices curb their falls over the next couple of weeks, they would under perform other markets that are currently showing signs of relative strength. Thus, it makes sense to try get some exposure to these more attractive global markets, especially via ETFs.
According to my analysis, the top country-specific ETF showing relative strength vs the S&P 500 is:
UAE
The iShares MSCI UAE ETF tracks the stock market index of the United Arab Emirates.
Read of Relative Money Flow
UAE vs S&P500 Technical Analysis (TradingView, Author’s Analysis)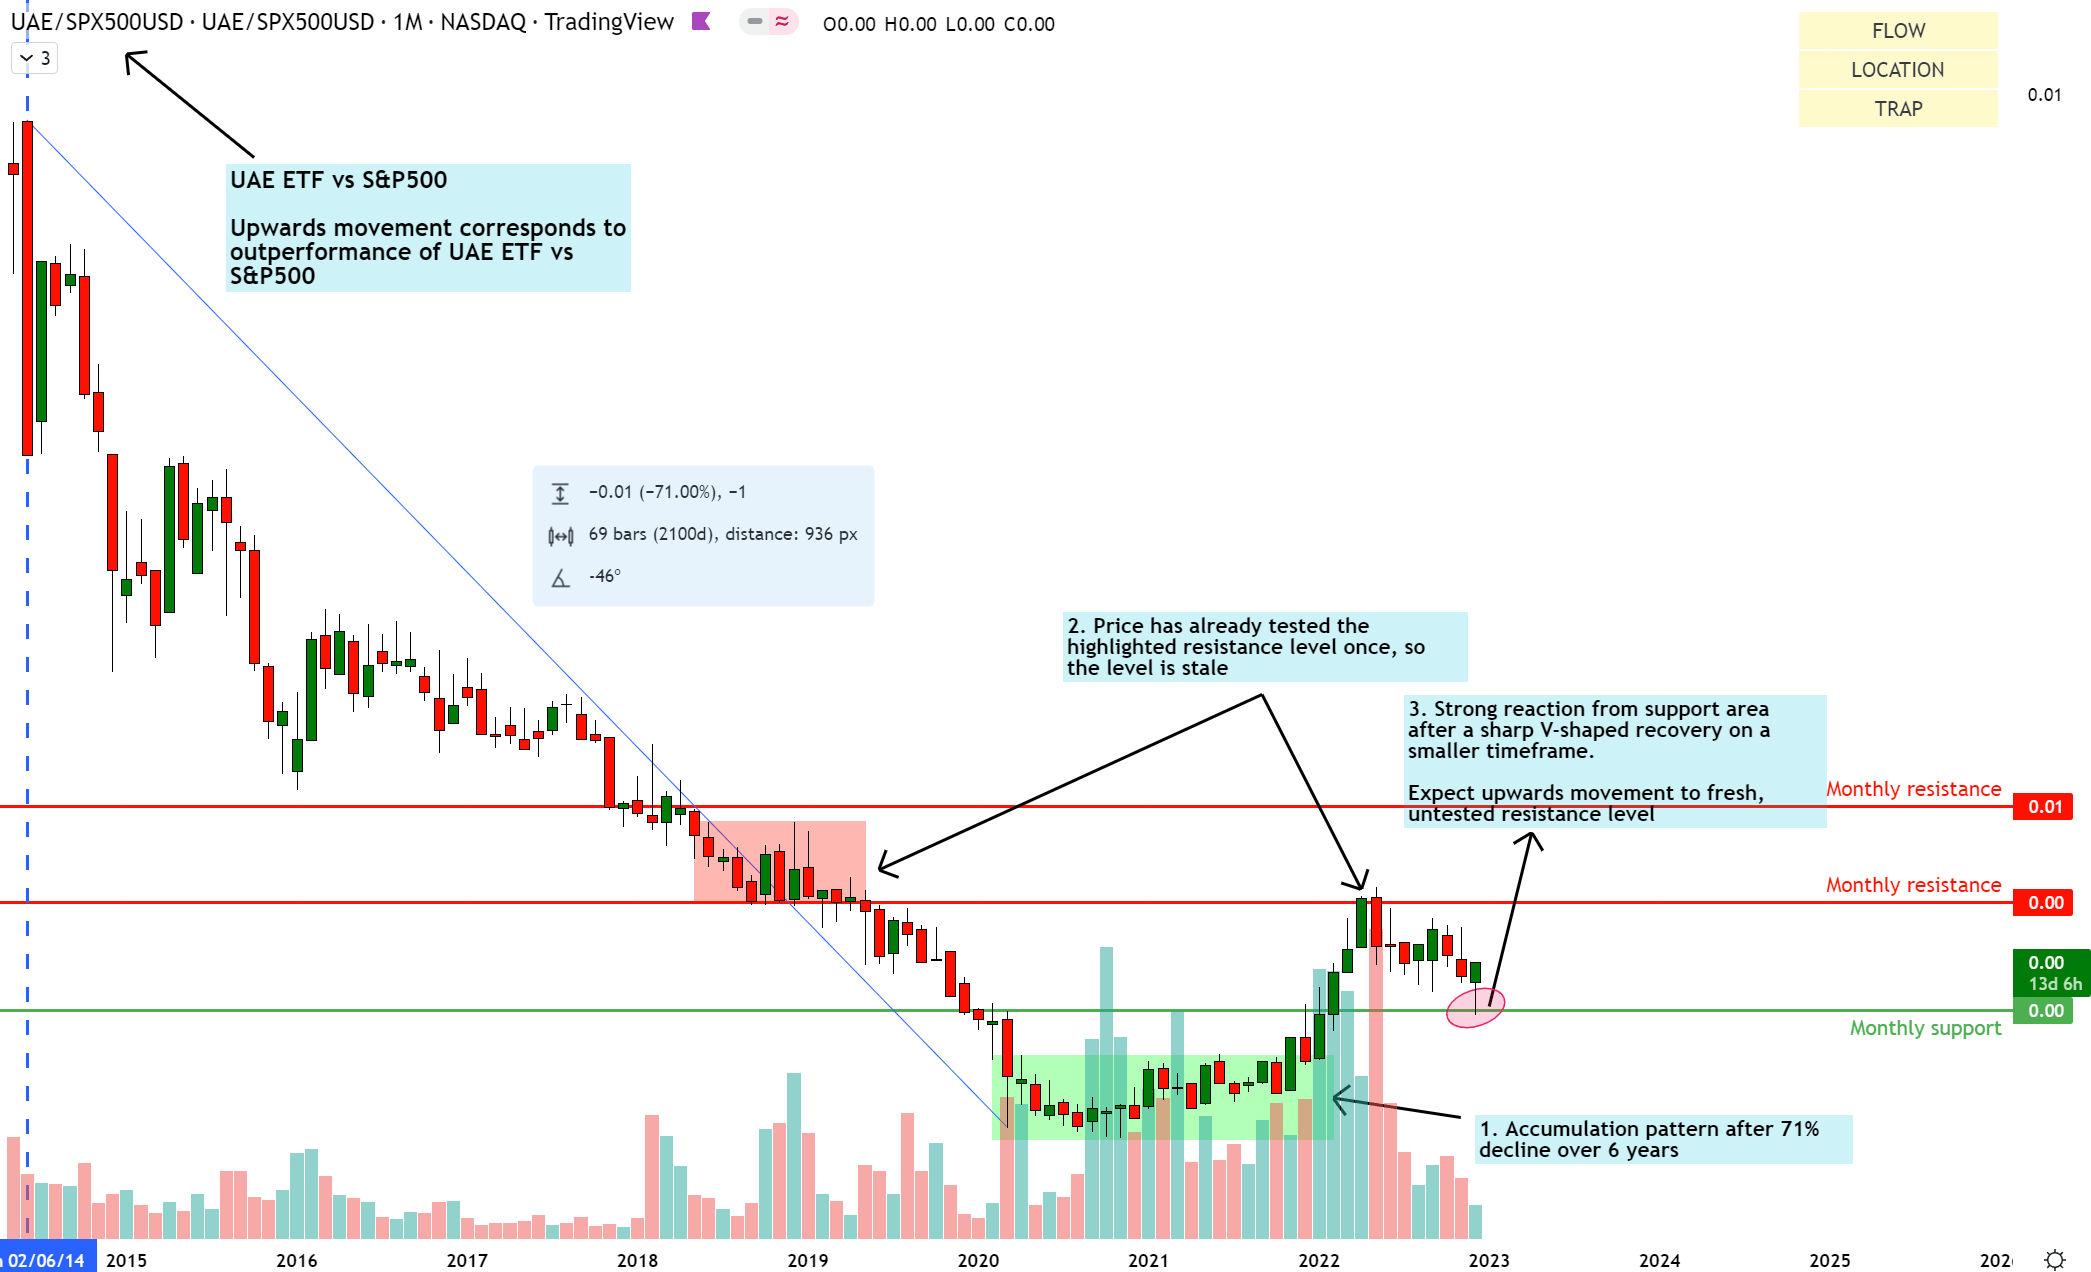
An upward movement on the relative chart of UAE/SPX500 means UAE is outperforming the S&P 500. Conversely, a downward movement means the UAE is underperforming the S&P 500.
UAE/SPX500 shows a 2-year accumulation pattern since early 2020 till early 2022, which has halted a 71% decline since 2014. This accumulation has led to a strong bullish move up and reacted off a key resistance level. The chart currently shows a pullback of the bullish moves amid the incumbent upwards flow.
More recently, price has sharply printed a small V-formation recovery that would have trapped some sellers on the wrong side at a key support location. I anticipate this to mark the resumption of the uptrend as price moves up towards the next area of fresh, untested resistance.
Read of Absolute Money Flow
UAE Technical Analysis (TradingView, Author’s Analysis)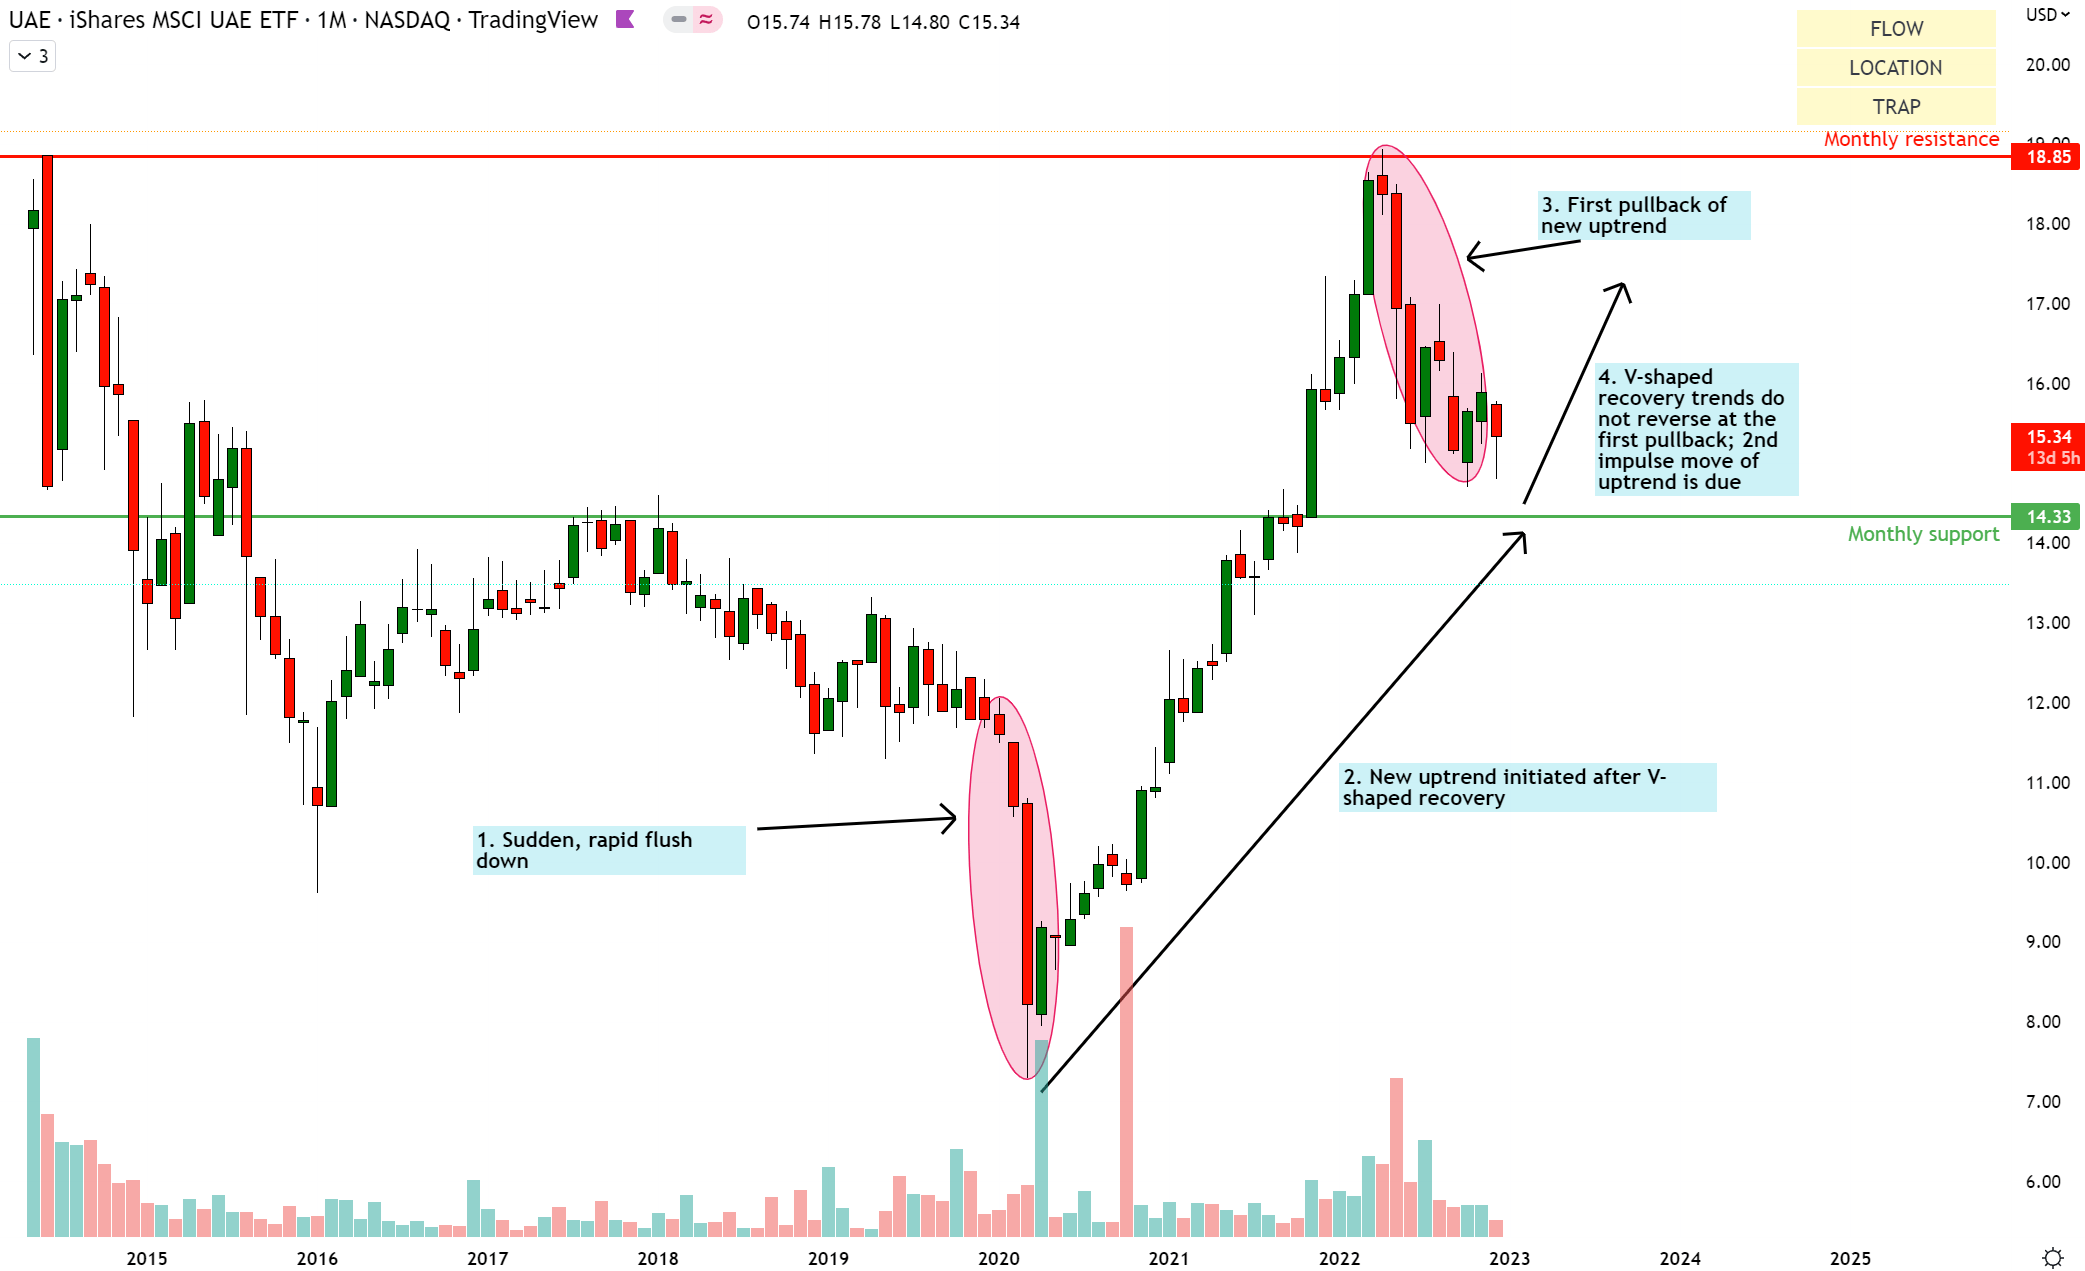
The absolute chart of UAE depicts a strong uptrend flow that has emerged as a sharp V-shaped recovery followed a trap for the breakout seller traders in the form of a sudden, rapid flush down. Price is currently pulling back from the first major resistance area and is near the monthly support location at $14.33. I anticipate prices to quickly visit the monthly support before resuming the upflow back towards the monthly resistance location at $18.85.
My trading experience suggests that this first pullback is highly unlikely to signal a genuine reversal of the bullish trend. This is because V-shaped recoveries rarely reverse at the first bearish pullback.
UAE ETF Composition
You may believe a Middle East ETF would mean high exposure to oil production. I certainly thought so. Well the reality is that the direct energy exposure in the UAE ETF is only 1.8%:
UAE ETF Sector Exposure (UAE ETF Website, Author’s Analysis)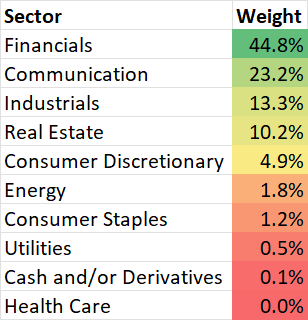
Financials and Communication make up more than two-thirds of the entire index. This is mostly due to the 2 biggest holdings, Emirates Telecom and First Abu Dhabi Bank, which together make up 42.5% of the overall UAE ETF’s position weights:
UAE ETF Top 5 Holdings (UAE ETF Website, Author’s Analysis)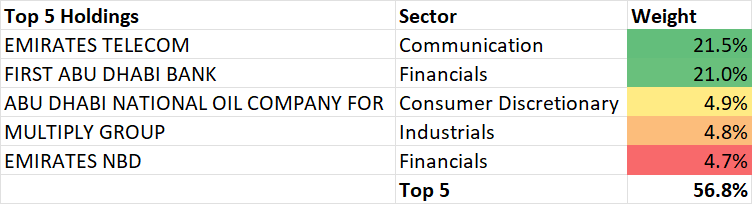
Clearly, this is a very concentrated ETF with the top 5 holdings consisting of 56.8% of overall exposure.
Key Fundamental Drivers for the UAE ETF
My eyes would be on Emirates Telecom and First Abu Dhabi Bank. I will be adding Emirates Telecom and First Abu Dhabi Bank to my news watchlist to be alerted of major developments that may dramatically influence the performance of the UAE ETF.
Emirates Telecom is the leading telecom operator in the UAE. The key story in play here is the adoption of 5G, growth in international markets in which it has a presence such as Morocco, Egypt, Pakistan and North America, and expansion into other technology related services.
First Abu Dhabi Bank has a third of the local banking industry’s share and is considered to be the most well-run operations. The key story here is focused on expansion of credit growth in the industry post the pandemic.
Summary
Overall, I believe the UAE ETF is poised to outperform the US S&P 500. On an absolute basis, I think there may be another 6.6% fall from the current UAE ETF price of $15.34 to $14.33 before an up-move of 31.5% towards $18.85 resumes. I plan to scale in on the UAE ETF over the next couple of weeks. I am in no hurry as I believe being in USD and hence betting on USD strength (DXY) is quite an attractive position to be in currently.
Be the first to comment