

Nuthawut Somsuk/iStock via Getty Images
Midstream Sector Performance
This was a cataclysmic week for the stock market. As the old Wall Street saying goes, “The bull walks up the stairs and the bear jumps out the window.” The selloff was brutal, with nowhere to hide.
HFI Research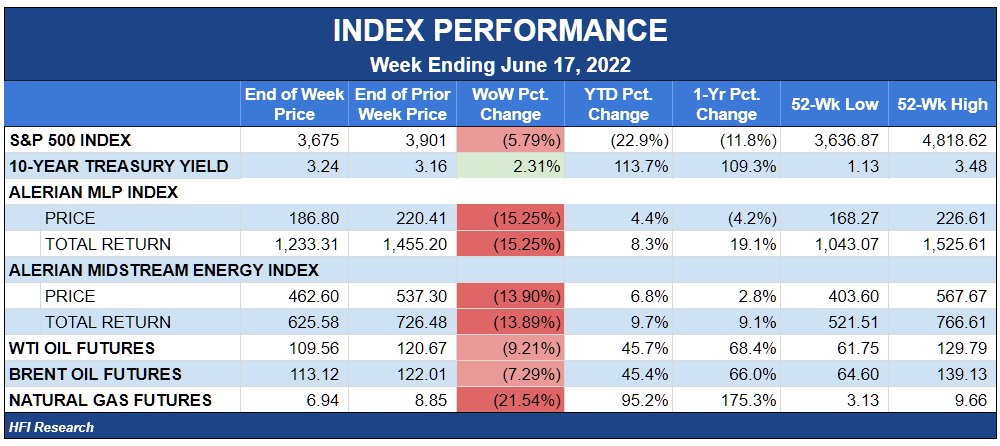
Here’s a look at how each sector performed during the week, with energy the clear loser.
Barchart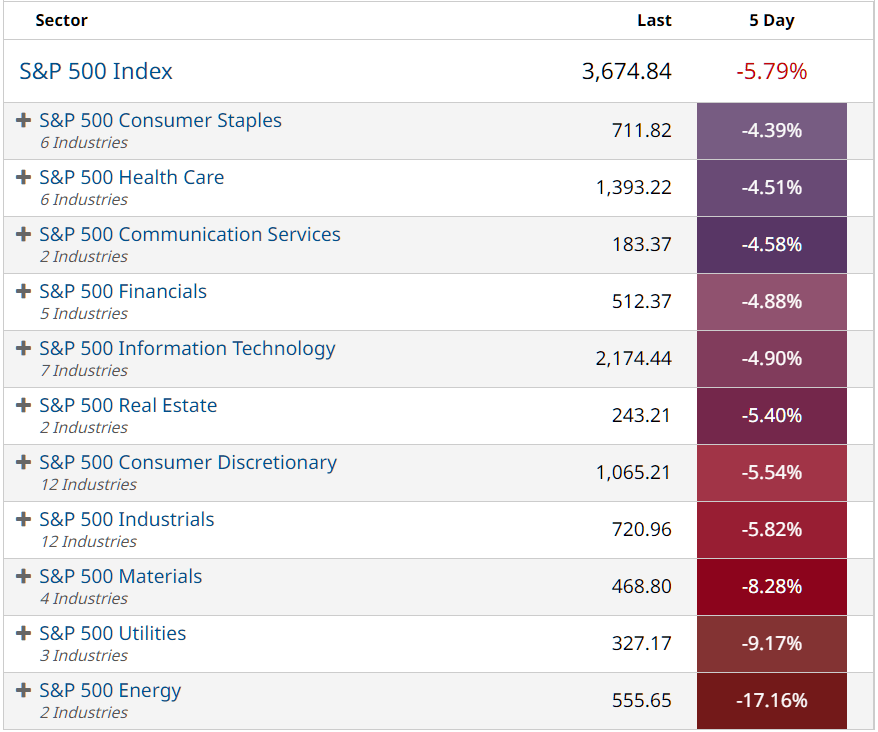
While the S&P 500 fell 5.8%, the Alerian MLP Index (AMLP) fell a whopping 15.3%, one of the midstream sector’s worst weeks on record. The XLE and XOP declined by 20.4% and 17.2%, respectively.
And here’s a look at our coverage universe performance during the week. Everything was in the red:
HFI Research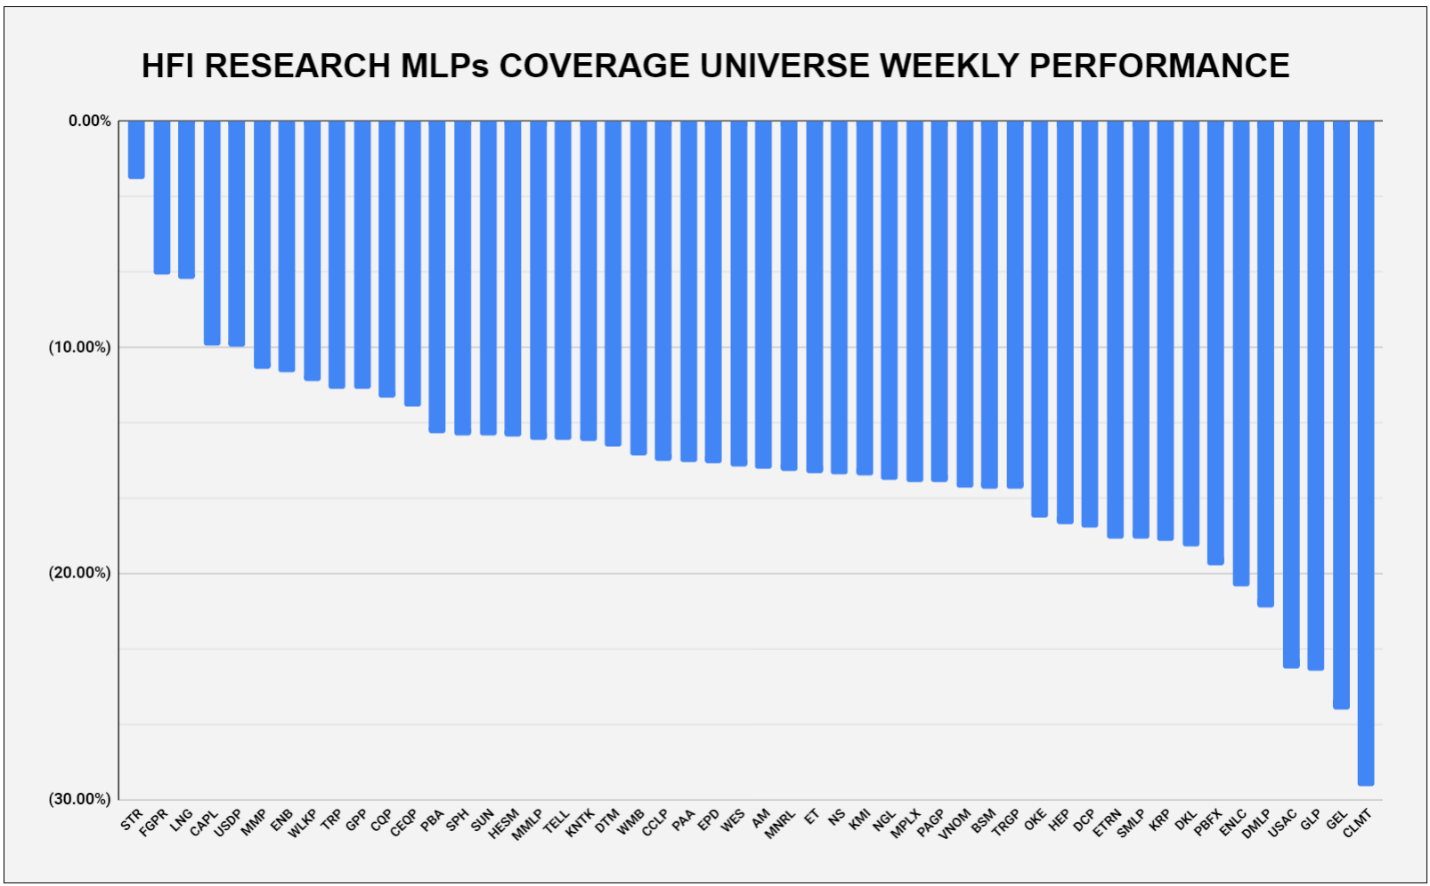
The selloff whittled down the midstream sector’s year-to-date performance from 27.8% to 8.3% on a total return basis. Just a week ago, only a few midstream equities had been down year-to-date. Now, the tally between advancers and decliners is more balanced, as shown below.
HFI Research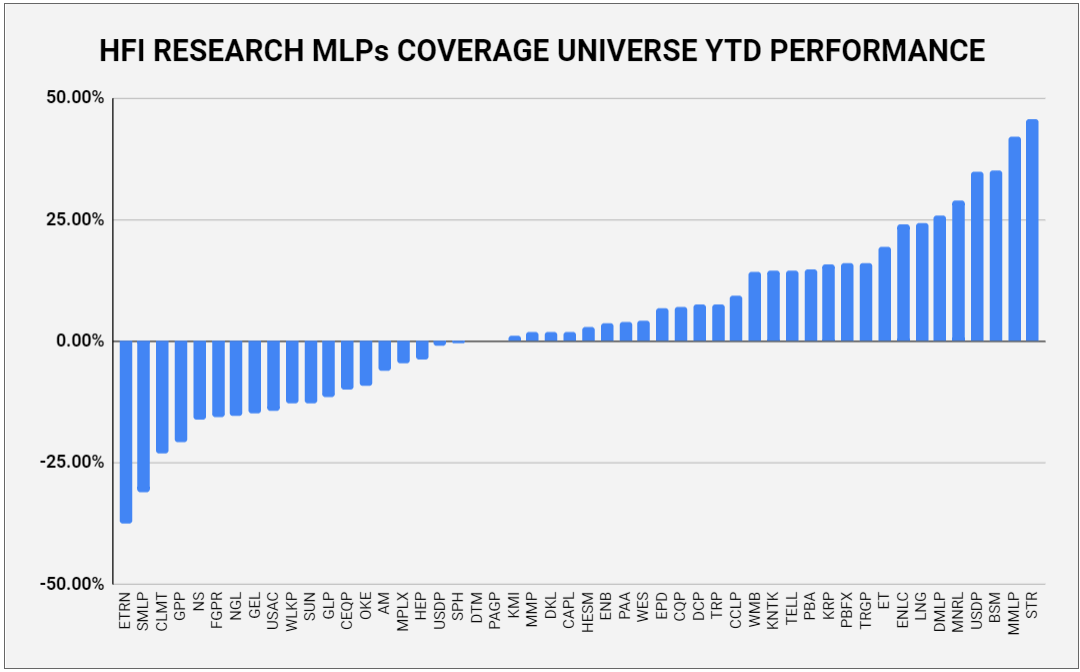
This price action signals that macro forces are about to turn for the worse in energy, which typically means that the market expects oil prices to go down. Other possibilities, such as an imminent ban on U.S. energy exports, are so unlikely to occur that we can dismiss them as a potential cause. Let’s explore what the week’s oil price action—and the knock-on selloff that hit energy equities—signifies from a fundamental perspective.
Factors that Drive Oil Prices
Oil price behavior can be viewed as the sum of two factors: current oil and gas market fundamentals and a premium or discount that reflects market expectations.
The premium for future expectations can be subdivided into two components, the risk of supply scarcity and the risk of supply disruptions. These risks make it worthwhile for market participants to pay up to secure supplies today.
But what if we strip out the premium and view the market based on fundamentals alone? We can estimate an “appropriate” price based on fundamentals by determining global inventory levels. We use inventory data because inventories represent the intersection between supply and demand: when inventories trend higher, supply must be greater than demand, and vice-versa. Inventory levels are therefore inversely correlated with oil prices over time. Regression analyses show the relationship to be quite tight over the long term. Inventory data also have the benefit of being more reliable than supply and demand data.
The following chart shows the latest read on global oil inventories, courtesy of Open Square Capital and satellite inventory-tracking firm, Kpler.
Open Square Capital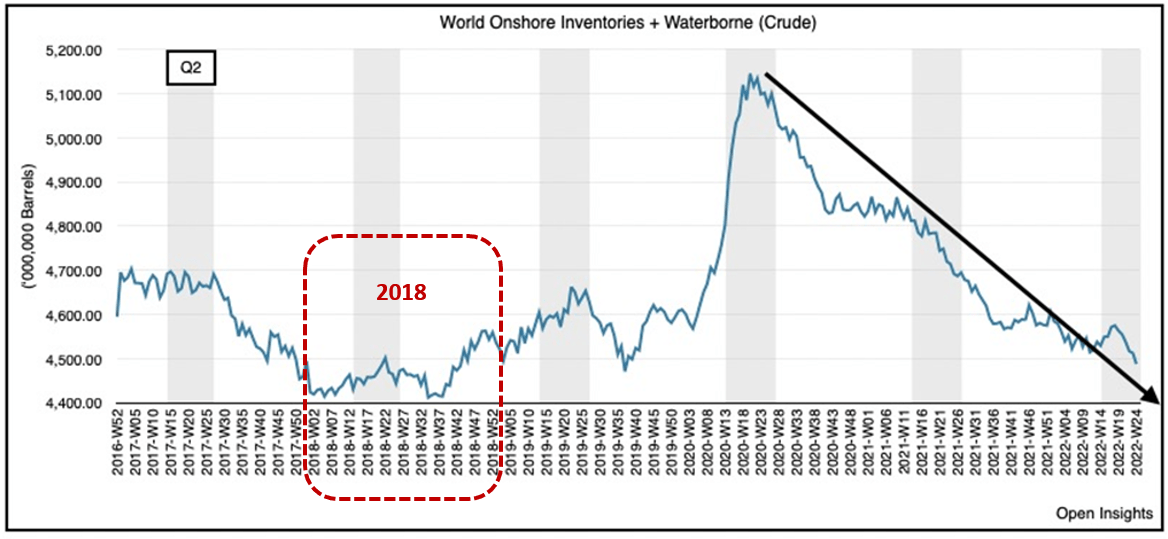
Source: Open Square Capital and Kpler. Red text added by author.
As you can see, inventories have trended downward more or less consistently since peaking in mid-2020. Of course, oil prices have followed an inverse trajectory. That blip higher in April and May 2022 increase was attributable to Chinese lockdowns, which subtracted around 1% of demand from the market, U.S. strategic petroleum reserve releases, which added 0.5% of supply to the market, and typical seasonal demand weakness during that time of the year. Inventories resumed their downtrend in June, as Chinese lockdowns eased and as demand seasonally increased.
While the future course of inventories is unknown, our supply and demand outlook leads us to believe that the trend lower will continue in the second half of 2022, barring a global recession that significantly reduces demand.
The second point to notice about the chart above is that current inventory levels are not unusually low. In fact, they were lower than the current level throughout early 2018, which is shown in the red-dotted line. At the time, prices reflected fundamentals with no material premium or discount because there was little concern about future supply or demand. Considering that today’s oil demand is not significantly higher than it was in 2018, we can use oil prices in the first half of 2018 as a shorthand way to estimate prices in the first half of 2022 in the absence of any risk premium.
First-half 2018 oil prices traded in a range between $60 and $75 per barrel, as shown in the chart below.
HFI Research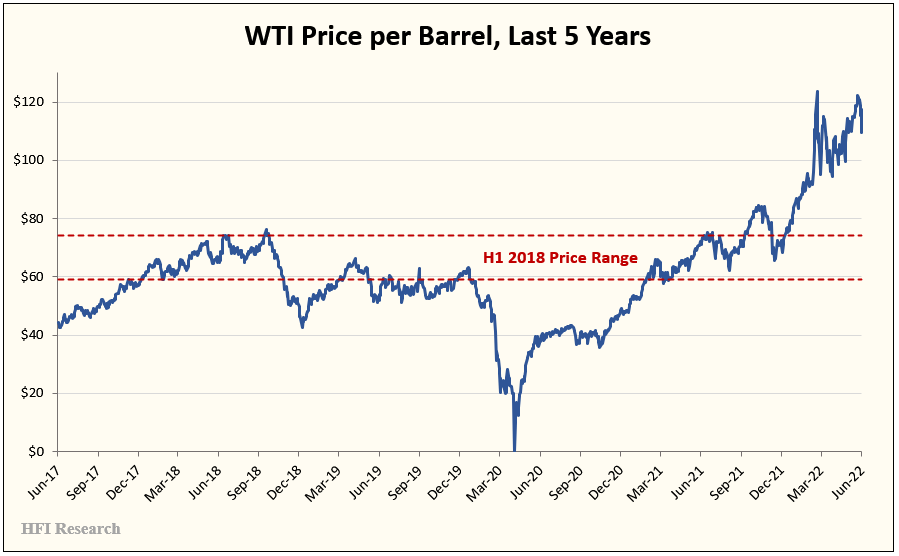
Today’s Oil Price Premium
But the reality today is that the oil market faces significant scarcity and disruption risks. We pay most attention to the scarcity factor and incorporate it into our fundamental oil-market outlook. Disruption risk, while important, is less tied to fundamentals and therefore more difficult to anticipate. It waxes and wanes over the long term, primarily in response to geopolitical developments.
Today’s scarcity risk is real, with the market beset with multiple supply challenges. For one, spare production capacity is razor-thin by historical standards, at 1.5-to-2.0 million barrels per day (bpd) in the 100 million bpd oil market. Furthermore, there are no major projects underway set to deliver large quantities of new oil to the market. These projects take at least five years to reach commercial production. Exploration budgets have been slashed over the past few years when oil prices were low. More recently, international oil companies have been reluctant to pursue projects that span multiple decades as the Western intelligentsia has declared that oil will be phased out over the coming years and that major oil projects will end up as low-value “stranded assets.”
Another supply challenge comes from U.S. production. U.S. shale has provided the lion’s share of marginal oil production since 2010. Today, shale production is experiencing both material and labor shortages. The funding model that underpinned its breakneck growth from 2010 through 2018 is all but dead, while a significant proportion of high-quality/low-cost acreage has been drilled. The rate of U.S. production growth is likely to be far below what it was in the industry’s heyday. In fact, it remains to be seen if the U.S. can continue to produce enough new oil to keep prices at reasonable levels over the long term. We’re not optimistic.
These are the realities on the ground without taking heed of inexorable production declines that are occurring to all current oil production. If production declines were to accelerate due to the industry’s inability to offset them, they would introduce another bullish tailwind for oil prices.
While the global supply system is clearly challenged, global demand is set to increase as long as prices are at—or even slightly above—historically-normal levels. Near-term demand will be supported by a continued recovery to pre-Covid levels. A recovery in air travel alone stands to add 1% to global demand. Longer-term demand trends are also bullish. Irrespective of the potential for oil demand to decline among the 750 million inhabitants of North America and Europe, billions of people in China, India, Africa, and Southeast Asia are striving to improve their lot and attain an energy-intensive lifestyle enjoyed in the West.
Taken together, these fundamental supply and demand trends threaten to bring about supply scarcity that has added a premium to oil prices. This premium is the market’s way of incentivizing additional supply before oil supply shortages become widespread. As long as the risk of future scarcity remains in effect, we estimate that a price premium of $15-to-$20 per barrel is warranted in the oil price. We think such a premium should be sufficient to induce supply additions, though it will take a number of years. Adding this scarcity premium to the prices implied by inventories alone implies a price range of $75 to $100 per barrel.
And then there is disruption risk. We believe the difference between our designated price range of $75 to $100 per barrel and today’s oil prices is largely a function of the disruption risk stemming from Russia’s invasion of Ukraine. We’d note that prices had reached the high end of our price range on the eve of Russia’s invasion. Supply disruptions have yet to occur, and nobody knows for certain if any disruption that materializes will be temporary or long-lived. But we estimate that this disruption premium has added a premium of as much as $25 per barrel to the oil price over the past few months. Any event that leads to a long-term reduction or cessation of hostilities between Russia and Ukraine is likely to reduce or eliminate this premium.
A Noisy Signal
The reason for this week’s selloff in oil and energy equities is anything but clear. We can’t be sure whether the week’s price action is related to concerns about a deep recession that threatens inventory builds or to the increasing probability of a negotiated settlement between Russia and Ukraine. Perhaps it is attributable to oil-market dynamics that are removed from supply and demand fundamentals. What we’re confident in is that it had nothing to do with the looming oil supply scarcity.
The possibility of a negotiated settlement between Russia and Ukraine is somewhat contradicted by the strength in time spreads, which have remained elevated since the Russian invasion. As the following chart shows, time spreads weakened but didn’t plunge like they did in previous oil-market panics.
Barchart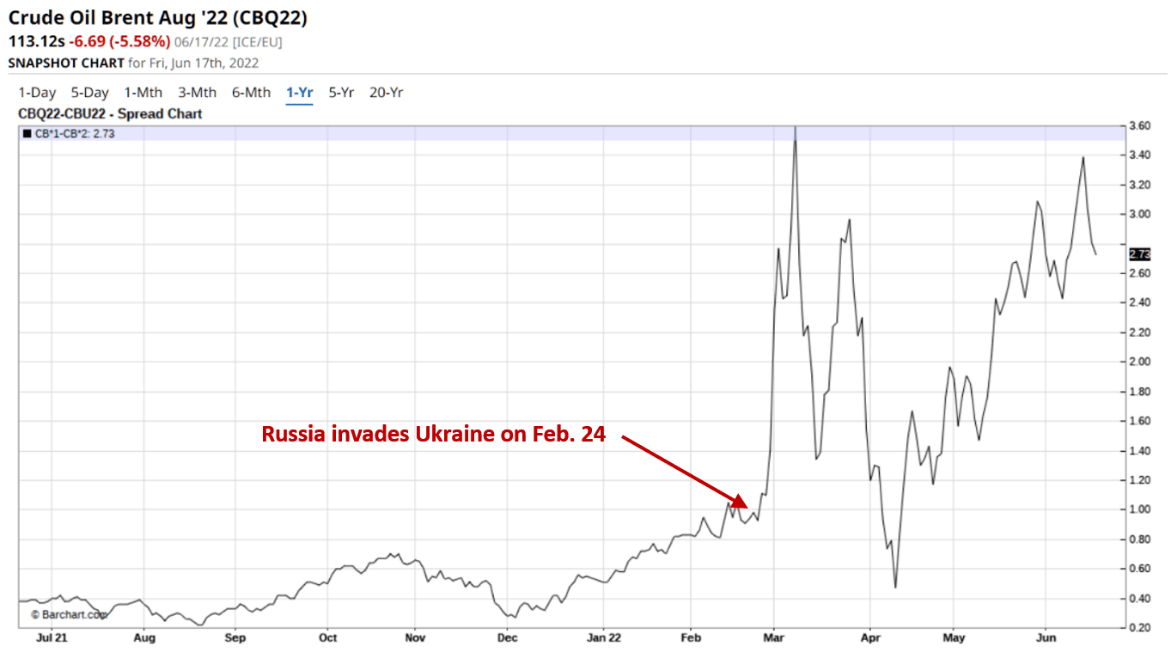
Red text added by author.
At least for now, time spreads point to still-healthy demand for near-term delivery at current levels.
While we’re more concerned about a recession than a settlement, we would note that only a deep, protracted global recession would be capable of eliminating the supply deficit we expect in the second half of 2022.
If a recession were deep enough, it could eliminate the perception of near-term supply risk among oil-market participants, sending oil prices to our $60 to $75 per barrel range. It could also reduce demand enough to spur an increase in inventories that send oil prices below that range, though we believe Saudi Arabia and Russia would coordinate to prevent such an outcome.
Even in a recessionary scenario, however, oil’s long-term fundamental outlook remains strong. A recession that lowered oil prices significantly would ultimately reduce global oil production capacity. The ensuing demand recovery would not be met with enough supply to meet increasing demand, and prices would shoot higher as a result. In such a scenario, we believe our holdings’ balance sheets would be capable of withstanding a recession and that their equities would rebound strongly in the recovery.
Instead of an extreme scenario playing out in the second half of the year, we expect a more gradual softening in demand due to a weakening economy and high oil prices. The demand softening is more likely to reduce refined product margins, which are currently at record highs, roughly 5-times historically normal levels. In the event that hostilities between Russia and Ukraine cool, we expect oil prices to continue to trade above $90 per barrel. As the outlook turns to 2023, air travel recovers to pre-Covid-19 levels, and the market grows concerned about the lack of supply growth, we expect the scarcity premium to increase, keeping prices elevated above $100 per barrel.
Implications for Our Portfolio
The key point to keep in mind is that our portfolio will only be negatively impacted if oil prices are sustained below $70 per barrel for several months. Only then would U.S. production be at risk of declining. Note that such a decline would reduce global supply and put in place the foundation for an oil-price recovery. Oil at over $70 per barrel should be enough to keep U.S. production humming along at levels that are supportive of midstream volumes, which would be constructive for our holdings’ cash flow and EBITDA.
Hopefully, this puts the week’s selloff into perspective. From a fundamental perspective, it is meaningless for our holdings. We believe it is a typical bout of panic that is best ignored. Or an investor can go one step further and use it as an opportunity to buy more high-quality midstream equities for the long term.
Only a deep recession would reduce our intrinsic value estimates. Even then, however, we tried to mitigate this risk by purchasing our holdings with a significant margin of safety. As long as our theses remain intact, we believe the principal value of our investments will be safe.
Weekly HFI Research MLPs Portfolio Recap
Our portfolio didn’t just take it on the chin this week; it got smashed in the face, declining 13.6%. Still, it managed to outperform its benchmark, the Alerian MLP Index, by 1.7%. Our goal is to outperform the benchmark, so by that standard the week’s performance was a success, if only a Pyrrhic one.
HFI Research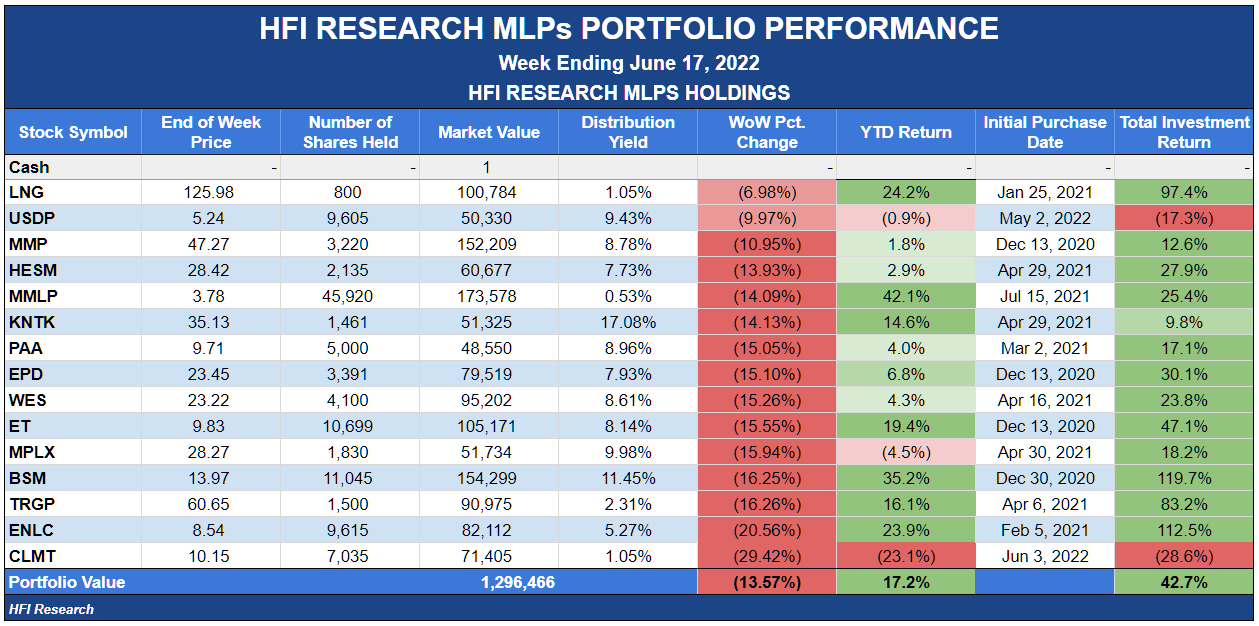
We sketched our thoughts about what to buy amid the selloff in our article here. There has been no change in our recommendations since we published it.
The biggest development among our holdings during the week was Targa Resources’ (TRGP) announced acquisition of private gathering and processing (G&P) company Lucid Resources, which operates in the Delaware Basin. We’ve been staunch supporters of TRGP management as they developed the company’s integrated midstream system over the past several years, but we have to admit that this deal is a head-scratcher. Management had pledged to pursue expansion only if it grew TRGP’s downstream operations. This deal is purely G&P-related and involves no downstream assets.
The deal also adds to leverage. We estimated that TRGP would end 2022 with a leverage ratio of slightly under 3.0-times. In its press release, management now expects to end 2022 with a leverage ratio of 3.5-times. While this is not excessive, we wonder if there aren’t better uses of capital.
Management increased full-year 2022 Adjusted EBITDA guidance by 13.5%, from $2.4 billion to $2.725 billion. However, the higher interest costs resulting from the deal are likely to result in a smaller impact to free cash flow. We wonder whether stock buybacks would have been more accretive for cash flow per share than this deal. At any rate, we have to look into it further before rending a decision on whether it is a net positive for shareholders.
News of the Week
June 14. DCP Midstream (DCP) announced a bolt-on acquisition of Permian Basin gathering and processing assets for $160 million. The acquired assets are connected to DCP’s infrastructure and create incremental volumes for the company’s downstream assets. Financial details weren’t disclosed. DCP’s management has not distinguished itself on the capital allocation front, so we recommend avoiding DCP units.
June 15. Enterprise Products Partners (EPD) filed papers with the Texas Comptroller’s Office that indicated it was planning to build a $5 billion steam cracker at its marine site in Beaumont. The cracker would be capable of processing up to 2 million metric tons per year of ethane and propane. The project would be consistent with management’s previously communicated plans to build a steam cracker for certain customers that didn’t want to build one themselves. We believe EPD is positioning itself to be a midstream leader in the global petrochemicals, which is experiencing undergoing long-term secular growth. We recommend EPD units as a buy for their safe 7.8% yield and distribution growth.
Capital Markets Activity
June 15. Cheniere Energy (LNG) announced the repurchase of $350 million shares from Icahn Enterprises at an average price of $130.52 per share. We value Cheniere at $180 per share, so we like the repurchase, even though its luck could have been better with regard to timing. Still, the deal represents management continuing to grow value for shareholders. We recommend Cheniere shares as a buy.
HFI Research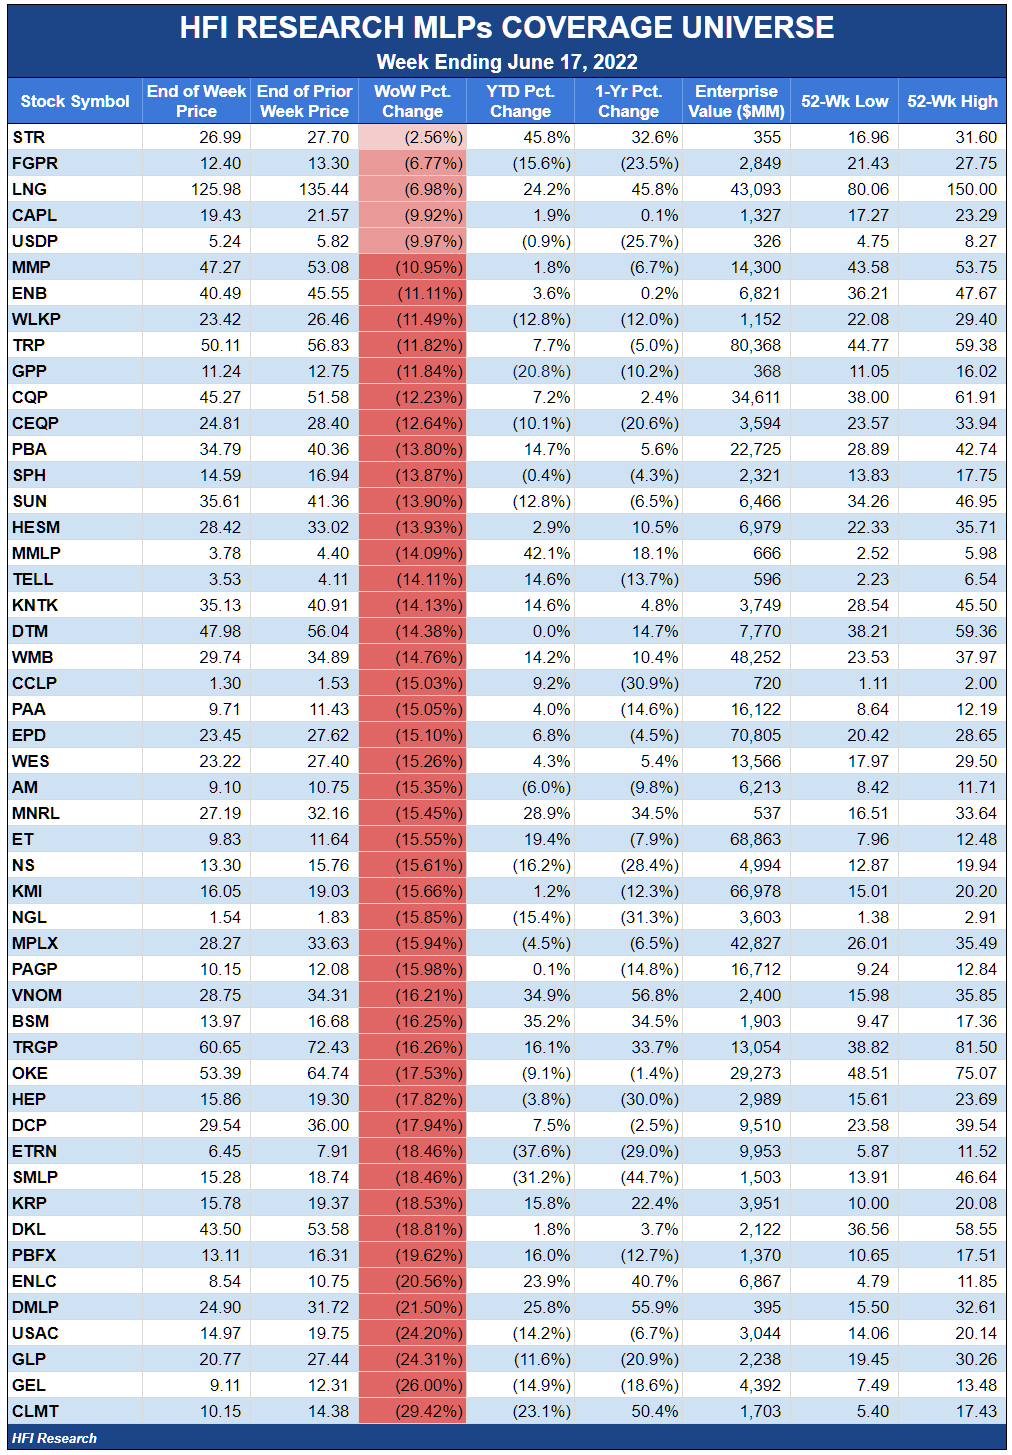
Be the first to comment