

Doucefleur/iStock via Getty Images
Investment Thesis
The First Trust Value Line Dividend ETF (NYSEARCA:FVD) is a bit of a unicorn right now, given how out of 90 dividend- or volatility-focused U.S. equity ETFs trading today, it’s one of ten with a five-year beta under 0.70. Its constituents also yield 3.13%, trade at 17.77x forward earnings, and have double-digit estimated earnings growth. It sounds like a great sales pitch, but FVD has one critical problem: an outrageous 0.67% expense ratio. While fees aren’t everything, and it didn’t stop me from rating FVD a buy last June, I believe the costs now outweigh the benefits, and investors are better off with cheaper alternatives. This article will include a solution that could save you over 10% in fees over ten years and a detailed discussion on FVD’s current fundamentals.
FVD Overview
Strategy and Sector Exposures
FVD tracks the Value Line Dividend Index, selecting from a universe of around 1,700 U.S.-listed securities with a safety ranking of 1-2 on a five-point scale, as determined by a proprietary system. Companies with above-average indicated dividend yields relative to the average S&P 500 companies are included, while those with market capitalizations less than $1 billion are excluded. The portfolio rebalances monthly, and securities are assigned an equal weight.
Since the screen is for U.S.-listed and not U.S.-headquartered companies, you’ll find a few foreign stocks included, like Enbridge (ENB) and Royal Bank of Canada (RY). Still, North American equities make up over 90% of the ETF, so I don’t think there’s too much foreign risk.
FVD is nearly 20% Utilities, followed by Industrials (15.50%), Consumer Staples (14.46%), and Financials (13.95%).
First Trust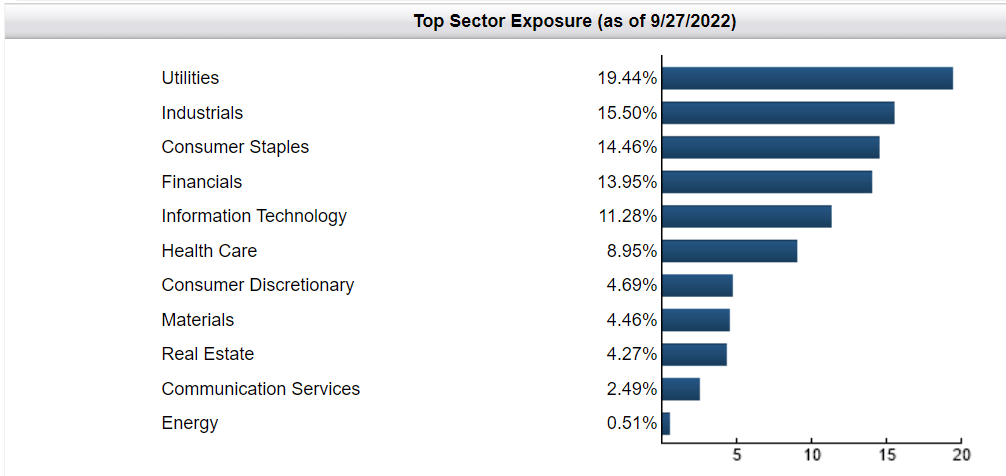
FVD’s top ten holdings are below, totaling 14.07%. Since it’s an equal-weighted fund with 196 holdings, this list likely won’t be very useful. It merely represents the best performers this month, including defensive stocks like General Mills (GIS) and Johnson & Johnson (JNJ). At the bottom of the list with a 0.37% weighting is FedEx (FDX), after its disastrous earnings miss.
First Trust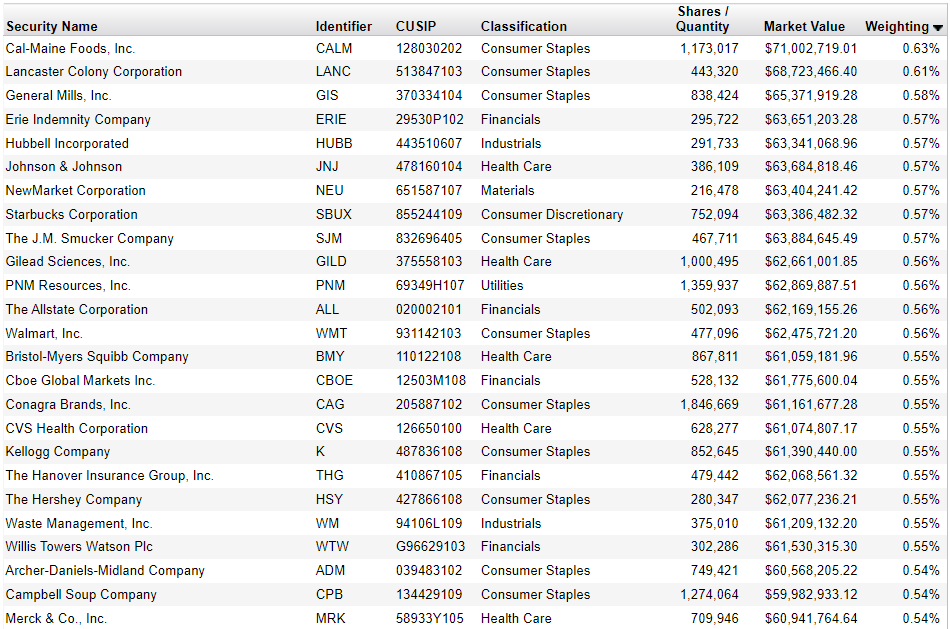
Performance
Over the last ten years, there are at least eight dividend-focused ETFs that have outperformed FVD, including the following:
- Schwab U.S. Dividend Equity ETF (SCHD)
- Invesco High Yield Equity Dividend Achievers ETF (PEY)
- SPDR S&P Dividend ETF (SDY)
- Vanguard Dividend Appreciation ETF (VIG)
- iShares MSCI Minimum Volatility ETF (USMV)
- iShares Select Dividend ETF (DVY)
- WisdomTree LargeCap Dividend ETF (DLN)
- WisdomTree Total Dividend ETF (DTD)
It’s hard to say which is the best comparator, but PEY is the only one with a 15+ year track record through the Great Financial Crisis, a similarly high 0.53% expense ratio, and a five-year beta less than 0.80. Let’s look at total returns on a three-year rolling basis to eliminate any timing bias.
Portfolio Visualizer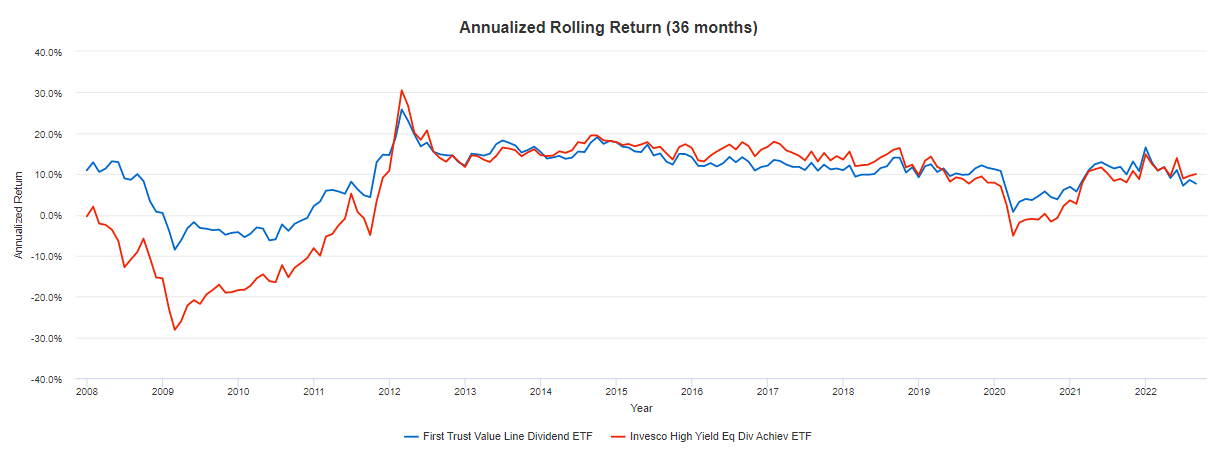
FVD outperformed before the Great Financial Crisis, but in 2013, PEY’s Index began limiting sector and stock weights to 25% and 4%, improving the portfolio’s stability over the last decade. The two ETFs have traded places since, but it looks like FVD was the more stable one. Here’s a look at total returns since January 2013.
Portfolio Visualizer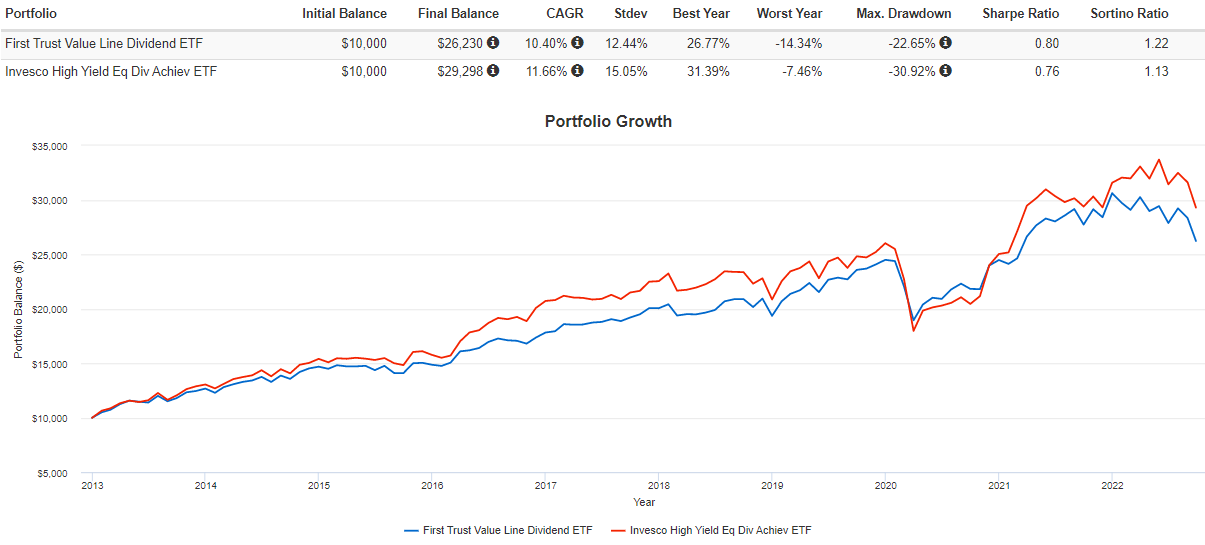
The results are pretty close, but FVD’s lower standard deviation led to better risk-adjusted returns, as measured by the Sharpe and Sortino ratios. Importantly, FVD lost just 22.65% in Q1 2020, more than 8% better than PEY. The primary reason was its 20% allocation to the Utilities sector. For example, the Vanguard Utilities ETF (VPU) declined by 14.13% that quarter, and I think you’ll find that kind of downside protection during most bear markets.
With that in mind, I’d like to offer an alternative to owning FVD to avoid its high expense ratio. SCHD, reviewed here, has virtually no exposure to Utilities stocks. I’d like you to consider a portfolio of 80% SCHD and 20% VPU. This simulated portfolio gets us pretty close to FVD’s standard deviation and does much better on returns. It’s only food for thought, but I want readers to think about a few simple combinations they can use to avoid these high-fee funds.
Portfolio Visualizer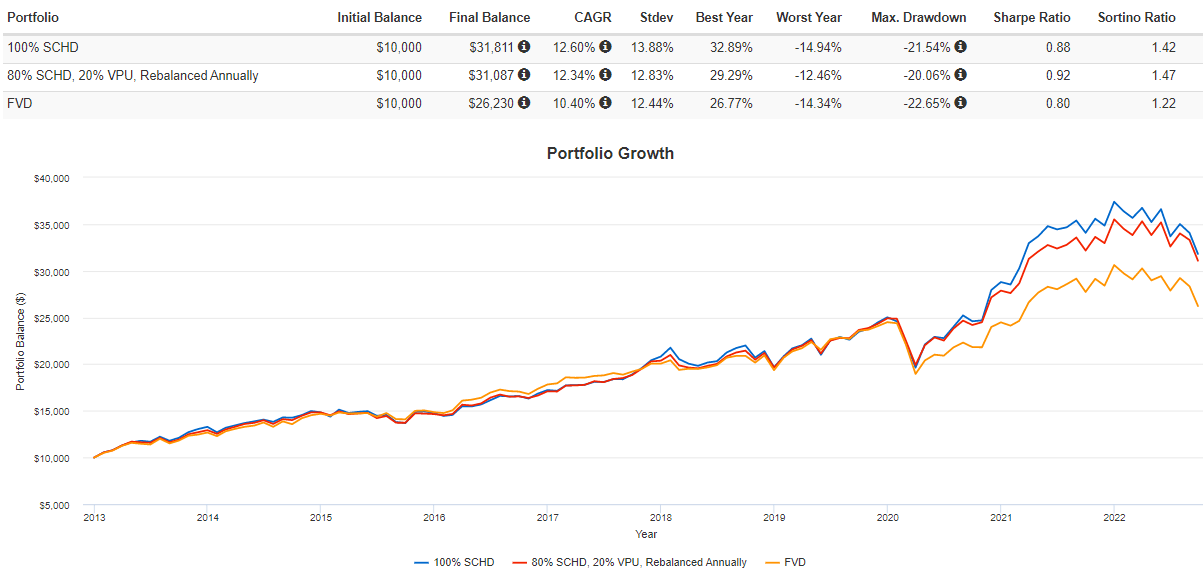
Even First Trust highlights how much of your gains are lost to fees. Since its inception in August 2003, the underlying Index gained $48,760.67, while the fund gained only $41.662.96. In other words, investors lost 14.56% of their gains to fees and other tracking error sources over 19 years. Instead of an annualized 9.72% gain, they netted only 8.99%.
First Trust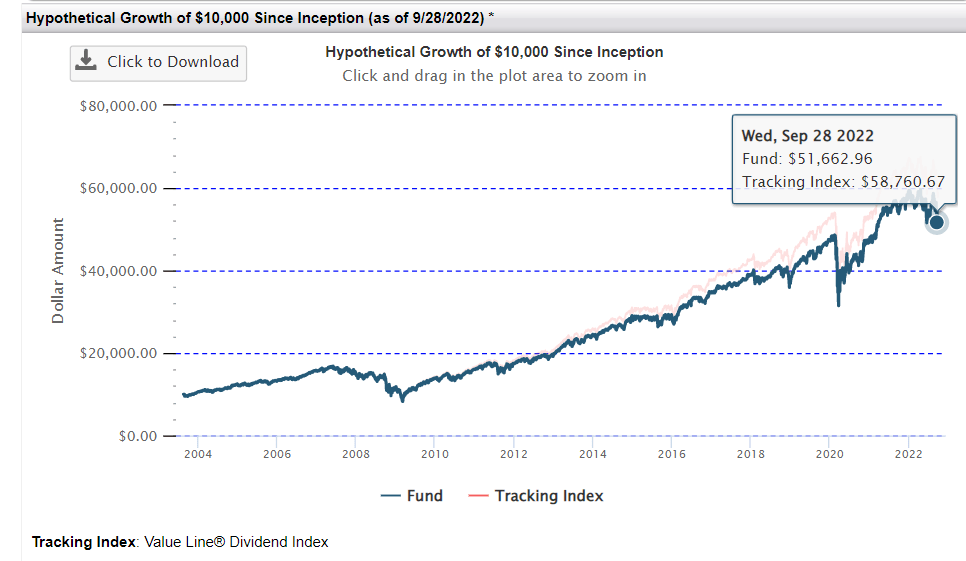
ETF Analysis
Dividends
Seeking Alpha gives FVD an overall B- Dividend Grade, and judging by the individual grades below, it’s propped up simply by having 14 years of consecutive dividend payments. In my view, that streak isn’t worth much and only reflects how long the ETF has operated. The more significant figures are FVD’s 2.14% yield and 5% five- and ten-year dividend growth rates. Having analyzed all the major dividend ETFs here on Seeking Alpha, these figures are definitely on the low side.
Seeking Alpha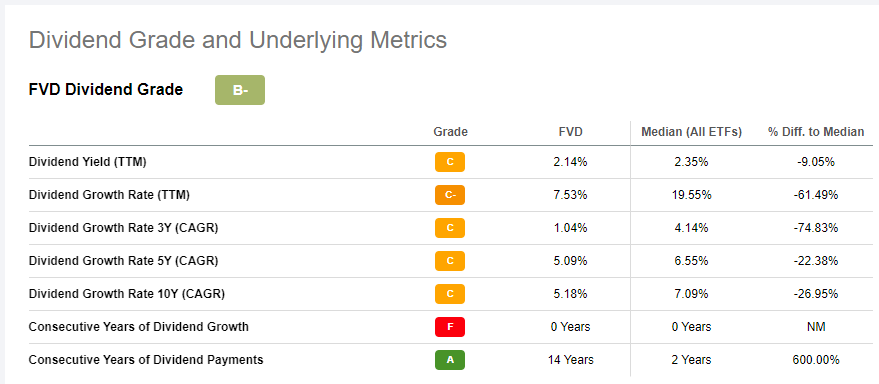
There’s rarely a time when double-digit dividend growth occurs in consecutive years. The lone exception was in 2017-2018, but my point is that it’s inconsistent. A key reason why investors choose dividend ETFs is to jumpstart dividend growth because a rules-based ETF can rotate into high-dividend or high-dividend growth stocks without any tax consequences. Usually, it’s one or the other, but in FVD’s case, it doesn’t appear strong on either yield or growth.
Seeking Alpha
Fundamentals vs. PEY
The following table highlights selected fundamental metrics for FVD’s top 25 industries compared to PEY. While the two share a somewhat similar low beta (0.69 vs. 0.78), that’s about it, as FVD appears to be the higher-quality but costlier choice.
The Sunday Investor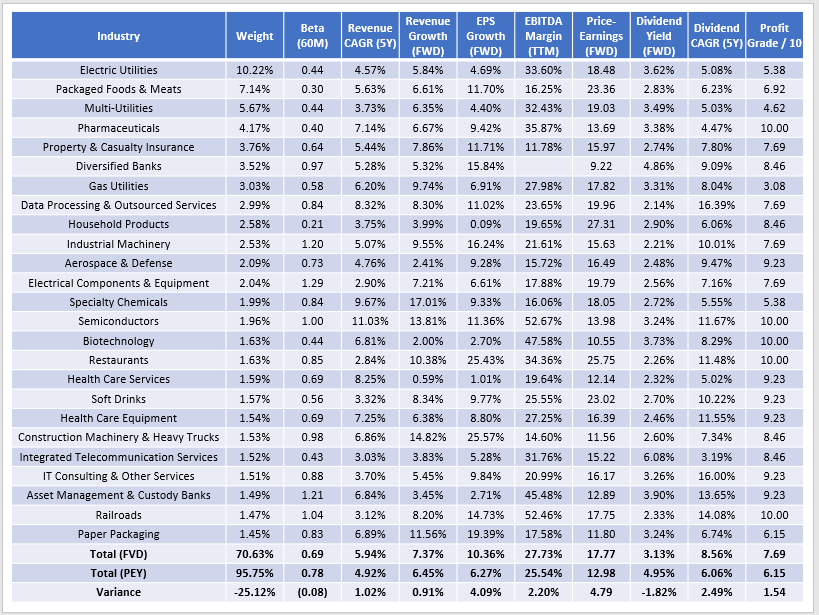
First, FVD is better diversified, with only 70.63% of assets in its top 25 industries compared to 95.75% for PEY. That may be worth a lot to investors who don’t want to manage several ETFs. I don’t think it’s a big deal, but I view PEY as a more tactical, complementary ETF. On the other hand, FVD’s industry concentration level is about as low as you’ll find in the dividend ETF space, so it deserves some points.
Second, while the two funds have similar historical and estimated sales growth figures, FVD pulls away on earnings growth (10.36% vs. 6.27%) and EBITDA Margins (27.73% vs. 25.54%). The latter is reflected in a much better Seeking Alpha Profitability Score (7.69 vs. 6.15) and supports the idea that FVD is a much safer investment. However, FVD trades at 17.77x forward earnings compared to 12.98x for PEY. In my view, that’s a fairly steep premium, especially considering only 13/64 dividend ETFs don’t have double-digit estimated earnings growth. Similarly, only 6/26 low-volatility ETFs don’t have this level of growth. If we take a growth-at-a-reasonable-price approach and divide estimated earnings growth into each fund’s forward P/E, FVD and PEY would rank 70th and 83rd, respectively, out of 90 dividend- and low-volatility ETFs. In short, neither ETF appears to be a great bargain.
Third, FVD’s constituents currently yield 3.13%, but investors should expect something closer to 2.50% after fees are considered and assuming prices remain depressed this quarter. It’s an improvement over the current 2.14% yield but well short of PEY’s gross 4.95% yield (4.42% net of fees). FVD’s constituents have grown dividends by 8.56% per year over the last five years, but that figure doesn’t stand out in the dividend ETF space. Among all dividend ETFs, it ranks in the bottom third quartile.
Investment Recommendation
After examining FVD’s current fundamentals and comparing them with its peers, I found its dividend yield and growth to be on the low side and its 17.77x forward earnings valuation to be relatively high for the earnings growth offered. I think FVD’s standout feature is a low 0.69 five-year beta, but investors can match this by combining a high-quality ETF like SCHD with cheap Utilities sector ETFs like VPU. According to this fee calculator, this combination should save you about 10% over ten years, assuming an 8% annual return. Therefore, I recommend avoiding FVD, and I look forward to discussing this further in the comments section below.
Be the first to comment