

123ducu/iStock via Getty Images
Investment Thesis
It is apparent that the market had massively recovered in the past few weeks, post Q2 earnings announced by many Big Tech companies. Even Microsoft Corporation (NASDAQ:MSFT) had miraculously climbed out of its recent slump to hit new three-month highs of $293.47 at the time of writing, despite the comparatively decent earnings compared to the stellar reports in FQ3’22. Assuming that these levels hold, it is not hard to see MSFT hitting consensus price targets of $327.67 over the next two months.
However, we are less optimistic, given the overly fast and furious rally in the past three weeks. In addition, with the Fed’s poised to hike the interest rates again in September 2022, we may witness a moderate pullback for MSFT ahead of its FQ1’23 earnings call in October. That may prove to be a more attractive entry point for those looking to add this stellar stock to their long-term portfolios. We shall see.
MSFT Proved Why It Deserved The Big Five Seat In MAAMA
S&P Capital IQ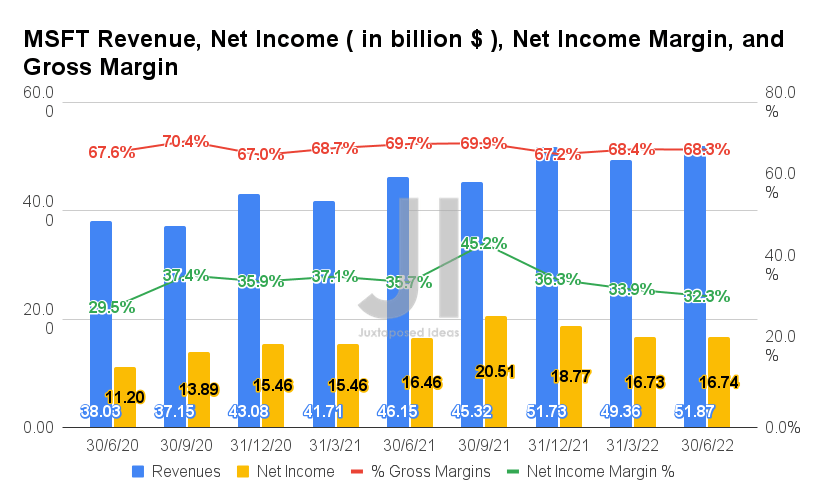
In FQ4’22, MSFT reported exemplary revenues of $51.87B and gross margins of 68.3%, representing YoY growth of 12.3% though a minimal decline of -1.4 percentage points, respectively. In contrast, the company reported net incomes of $16.74B and net income margins of 32.2%, representing an increase of 1.7% though a decline of -3.4 percentage points YoY, respectively.
These numbers represent a notable deceleration of growth compared to FQ3’22 levels, when MSFT reported 18.3% of revenue growth and 8.2% net income growth YoY. However, it is also apparent that Mr. Market is done bottoming in July 2022, given how many tech stocks are lifted post Q2 earnings call. Even the S&P 500 Index had recovered by 17.1% in the past two months, after a 21.8% decline in H1’22. This is a massive contrast to how MSFT had continued to fall post FQ3’22 call, despite the stellar performance then.
S&P Capital IQ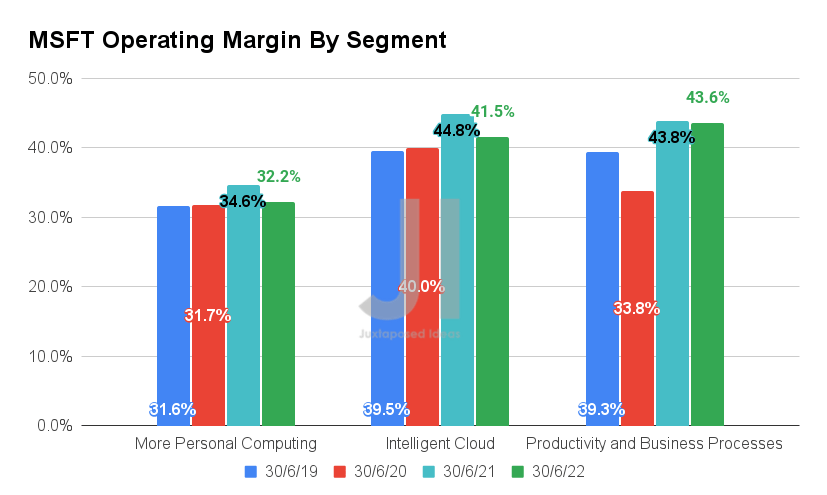
If we were to examine MSFT’s operating segments, it is apparent that the company continues to report massive profitability and decent growth thus far, especially in the Intelligent Cloud segment. The Cloud segment had reported a stellar CAGR of 22.43% in the past three years, with an excellent 41.5% of operating margin by FQ4’22. Its Productivity and Business Processes had also done well, with a CAGR of 14.56% since FY2019 and elevated operating margins of 43.6% in the last quarter.
Unfortunately, due to the recent fall in PC demand, we expect a continued headwind to MSFT’s Personal Computing segment in the short-term, given the -1.1% fall QoQ and minimal 1.9% YoY growth. The ongoing Zero Covid Policy in China does not help as well. In contrast, it will be interesting to monitor the company’s growth in advertising, given the recent Xandr acquisition and the unusual partnership with Netflix (NFLX) for the latter’s ad-supported streaming tier.
S&P Capital IQ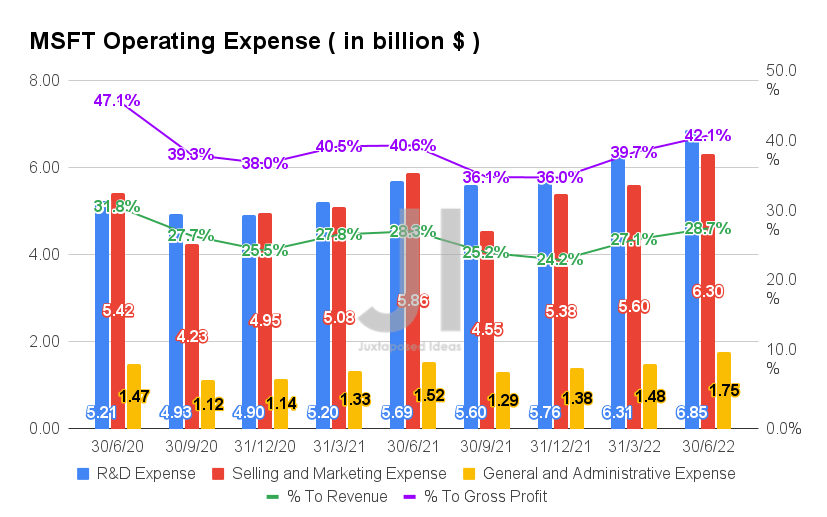
In the meantime, MSFT continues to invest in its operations, with total operating costs of $14.9B reported in FQ4’22. It represented a massive increase of 11.2% QoQ and 14% YoY. Therefore, impacting the ratio to its growing sales thus far, at 28.7% of its revenue and 42.1% of its gross profits in FQ4’22. On a separate note, MSFT also continues to increase its capital expenditure with $23.8B reported in FY2022, representing an increase of 15.5% YoY and 54.5% from FY2020 levels. With ten new data center regions planned for FY2023, we expect a relatively aggressive expenditure ahead as well, temporarily impacting its cash flow.
However, it is also essential to note that these investments were attributed to cloud engineering, its recent acquisitions, and the additional expenses from scaling down its Russian operations. Therefore, we are not overly concerned, since the first two would eventually be top and bottom lines accretive, while the latter would likely be a one-time cost.
S&P Capital IQ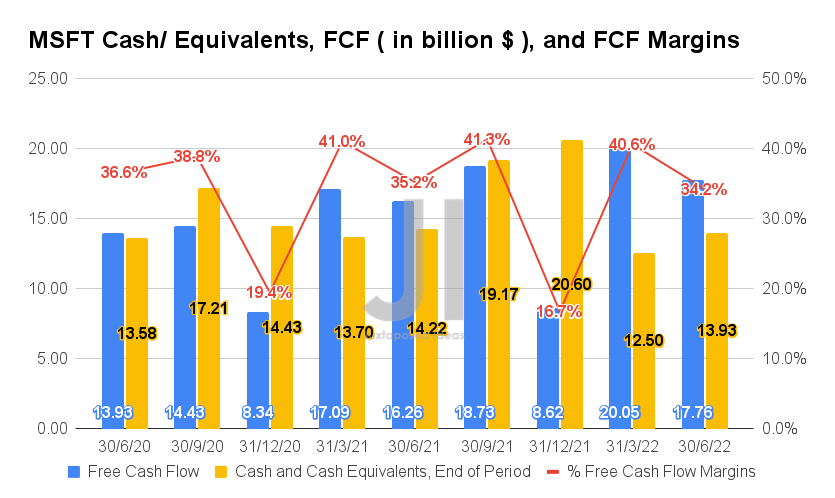
In the meantime, MSFT continues to prove itself through robust Free Cash Flow (FCF) generation, with an FCF of $17.76B and an FCF of 34.2% reported in FQ4’22. It represented a notable increase of 9.2% though a moderation of a percentage point YoY, respectively. Nonetheless, its massive cash and equivalents of $13.93B on its balance sheet remain more than sufficient for MSFT’s expansion plans and growth ahead.
S&P Capital IQ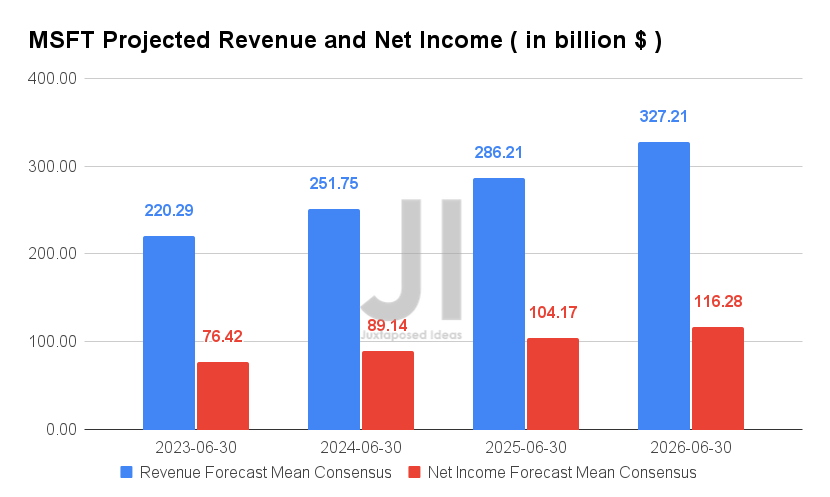
Over the next four years, MSFT is expected to report stellar revenue and net income growth at a CAGR of 13.34% and 12.45%, respectively. It is apparent that the COVID-19 pandemic had boosted the company’s net income profitability, from 31.2% in FY2019, to 36.7% in FY2022, and finally settling comfortably at 35.5% in FY2026. In addition, it had pulled forward MSFT’s revenue growth by a year, while boosting its future revenue growth from pre-pandemic CAGRs of 11.35%.
For FY2022, consensus estimates that MSFT will report revenues of $220.29B and net incomes of $76.42B, representing YoY growth of 11.1% and 5%, respectively. These numbers represented a notable moderation of -5.1% from previous estimates in March 2022. However, it is important to note that no company is able to sustain the hyper-growth experienced in the past two years. Therefore, pointing to MSFT’s highly resilient business model and sustainable growth strategies post-reopening cadence.
In the meantime, we encourage you to read our previous article on MSFT, which would help you better understand its position and market opportunities.
- Microsoft: It Is A Waiting Game Now
So, Is MSFT Stock A Buy, Sell, or Hold?
MSFT 5Y EV/Revenue and P/E Valuations
S&P Capital IQ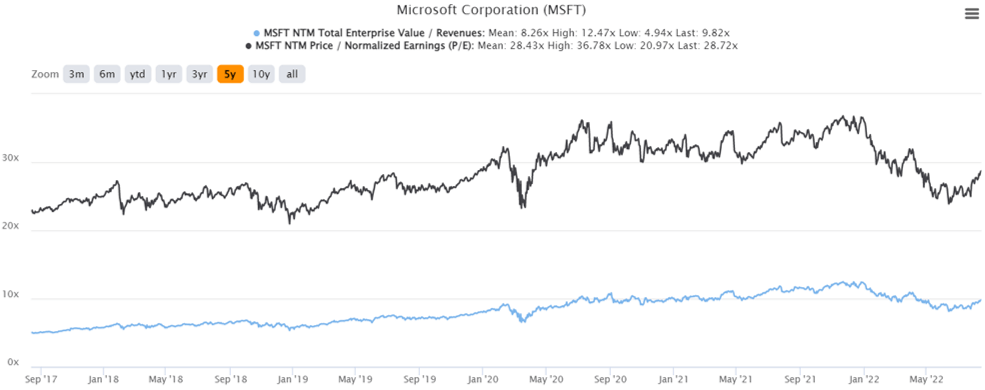
MSFT is currently trading at an EV/NTM Revenue of 9.82x and NTM P/E of 28.72x, higher than its 5Y EV/Revenue mean of 8.26x though in line with its 5Y P/E mean of 28.43x. The stock is also trading at $293.47, down 83.9% from its 52 weeks high of $349.67, though at a premium of 21.5% from its 52 weeks low of $241.51.
MSFT 5Y Stock Price
Seeking Alpha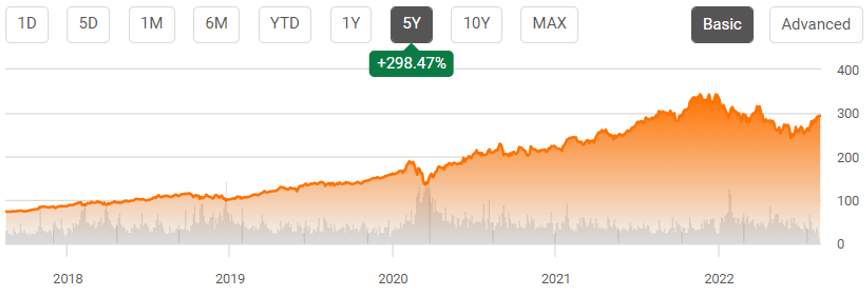
It is evident that Mr. Market had unnaturally boosted the recovery of MSFT stock since hitting the bottom in June 2022. However, we would like to exercise caution for now, given the downsized consensus price target of $327.67, compared to the previous estimate of $347.75 in July 2022. In addition, given the quick rally witnessed in the past three weeks, we expect a similarly sharp pullback at the Fed’s next hike in interest rates by September 2022.
Furthermore, it is also apparent that MSFT is trading at a premium now, compared to its previous 50-day moving average of $265.40. As a result, we encourage investors to wait for a deeper retracement before adding this excellent stock to their long-term portfolio.
Therefore, we rate MSFT stock as a Hold for now.
Be the first to comment