

PM Images
Investment Thesis
ATVI & MSFT YTD Stock Price
Seeking Alpha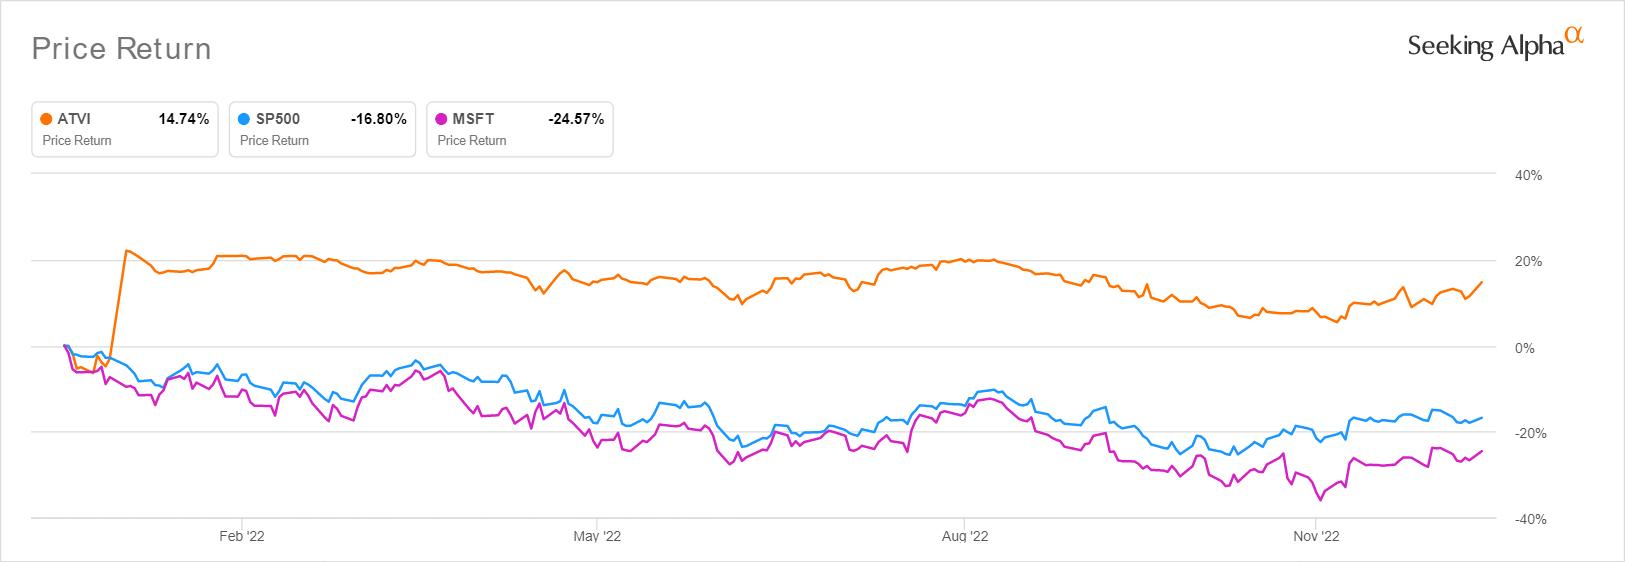
The natural question, of course, is whether to buy Microsoft Corporation (NASDAQ:MSFT) or Activision Blizzard (NASDAQ:ATVI) in light of the pending approval from all 16 countries through 2023. However, we reckon the better question is which company has the better prospects, since the deal has put ATVI’s valuation at $95 per pop with a 23.31% upside from current levels.
Naturally, long-term ATVI investors should simply hold on for the rough ride ahead, due to the highly attractive risk-reward ratio, should the acquisition be consummated successfully. That is if one had entered at a lower dollar cost average against the deal valuations. Otherwise, things look relatively risky for those looking to nibble at these levels, due to the vehemence of FTC saga, China’s refusal for a simplified approval, and the EU’s in-depth investigation.
On the other hand, MSFT continues to trade at a notable -35.53% discount from our aggressive price target of $399.01 based on its FY2026 EPS of $16.07 and current P/E valuations of 24.83x. Otherwise, with a 14.75% upside potential from the consensus target of $295.18. Despite the notable -24.19% plunge from November 2021 levels, the stock continues to offer a tremendous 5Y total price return of 214.2% and 10Y returns of 1,029.6% against the former at 23.5% and 627.5%, respectively, significantly boosted by the acquisition deal, of course.
Thereby, pointing to MSFT’s excellent performance moving forward, despite the high probability of recession in 2023. We shall discuss this further.
ATVI’s Expansion In Profit Margins Justifies The Hefty $69B Price Tag
ATVI Revenue, Net Income (in billion $) %, EBIT %, and EPS
S&P Capital IQ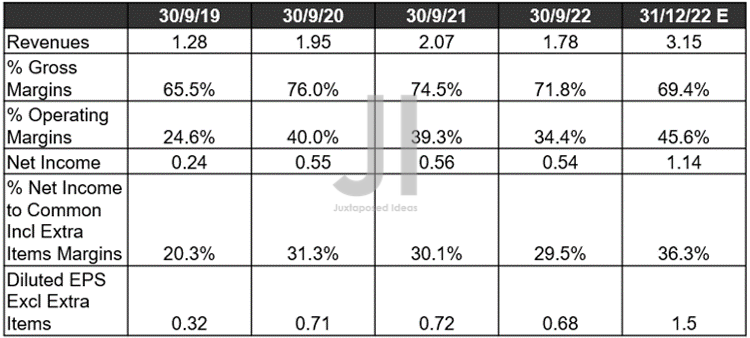
ATVI’s margins have naturally been decelerating post-reopening cadence, a given due to the worsening macroeconomics. However, we must also highlight the sustained expansion of its EBIT/ net income margins compared to pre-pandemic levels, pointing to the continued growth of its EPS profitability. Impressive indeed, despite the notable 37.6% increase in the operating expenses and 377.77% in stock-based compensation since FQ3’19. It is no wonder that market analysts are now expecting the company to deliver excellent FQ4’22 revenues of $3.15B and EPS of $1.5, especially after the stellar double beat and operating metrics in FQ3’22.
ATVI FCF (in billion $) % and Balance Sheet
S&P Capital IQ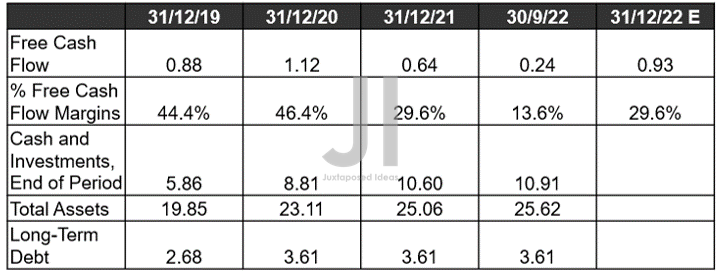
Furthermore, with ATVI’s total assets of $25.62B and cash/ investments of $10.91B by the latest quarter, we are not concerned about its immediate liquidity and dividend safety. The company has also kept its reliance on long-term debts stable at $3.61B, which are remarkably well-laddered through 2050. Combined with the excellent projection of $0.93B of Free Cash Flow [FCF] generation in FQ4’22, ATVI remains a highly profitable company, no matter the deceleration from hyper-pandemic levels. An uncertain economy cannot sustain these levels of hypergrowth indeed.
ATVI Projected Revenue, Net Income (in billion $) %, EBIT %, EPS FCF %, Dividends, and Debts
S&P Capital IQ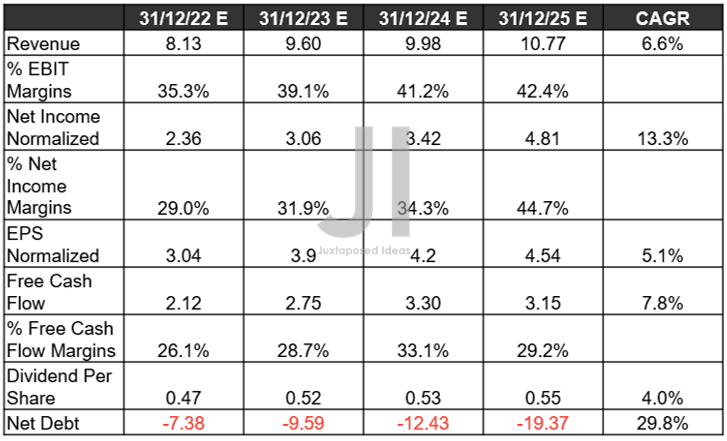
Over the next four years, ATVI is still expected to report decent top and bottom line growth at a CAGR of 6.6% and 5.1%, respectively, against pre-pandemic levels of -1.1%/0.8% and hyper-pandemic levels of 14.3%/28.5%. The expansion in its EBIT/ net income/ FCF margins is definitely justifying the hefty $69B price tag, due to the impressive growth from 32.5%/27.2%/26.8% in FY2019, 42%/34.9%/27.9% in FY2021, and finally to 42.4%/44.7%/29.2% in FY2025.
Thereby, also triggering the improvement in ATVI’s EPS to $4.54 and liquidity on the balance sheet with net debts of -$19.37B by FY2025, against FY2019 levels of -$2.91B and FY2021 levels of -$6.7B. Given these levels of profitability post-reopening deceleration, it is no wonder that MSFT is aggressively defending the acquisition against SONY’s continued objection.
MSFT Can Well Afford ATVI Many Times Over
MSFT Balance Sheet (in billion $)
S&P Capital IQ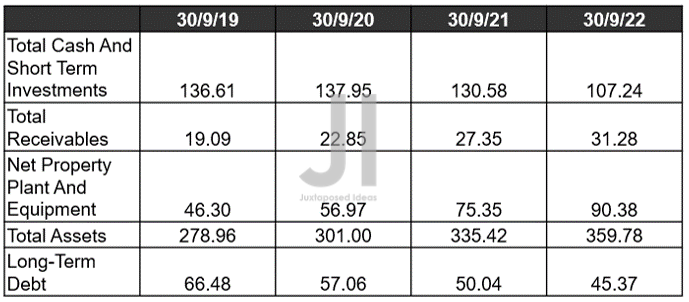
By the latest quarter, MSFT boasts an impressive balance sheet well worth its weight in the $1.83T of market cap. It reported an excellent $107.24B of cash and investments, while also growing its total receivables to $31.28B at the same time.
Despite the devastating effects of the pandemic, MSFT has obviously benefited from the hyper PC demand then, thereby punctuating the stellar growth of its total assets by 28.97% and $80.82B since Q3’19 to $359.78B. All while also deleveraging by -31.75% and -$21.11B at the same time. Therefore, it is no secret that MSFT can well afford the heft $69B price tag, especially since the deal appears fairly valued, albeit at an unpropitious macroeconomic timing.
MSFT Projected Revenue, Net Income (in billion $) %, EBIT %, EPS FCF %, Dividends, and Debts
S&P Capital IQ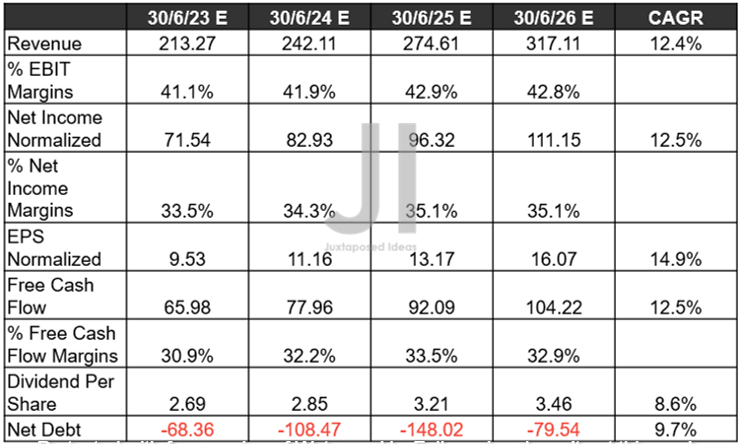
Furthermore, MSFT’s forward execution remains stellar. Market analysts expect the company to deliver a revenue CAGR of 12.4% and an EPS CAGR of 14.9% through FY2026, while its margins are expected to remain stable at these levels due to the enormity of its business offerings. Then again, its projected revenues of $317.11B, net incomes of $111.15B, and FCF generation of $104.22B by FY2026 are not to be taken lightly as well, especially since it contributes to the remarkable strength of its balance sheet with net debts of -$148.02B by FY2025. What is there not to like about this stock?
In the meantime, we encourage you to read our previous article on MSFT, which would help you better understand its position and market opportunities.
So, Are ATVI Or MSFT Stock Buy, Sell, or Hold?
ATVI 5Y EV/Revenue and P/E Valuations
S&P Capital IQ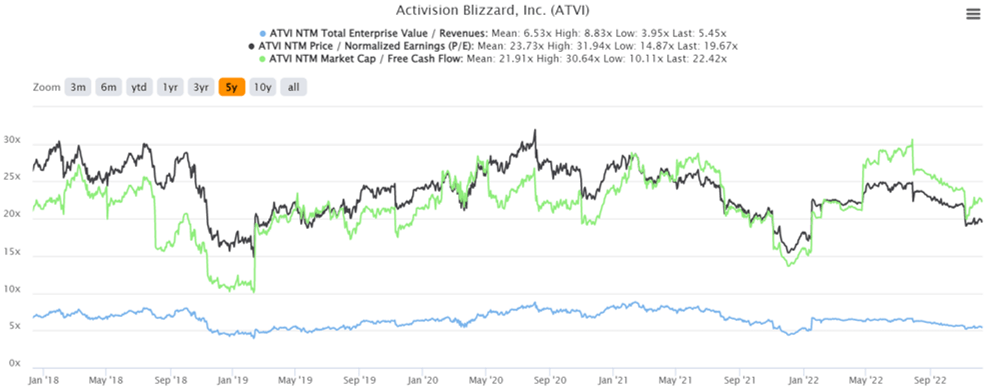
ATVI is currently trading at an EV/NTM Revenue of 5.45x, NTM P/E of 19.67x, and NTM Market Cap/FCF of 22.42x, lower than its 5Y mean of 6.53x and 23.73x, though higher than 21.91x, respectively. Otherwise, under-valued based on its YTD mean of 6.13x, 22.41x, and 24.25x, respectively. Based on the FY2025 EPS of $4.54 and the pre-deal P/E valuations of 17.32x, we will arrive at an aggressive forward price target of $78.63, against its pre-deal stock price of $65.39.
Due to the minimal 17.23% forward premium from the $69B deal, we reckon that MSFT is somewhat paying a fair price to acquire ATVI. Especially since the stock has been averaging a higher 5Y P/E mean compared to the last reported 19.67x, due to the recent FTC headwinds and peak recessionary fears.
MSFT 5Y EV/Revenue and P/E Valuations
S&P Capital IQ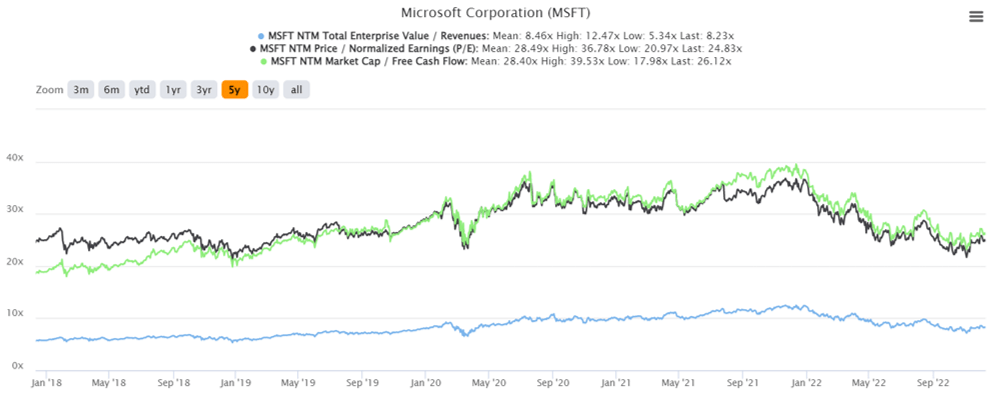
In the meantime, MSFT has also suffered from the worsening macroeconomics and pessimistic sentiments, trading below its 5Y and YTD means. Nonetheless, due to its robust fundamental and operating metrics, we are not concerned about this temporal discount, since the company is expected to impressively outperform through FY2026.
Therefore, due to the uncertainty of the deal closure, we prefer to rate MSFT as the buy, while putting a Hold rating on the former. Though past performance does not guarantee forward results, MSFT’s next-decade prospects remain highly promising as Nadella steers the Big Tech ship excellently, no matter the recession, soft landing, the Feds, and the FTC/ China headwinds. Consequently, opportunistic investors that choose to add ATVI at current levels should also size their portfolios accordingly, depending on the dollar cost average, in the event of a failed deal by 2023.
Be the first to comment